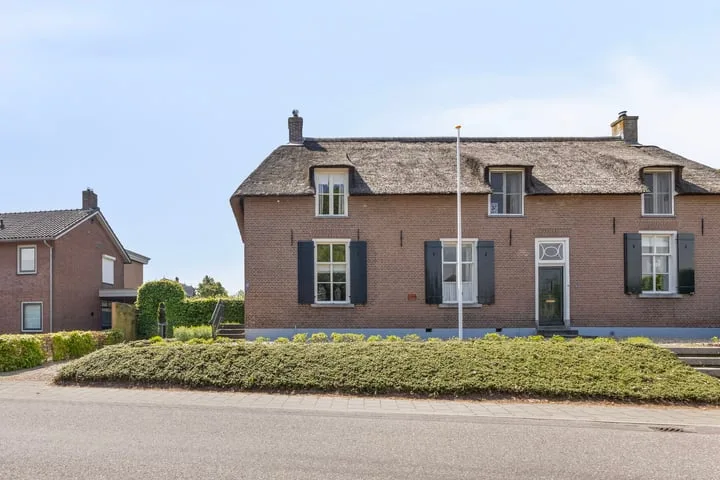
- Sold
Molenweg 62
6617BE Bergharen
€ 850.000 k.k.
€ 4.292/m²
- Living area
- 198 m²
- Land area
- 2351 m²
- Bedrooms
- 4
View 10 sold houses in Bergharen
Type to search. Use arrow down and arrow up to navigate through results and press Enter to open.
Hidden search suggestions.
Compare sold homes in Bergharen or view the current offering in this location directly.
On this page you will find recently sold homes in Bergharen. Use this overview to better estimate selling prices, popular neighborhoods, and the local housing supply before you choose a real estate agent. Also view the current housing supply with 15 houses in Bergharen.
6617BE Bergharen
€ 850.000 k.k.
€ 4.292/m²
6617AV Bergharen
€ 485.000 k.k.
€ 3.789/m²
6617AW Bergharen
€ 450.000 k.k.
€ 3.333/m²
6617BC Bergharen
€ 425.000 k.k.
€ 3.899/m²
6617BC Bergharen
€ 445.000 k.k.
€ 2.986/m²
6617CE Bergharen
€ 439.000 k.k.
€ 3.403/m²
6617KE Bergharen
€ 1.050.000 k.k.
€ 4.816/m²
6617CB Bergharen
€ 575.000 k.k.
€ 3.212/m²
6617AL Bergharen
€ 725.000 k.k.
€ 3.856/m²
6617AE Bergharen
€ 475.000 k.k.
€ 4.094/m²
Bekijk recente verkopen en ontvang gratis offertes van lokale makelaars. Vergelijk meer dan 37 makelaars in Bergharen.
Zelf je woning verkopen in Bergharen? Vergelijk verkoopmakelaars in Bergharen of bekijk de beste verkoopmakelaars in Bergharen als referentie bij jouw keuze.
Makelaars maken scherpere voorstellen als ze weten dat je vergelijkt — vraag offertes aan voor verkoop of aankoop.
Short answers about housing prices, sold homes and comparing real estate agents in Bergharen.
De kosten van een makelaar in Bergharen verschillen per kantoor, woningtype en verkoopaanpak. In Bergharen kun je 37 real estate agents vergelijken; bekijk daarom ook de makelaars in Bergharen om tarieven, presentatie en lokale ervaring beter naast elkaar te zetten.
On this page we currently show 10 sold houses in Bergharen from our selection. This helps you to better assess recent transactions and the local housing market.
Houses sold in Bergharen give insight into asking prices, house types and neighborhoods where recent transactions have taken place. Compare this also with the current housing stock in Bergharen to better understand the market.
You can use sold homes as a first market indication, but a local real estate agent can better take into account finishing, location, maintenance and current demand in Bergharen.
Vergelijk de 37 real estate agents in Bergharen op lokale verkoopervaring, reviews, verwachte opbrengst, courtage en marketingaanpak. Bekijk verkoopmakelaars in Bergharen of de top 10 makelaars in Bergharen om snel sterke kantoren te ontdekken.
View current location data on residents, WOZ development, housing stock, energy consumption, business activity and safety in Bergharen. In 2026 were there 1.764 residents. The average WOZ value in 2025 is EUR 485.000.
These figures help to better assess and compare the housing stock in Bergharen with recent sold homes. Orient yourself then on suitable top real estate agents in Bergharen for sales advice in this region.
Residents
1.764
Last year: 2026
Average WOZ
EUR 485.000
Last year: 2025
Average income per person.
EUR 34.700
Source: AllNumbers
Crimes (current year)
29
Total registered
| Year | Residents |
|---|---|
| 2021 | 1.750 |
| 2022 | 1.750 |
| 2023 | 1.795 |
| 2024 | 1.775 |
| 2025 | 1.765 |
| 2026 | 1.764 |
| Year | Average WOZ |
|---|---|
| 2021 | EUR 350.000 |
| 2022 | EUR 392.000 |
| 2023 | EUR 435.000 |
| 2024 | EUR 456.000 |
| 2025 | EUR 485.000 |
Hoger
390
Praktisch
310
Middelbaar
650
Europa
65
Nederland
1.650
Buiten Europa
50
Label A
169
Label C
153
Label B
139
Label G
107
Label D
73
Label F
62
Label A+++
24
Label E
15
Label A++++
7
Label A+
6
Label A++
4
Label A+++++
0
| Year | Gas (m3) | Electricity (kWh) |
|---|---|---|
| 2020 | 1.600 | 3.760 |
| 2021 | 1.810 | 3.800 |
| 2022 | 1.410 | 3.550 |
| 2023 | 1.110 | 3.380 |
| 2024 | 1.090 | 3.450 |
Hoekwoning
Gas: 840 • Electricity: 2.610
Huurwoning
Gas: 870 • Electricity: 2.270
Koopwoning
Gas: 1.160 • Electricity: 3.620
Appartement
Gas: 1.090 • Electricity: 3.060
Tussenwoning
Gas: 700 • Electricity: 2.510
Vrijstaande woning
Gas: 1.330 • Electricity: 3.850
Twee-onder-één-kap woning
Gas: 900 • Electricity: 3.060
Total number of company establishments: 270
| Period | Crimes |
|---|---|
| jan 2026 | 0 |
| jul 2025 | 6 |
| jun 2025 | 3 |
| mei 2025 | 2 |
| mrt 2025 | 1 |
| mrt 2026 | 1 |
| nov 2024 | 1 |
| nov 2025 | 2 |
| okt 2024 | 3 |
| okt 2025 | 1 |
| sep 2024 | 3 |
| sep 2025 | 1 |
These figures give an indicative picture of safety trends in the living environment of Bergharen.
Short answers based on current local statistics, handy for a quick comparison of the living environment.
Bergharen telt in 2026 ongeveer 1.764 inwoners.
De gemiddelde WOZ-waarde in Bergharen is in 2025 circa € 485.000.
Het gemiddelde inkomen per inwoner in Bergharen ligt rond € 34.700 per jaar.
Voor het huidige jaar gaat het om ongeveer 29 geregistreerde misdrijven. Gebruik deze cijfers als indicatie en vergelijk trends per periode.
In Bergharen komt vooral "Vrijstaande woningen" veel voor, met ongeveer 390 woningen.