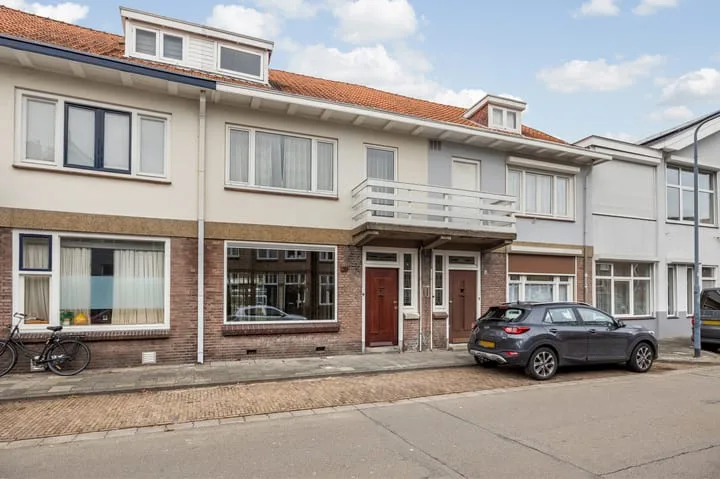
- Sold
Irenestraat 24
4811SC Breda
€ 750.000 k.k.
€ 5.357/m²
- Living area
- 140 m²
- Land area
- 191 m²
- Bedrooms
- 4
View 1.647 sold houses in Breda
Type to search. Use arrow down and arrow up to navigate through results and press Enter to open.
Hidden search suggestions.
Compare sold homes in Breda or view the current offering in this location directly.
On this page you will find recently sold homes in Breda. Use this overview to better estimate selling prices, popular neighborhoods, and the local housing supply before you choose a real estate agent. Also view the current housing supply with 2.247 houses in Breda.
4811SC Breda
€ 750.000 k.k.
€ 5.357/m²
4811KC Breda
€ 335.000 k.k.
€ 5.491/m²
4818EV Breda
€ 349.000 k.k.
€ 4.474/m²
4822WS Breda
€ 345.000 k.k.
€ 4.480/m²
4817WC Breda
€ 325.000 k.k.
€ 4.220/m²
4812XT Breda
€ 315.000 k.k.
€ 5.080/m²
4824NK Breda
€ 398.000 k.k.
€ 4.061/m²
4826GK Breda
€ 285.000 k.k.
€ 3.701/m²
4817KZ Breda
€ 459.000 k.k.
€ 4.731/m²
4817MD Breda
€ 575.000 k.k.
€ 4.637/m²
4811GD Breda
€ 435.000 k.k.
€ 5.117/m²
4812PL Breda
€ 225.000 k.k.
€ 8.333/m²
4811PV Breda
€ 659.000 k.k.
€ 4.954/m²
4811BM Breda
€ 385.000 k.k.
€ 4.935/m²
4827MB Breda
€ 675.000 k.k.
€ 4.041/m²
4812GE Breda
€ 480.000 k.k.
€ 5.161/m²
4818HB Breda
€ 575.000 k.k.
€ 4.078/m²
4811JL Breda
€ 470.000 k.k.
€ 5.529/m²
4812AD Breda
€ 450.000 k.k.
€ 4.639/m²
4817ML Breda
€ 259.000 k.k.
€ 6.641/m²
4814CN Breda
€ 450.000 k.k.
€ 4.018/m²
4827CJ Breda
€ 395.000 k.k.
€ 2.969/m²
4835BD Breda
€ 519.000 k.k.
€ 4.185/m²
4817NS Breda
€ 459.000 k.k.
€ 3.558/m²
4818BL Breda
€ 320.000 k.k.
€ 4.444/m²
4812XT Breda
€ 315.000 k.k.
€ 5.000/m²
4811AA Breda
€ 275.000 k.k.
€ 5.729/m²
4818GB Breda
€ 850.000 k.k.
€ 5.448/m²
Get free quotes from realtors with local market knowledge in Breda.
Selling a home in Breda? Compare real estate agents who know the local housing market. Also check out all real estate agents in Breda or the top 10 real estate agents in Breda for extra context for your choice.
By comparing brokers and requesting quotes
Short answers about housing prices, sold homes and comparing real estate agents in Breda.
The costs of a real estate agent in Breda vary per office, property type and sales approach. Therefore, compare multiple quotes and also look at the real estate agents in Breda to better compare rates, presentation and local experience.
On this page we currently show 1.647 sold houses in Breda from our selection. This helps you to better assess recent transactions and the local housing market.
Verkochte woningen in Breda geven inzicht in vraagprijzen, woningtypes en buurten waar recent transacties hebben plaatsgevonden. Vergelijk dit ook met het actuele woningaanbod in Breda om de markt beter te duiden.
Je kunt verkochte woningen gebruiken als eerste marktindicatie, maar een lokale makelaar kan beter rekening houden met afwerking, ligging, onderhoud en actuele vraag in Breda.
Vergelijk makelaars in Breda op lokale verkoopervaring, reviews, verwachte opbrengst, courtage en marketingaanpak. De top 10 makelaars in Breda helpt om snel sterke kantoren te ontdekken.
View current location data on residents, WOZ development, housing stock, energy consumption, business activity and safety in Breda. In 2025 were there 153.845 residents. The average WOZ value in 2025 is EUR 389.529.
These figures help to better assess and compare the housing stock in Breda with recent sold homes. Orient yourself then on suitable top real estate agents in Breda for sales advice in this region.
Residents
153.845
Last year: 2025
Average WOZ
EUR 389.529
Last year: 2025
Average income per person.
EUR 36.350
Source: AllNumbers
Crimes (current year)
10.636
Total registered
| Year | Residents |
|---|---|
| 2021 | 150.235 |
| 2022 | 150.455 |
| 2023 | 151.765 |
| 2024 | 153.220 |
| 2025 | 153.845 |
| Year | Average WOZ |
|---|---|
| 2021 | EUR 290.384 |
| 2022 | EUR 312.371 |
| 2023 | EUR 355.055 |
| 2024 | EUR 363.404 |
| 2025 | EUR 389.529 |
Hoger
48.560
Praktisch
27.200
Middelbaar
43.380
Europa
16.620
Nederland
105.485
Buiten Europa
31.750
Label A
20.074
Label C
17.396
Label B
12.152
Label D
6.587
Label E
5.910
Label F
4.881
Label G
4.294
Label A+
3.409
Label A++
2.644
Label A+++
1.628
Label A++++
154
Label A+++++
40
| Year | Gas (m3) | Electricity (kWh) |
|---|---|---|
| 2020 | 845 | 2.692 |
| 2021 | 938 | 2.719 |
| 2022 | 726 | 2.550 |
| 2023 | 628 | 2.379 |
| 2024 | 611 | 2.397 |
Hoekwoning
Gas: 892 • Electricity: 2.811
Huurwoning
Gas: 474 • Electricity: 1.962
Koopwoning
Gas: 751 • Electricity: 2.737
Appartement
Gas: 407 • Electricity: 1.840
Tussenwoning
Gas: 733 • Electricity: 2.577
Vrijstaande woning
Gas: 1.525 • Electricity: 4.233
Twee-onder-één-kap woning
Gas: 1.110 • Electricity: 3.224
Total number of company establishments: 24.680
| Period | Crimes |
|---|---|
| jan 2026 | 862 |
| jul 2025 | 918 |
| jun 2025 | 875 |
| mei 2025 | 908 |
| mrt 2025 | 953 |
| mrt 2026 | 893 |
| nov 2024 | 785 |
| nov 2025 | 887 |
| okt 2024 | 837 |
| okt 2025 | 922 |
| sep 2024 | 805 |
| sep 2025 | 838 |
These figures give an indicative picture of safety trends in the living environment of Breda.
Short answers based on current local statistics, handy for a quick comparison of the living environment.
Breda telt in 2025 ongeveer 153.845 inwoners.
De gemiddelde WOZ-waarde in Breda is in 2025 circa € 389.529.
Het gemiddelde inkomen per inwoner in Breda ligt rond € 36.350 per jaar.
Voor het huidige jaar gaat het om ongeveer 10.636 geregistreerde misdrijven. Gebruik deze cijfers als indicatie en vergelijk trends per periode.
In Breda komt vooral "Appartementen" veel voor, met ongeveer 36.245 woningen.