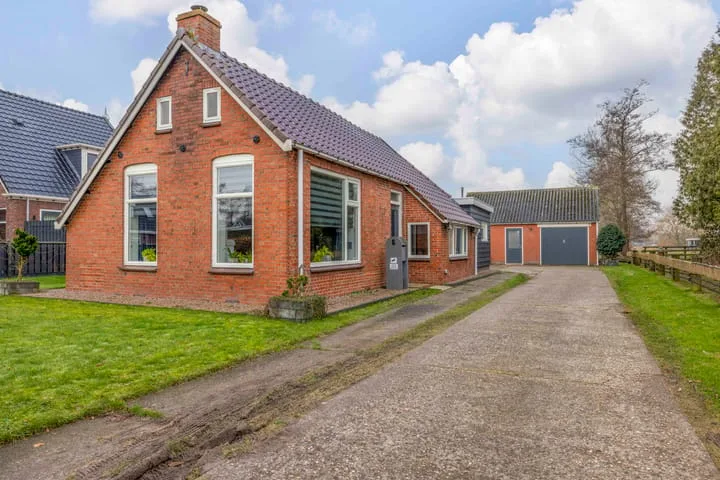
- Sold
Foarstrjitte 78 b
9271KJ De Westereen
€ 300.000 k.k.
€ 4.000/m²
- Living area
- 75 m²
- Land area
- —
- Bedrooms
- 1
View 20 sold houses in De Westereen
Type to search. Use arrow down and arrow up to navigate through results and press Enter to open.
Hidden search suggestions.
Compare sold homes in De Westereen or view the current offering in this location directly.
On this page you will find recently sold homes in De Westereen. Use this overview to better estimate selling prices, popular neighborhoods, and the local housing supply before you choose a real estate agent. Also view the current housing supply with 41 houses in De Westereen.
9271KJ De Westereen
€ 300.000 k.k.
€ 4.000/m²
9271BT De Westereen
€ 395.000 k.k.
€ 3.160/m²
9271LK De Westereen
€ 425.000 k.k.
€ 2.778/m²
9271HK De Westereen
€ 469.000 k.k.
€ 3.280/m²
9271HG De Westereen
€ 399.000 k.k.
€ 5.250/m²
9271GN De Westereen
€ 595.000 k.k.
€ 3.914/m²
9271VE De Westereen
€ 519.500 k.k.
€ 2.870/m²
9271VJ De Westereen
Price upon request
9271CA De Westereen
€ 285.000 k.k.
€ 3.313/m²
9271HK De Westereen
€ 459.000 k.k.
€ 3.375/m²
9271GE De Westereen
€ 525.000 k.k.
€ 3.776/m²
9271KK De Westereen
€ 389.500 k.k.
€ 3.818/m²
9271GL De Westereen
€ 275.000 k.k.
€ 2.696/m²
9271HM De Westereen
€ 499.000 k.k.
€ 2.558/m²
9271BT De Westereen
€ 349.500 k.k.
€ 3.426/m²
9271GD De Westereen
€ 445.000 k.k.
€ 3.068/m²
9271JH De Westereen
€ 535.000 k.k.
€ 3.282/m²
9271HC De Westereen
€ 425.000 k.k.
€ 4.775/m²
9271VE De Westereen
€ 545.000 k.k.
€ 3.385/m²
9271LJ De Westereen
€ 485.000 k.k.
€ 3.789/m²
Bekijk recente verkopen en ontvang gratis offertes van lokale verkoopmakelaars in De Westereen.
Zelf je woning verkopen in De Westereen? Vergelijk verkoopmakelaars in De Westereen of bekijk de beste verkoopmakelaars in De Westereen als referentie bij jouw keuze.
Makelaars maken scherpere voorstellen als ze weten dat je vergelijkt — vraag offertes aan voor verkoop of aankoop.
Short answers about housing prices, sold homes and comparing real estate agents in De Westereen.
The costs of a real estate agent in De Westereen vary per office, property type and sales approach. Therefore, compare multiple quotes and also look at the real estate agents in De Westereen to better compare rates, presentation and local experience.
On this page we currently show 20 sold houses in De Westereen from our selection. This helps you to better assess recent transactions and the local housing market.
Houses sold in De Westereen give insight into asking prices, house types and neighborhoods where recent transactions have taken place. Compare this also with the current housing stock in De Westereen to better understand the market.
You can use sold homes as a first market indication, but a local real estate agent can better take into account finishing, location, maintenance and current demand in De Westereen.
Vergelijk makelaars in De Westereen op lokale verkoopervaring, reviews, verwachte opbrengst, courtage en marketingaanpak. Bekijk verkoopmakelaars in De Westereen of de top 10 makelaars in De Westereen om snel sterke kantoren te ontdekken.
View current location data on residents, WOZ development, housing stock, energy consumption, business activity and safety in De Westereen. In 2025 were there 5.115 residents. The average WOZ value in 2025 is EUR 287.000.
These figures help to better assess and compare the housing stock in De Westereen with recent sold homes. Orient yourself then on suitable top real estate agents in De Westereen for sales advice in this region.
Residents
5.115
Last year: 2025
Average WOZ
EUR 287.000
Last year: 2025
Average income per person.
EUR 26.600
Source: AllNumbers
Crimes (current year)
114
Total registered
| Year | Residents |
|---|---|
| 2021 | 5.000 |
| 2022 | 5.040 |
| 2023 | 5.065 |
| 2024 | 5.110 |
| 2025 | 5.115 |
| Year | Average WOZ |
|---|---|
| 2021 | EUR 186.000 |
| 2022 | EUR 215.000 |
| 2023 | EUR 251.000 |
| 2024 | EUR 276.000 |
| 2025 | EUR 287.000 |
Hoger
560
Praktisch
1.310
Middelbaar
1.810
Europa
190
Nederland
4.705
Buiten Europa
230
Label B
482
Label A
452
Label C
436
Label G
284
Label D
213
Label E
191
Label F
158
Label A+
53
Label A++
38
Label A+++
26
Label A++++
3
Label A+++++
0
| Year | Gas (m3) | Electricity (kWh) |
|---|---|---|
| 2020 | 1.370 | 2.540 |
| 2021 | 1.520 | 2.560 |
| 2022 | 1.190 | 2.370 |
| 2023 | 970 | 2.320 |
| 2024 | 960 | 2.420 |
Hoekwoning
Gas: 950 • Electricity: 1.870
Huurwoning
Gas: 870 • Electricity: 1.630
Koopwoning
Gas: 1.080 • Electricity: 3.000
Appartement
Gas: 710 • Electricity: 1.550
Tussenwoning
Gas: 900 • Electricity: 1.540
Vrijstaande woning
Gas: 1.130 • Electricity: 2.950
Twee-onder-één-kap woning
Gas: 880 • Electricity: 2.540
Total number of company establishments: 565
| Period | Crimes |
|---|---|
| jan 2025 | 6 |
| jan 2026 | 6 |
| jul 2025 | 9 |
| jun 2025 | 10 |
| mei 2025 | 10 |
| mrt 2025 | 9 |
| nov 2024 | 4 |
| nov 2025 | 6 |
| okt 2024 | 8 |
| okt 2025 | 10 |
| sep 2024 | 12 |
| sep 2025 | 10 |
These figures give an indicative picture of safety trends in the living environment of De Westereen.
Short answers based on current local statistics, handy for a quick comparison of the living environment.
De Westereen telt in 2025 ongeveer 5.115 inwoners.
De gemiddelde WOZ-waarde in De Westereen is in 2025 circa € 287.000.
Het gemiddelde inkomen per inwoner in De Westereen ligt rond € 26.600 per jaar.
Voor het huidige jaar gaat het om ongeveer 114 geregistreerde misdrijven. Gebruik deze cijfers als indicatie en vergelijk trends per periode.
In De Westereen komt vooral "Vrijstaande woningen" veel voor, met ongeveer 1.072 woningen.