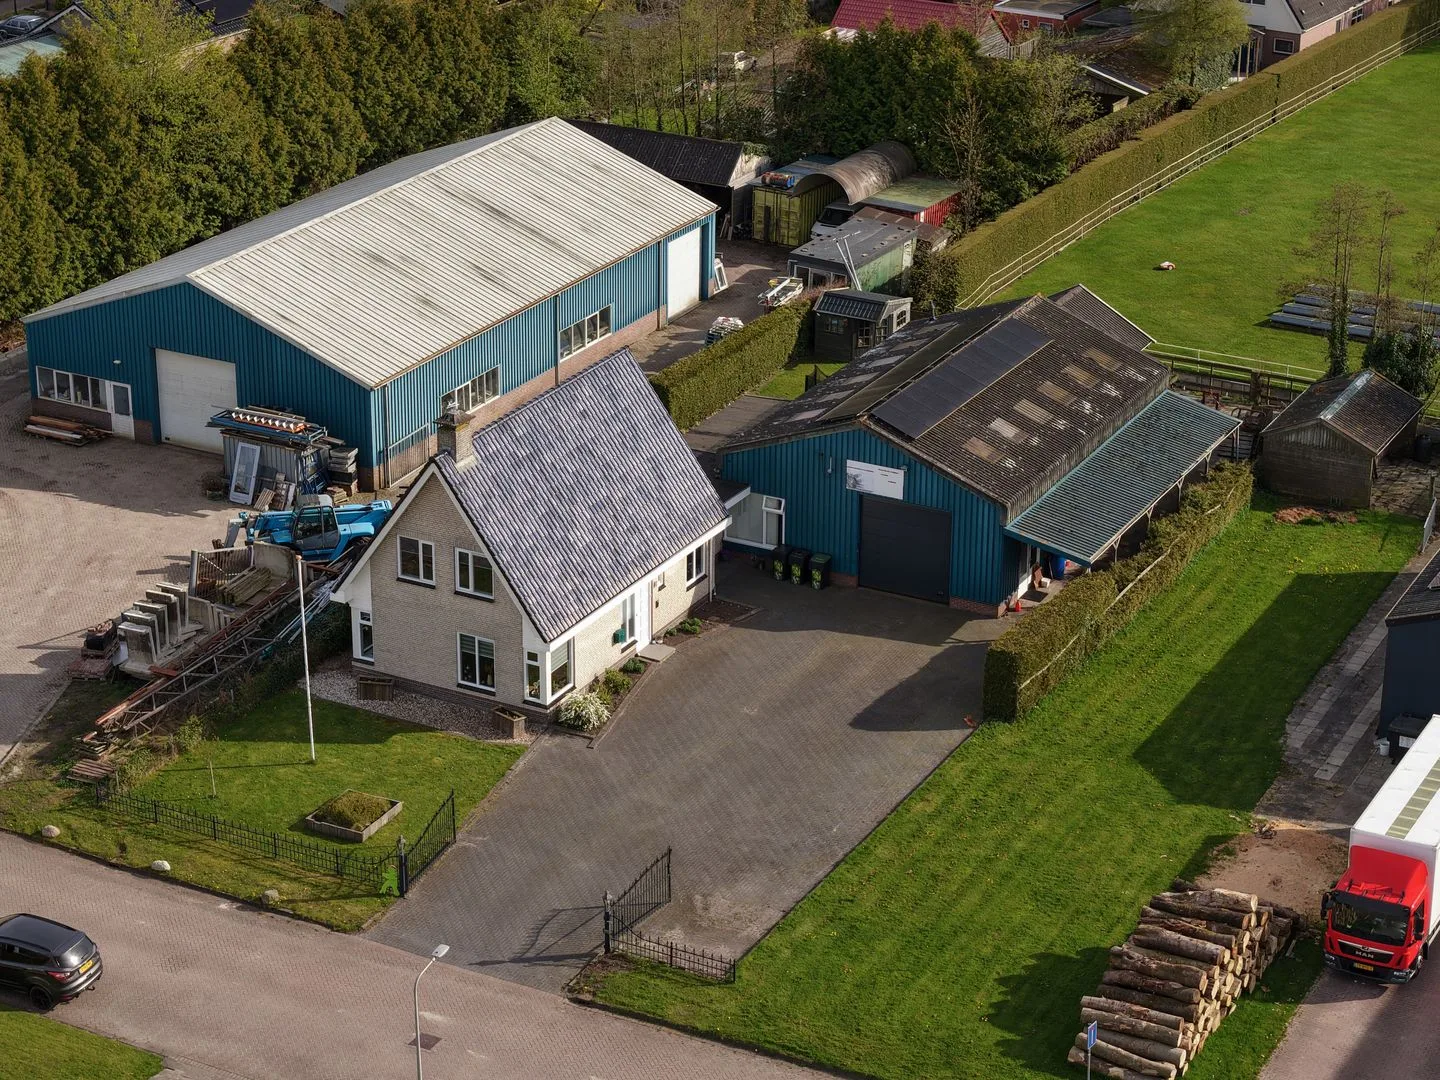
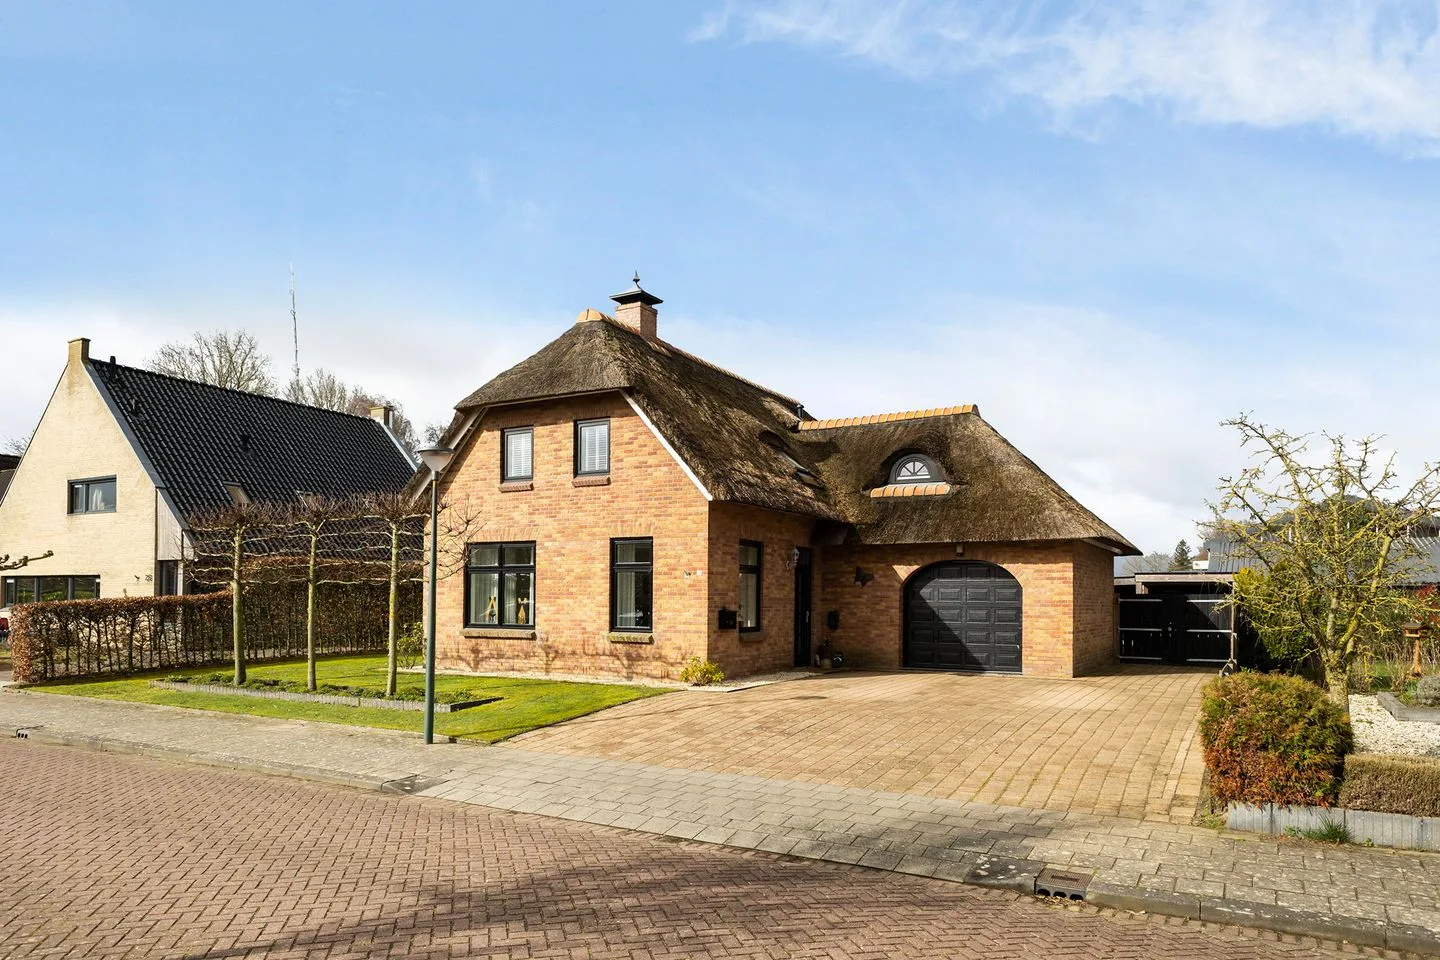
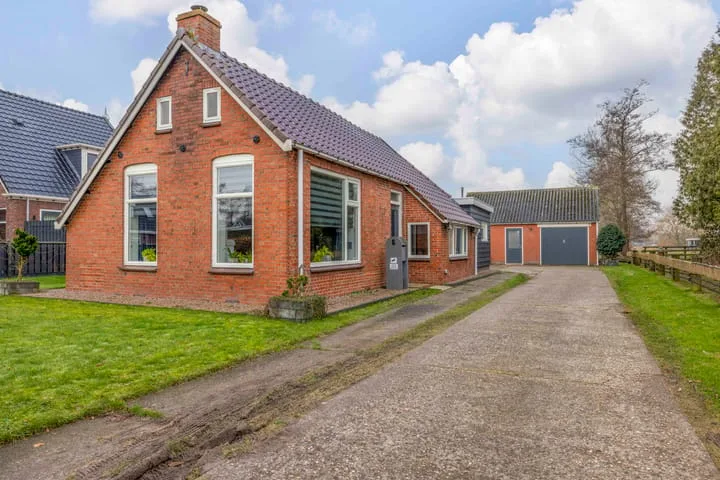
Housing offer in De Westereen

Searching in 40 houses in De Westereen

Connected to: Vastgoed Nederland NVM Makelaars

View the current housing stock in De Westereen and quickly filter by price, living area, rooms and more. There are currently 40 houses in this place within our selection. View also 20 sold houses in De Westereen for extra insight into the local housing market.

Selection

Search and filter homes

Set your preferences and discover homes that suit you.

Total supply 243.501
Filters

Set price, area and other characteristics. Adjust a filter or click on Show homes. Location changes directly above.

Reset filters

You search for

  • Place De Westereen

Selling a home in De Westereen? Compare realtor offers

Get free quotes from real estate agents with local market knowledge. Compare more than 18 real estate agents in De Westereen.

Free request a quote

  • Quotes in De Westereen
  • Non-binding
  • Personal
  • Compare free rates

Selling a home in De Westereen? Compare all real estate agents in De Westereen or view the top 10 real estate agents in De Westereen for extra context for your choice.

Compare multiple quotes

Real estate agents make sharper offers when they know you're comparing — ask for quotes for sale or purchase.

Frequently asked questions about homes in De Westereen

Practical answers about housing supply, sales and comparing real estate agents in De Westereen.

Residential and neighborhood statistics in De Westereen

View current location data on residents, WOZ development, housing stock, energy consumption, business activity and safety in De Westereen. In 2026 were there 5.159 residents. The average WOZ value in 2025 is EUR 287.000.

These figures help to better assess and compare the housing stock in De Westereen with recent sold homes. Orient yourself then on suitable top real estate agents in De Westereen for sales advice in this region.

Residents

5.159

Last year: 2026

Average WOZ

EUR 287.000

Last year: 2025

Average income per person.

EUR 26.600

Source: AllNumbers

Crimes (current year)

114

Total registered

Demographics and WOZ development

Inhabitants per year

Inhabitants per year in De Westereen
Year Residents
2021 5.000
2022 5.040
2023 5.065
2024 5.110
2025 5.115
2026 5.159

Annual WOZ value

WOZ value per year in De Westereen
Year Average WOZ
2021 EUR 186.000
2022 EUR 215.000
2023 EUR 251.000
2024 EUR 276.000
2025 EUR 287.000

Composition of residents

Age build-up

65+: 1.305 0-15: 775 15-25: 570 25-45: 1.160 45-65: 1.365

Education level

Hoger

560

Praktisch

1.310

Middelbaar

1.810

Origin of residents (2025)

Europa

190

Nederland

4.705

Buiten Europa

230

Housing stock and construction periods

Types of homes

Hoekwoningen 253
Appartementen 397
Tussenwoningen 478
Vrijstaande woningen 1.072
Twee-onder-één-kap woningen 266

Construction period of buildings

Voor 1700 0
1700 tot 1900 63
1900 tot 1925 86
1925 tot 1950 277
1950 tot 1970 425
1970 tot 1980 412
1980 tot 1990 299
1990 tot 2000 185
2000 tot 2010 167
2010 tot 2020 151
2020 en later 63

Energy and sustainability

Energy label distribution

Label B

482

Label A

452

Label C

436

Label G

284

Label D

213

Label E

191

Label F

158

Label A+

53

Label A++

38

Label A+++

26

Label A++++

3

Label A+++++

0

Average energy consumption per year

Average energy consumption per year in De Westereen
Year Gas (m3) Electricity (kWh)
2020 1.370 2.540
2021 1.520 2.560
2022 1.190 2.370
2023 970 2.320
2024 960 2.420

Consumption per house type

Hoekwoning

Gas: 950 • Electricity: 1.870

Huurwoning

Gas: 870 • Electricity: 1.630

Koopwoning

Gas: 1.080 • Electricity: 3.000

Appartement

Gas: 710 • Electricity: 1.550

Tussenwoning

Gas: 900 • Electricity: 1.540

Vrijstaande woning

Gas: 1.130 • Electricity: 2.950

Twee-onder-één-kap woning

Gas: 880 • Electricity: 2.540

Business activity in De Westereen (2025)

Handel en HORECA 135
Nijverheid en energie 165
Zakelijke dienstverlening 75
Overheid, onderwijs en zorg 65
Landbouw, bosbouw en visserij 10
Vervoer, informatie en communicatie 20
Financiele diensten en onroerendgoed 20
Cultuur, recreatie en overige diensten 70

Total number of company establishments: 565

Recent crime statistics

Recent crime statistics in De Westereen
Period Crimes
jan 2026 6
jul 2025 9
jun 2025 10
mei 2025 10
mrt 2025 9
mrt 2026 10
nov 2024 4
nov 2025 6
okt 2024 8
okt 2025 10
sep 2024 12
sep 2025 10

These figures give an indicative picture of safety trends in the living environment of De Westereen.

Frequently asked questions about living in De Westereen

Short answers based on current local statistics, handy for a quick comparison of the living environment.

Hoeveel inwoners heeft De Westereen?

De Westereen telt in 2026 ongeveer 5.159 inwoners.

Wat is de gemiddelde WOZ-waarde in De Westereen?

De gemiddelde WOZ-waarde in De Westereen is in 2025 circa € 287.000.

Wat is het gemiddelde inkomen per inwoner in De Westereen?

Het gemiddelde inkomen per inwoner in De Westereen ligt rond € 26.600 per jaar.

Hoe veilig is wonen in De Westereen?

Voor het huidige jaar gaat het om ongeveer 114 geregistreerde misdrijven. Gebruik deze cijfers als indicatie en vergelijk trends per periode.

Welke woningtypen komen het meest voor in De Westereen?

In De Westereen komt vooral "Vrijstaande woningen" veel voor, met ongeveer 1.072 woningen.

Receive free, non-binding quotes

Compare multiple real estate agents and choose the best match.