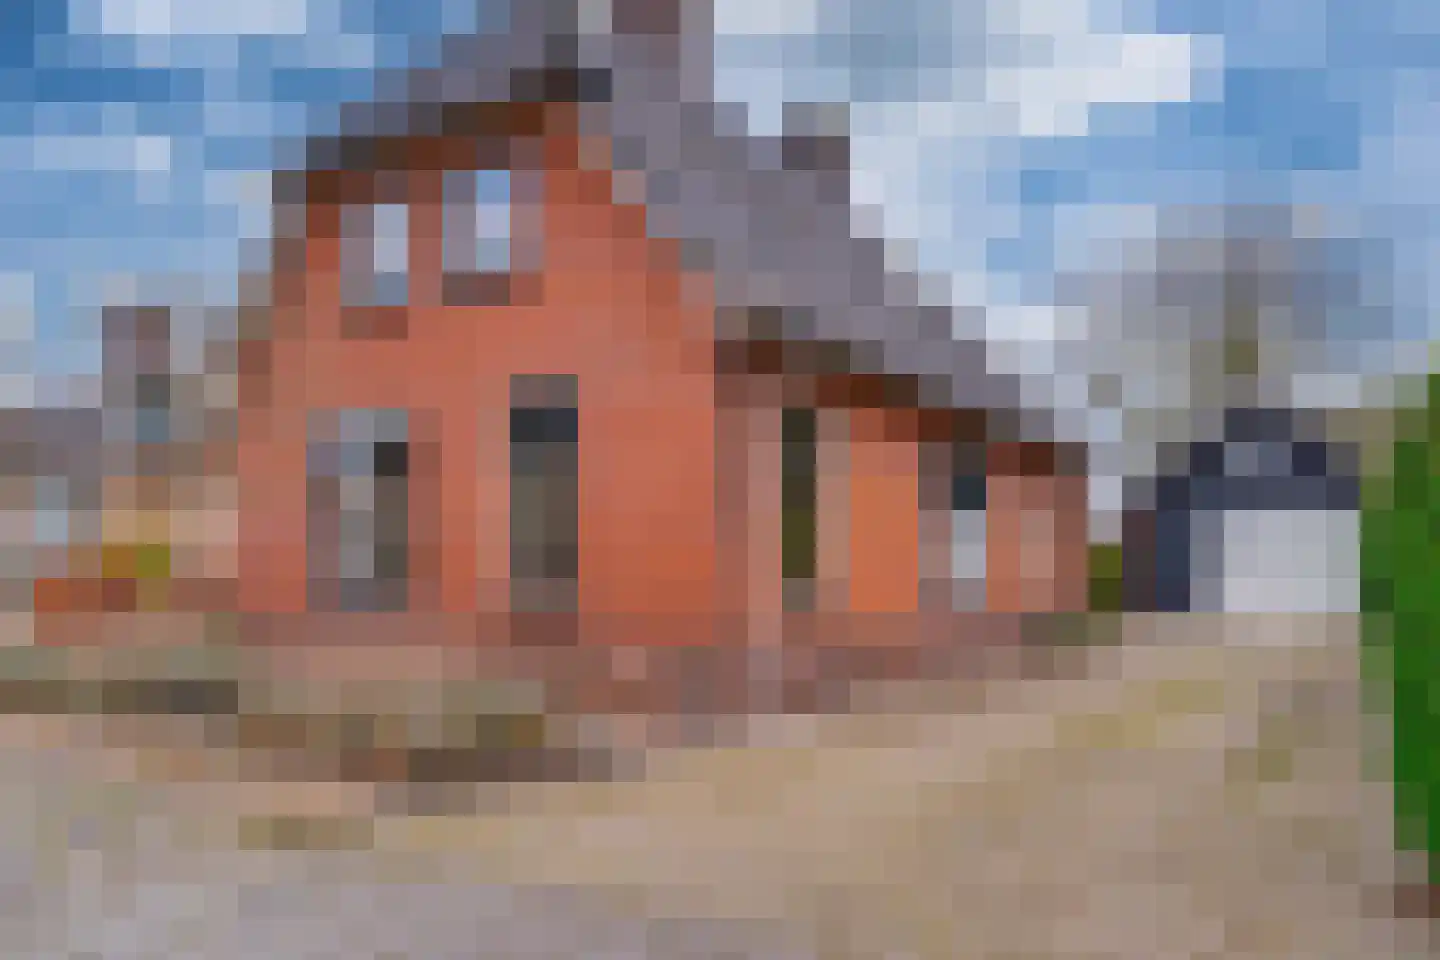
- Sold
Teijssenstraat 16
6653AP Deest
€ 375.000 k.k.
€ 3.866/m²
- Living area
- 97 m²
- Land area
- 354 m²
- Bedrooms
- 3
View 24 sold houses in Deest
Type to search. Use arrow down and arrow up to navigate through results and press Enter to open.
Hidden search suggestions.
Compare sold homes in Deest or view the current offering in this location directly.
On this page you will find recently sold homes in Deest. Use this overview to better estimate selling prices, popular neighborhoods, and the local housing supply before you choose a real estate agent. Also view the current housing supply with 31 houses in Deest.
6653AP Deest
€ 375.000 k.k.
€ 3.866/m²
6653AM Deest
€ 495.000 k.k.
€ 4.500/m²
6653AH Deest
€ 400.000 k.k.
€ 4.000/m²
6653DB Deest
€ 425.000 k.k.
€ 3.512/m²
6653BR Deest
€ 450.000 k.k.
€ 2.941/m²
6653AJ Deest
€ 895.000 k.k.
€ 4.068/m²
6653DC Deest
€ 415.000 k.k.
€ 3.320/m²
6653BD Deest
€ 325.000 k.k.
€ 3.735/m²
6653BA Deest
€ 375.000 k.k.
€ 4.076/m²
6653DA Deest
€ 475.000 k.k.
€ 3.925/m²
6653CC Deest
€ 1.895.000 k.k.
€ 3.256/m²
6653AB Deest
€ 339.000 k.k.
€ 2.529/m²
6653CD Deest
€ 345.000 k.k.
€ 3.965/m²
6653BS Deest
€ 350.000 k.k.
€ 3.125/m²
6653BD Deest
Price upon request
6653AL Deest
€ 450.000 k.k.
€ 3.169/m²
6653DA Deest
€ 395.000 k.k.
€ 0/m²
6653BR Deest
€ 425.000 k.k.
€ 0/m²
6653BR Deest
€ 325.000 k.k.
€ 2.708/m²
6653DD Deest
€ 485.000 k.k.
€ 3.592/m²
6653BE Deest
€ 305.000 k.k.
€ 4.295/m²
6653AJ Deest
€ 395.000 k.k.
€ 1.926/m²
6653DD Deest
€ 375.000 k.k.
€ 3.472/m²
6653BD Deest
€ 355.000 k.k.
€ 4.127/m²
View recent sales and receive free quotes from local real estate agents. Compare more than 38 real estate agents in Deest.
Selling your own home in Deest? Compare real estate agents in Deest or view the best real estate agents in Deest as a reference for your choice.
Real estate agents make sharper offers when they know you're comparing — ask for quotes for sale or purchase.
Short answers about housing prices, sold homes and comparing real estate agents in Deest.
The costs of a real estate agent in Deest vary per office, property type and sales approach. In Deest you can compare 38 real estate agents; therefore also look at the real estate agents in Deest to better compare fees, presentation and local experience.
On this page we currently show 24 sold houses in Deest from our selection. This helps you to better assess recent transactions and the local housing market.
Houses sold in Deest give insight into asking prices, house types and neighborhoods where recent transactions have taken place. Compare this also with the current housing stock in Deest to better understand the market.
You can use sold homes as a first market indication, but a local real estate agent can better take into account finishing, location, maintenance and current demand in Deest.
Compare the 38 real estate agents in Deest on local sales experience, reviews, expected yield, commission and marketing approach. View real estate agents in Deest or the top 10 agents in Deest to quickly discover strong offices.
View current location data on residents, WOZ development, housing stock, energy consumption, business activity and safety in Deest. In 2026 were there 1.911 residents. The average WOZ value in 2025 is EUR 363.000.
These figures help to better assess and compare the housing stock in Deest with recent sold homes. Orient yourself then on suitable top real estate agents in Deest for sales advice in this region.
Residents
1.911
Last year: 2026
Average WOZ
EUR 363.000
Last year: 2025
Average income per person.
EUR 29.400
Source: AllNumbers
Crimes (current year)
47
Total registered
| Year | Residents |
|---|---|
| 2021 | 1.795 |
| 2022 | 1.805 |
| 2023 | 1.885 |
| 2024 | 1.900 |
| 2025 | 1.915 |
| 2026 | 1.911 |
| Year | Average WOZ |
|---|---|
| 2021 | EUR 247.000 |
| 2022 | EUR 283.000 |
| 2023 | EUR 317.000 |
| 2024 | EUR 340.000 |
| 2025 | EUR 363.000 |
Hoger
320
Praktisch
490
Middelbaar
650
Europa
110
Nederland
1.690
Buiten Europa
120
Label A
271
Label C
156
Label D
97
Label B
82
Label G
79
Label F
58
Label E
52
Label A+
42
Label A++
3
Label A+++
2
Label A++++
2
Label A+++++
0
| Year | Gas (m3) | Electricity (kWh) |
|---|---|---|
| 2020 | 1.330 | 3.080 |
| 2021 | 1.480 | 3.120 |
| 2022 | 1.140 | 2.900 |
| 2023 | 920 | 2.840 |
| 2024 | 910 | 2.930 |
Hoekwoning
Gas: 810 • Electricity: 2.510
Huurwoning
Gas: 770 • Electricity: 2.140
Koopwoning
Gas: 1.020 • Electricity: 3.280
Appartement
Gas: 870 • Electricity: 2.250
Tussenwoning
Gas: 720 • Electricity: 2.430
Vrijstaande woning
Gas: 1.230 • Electricity: 3.830
Twee-onder-één-kap woning
Gas: 990 • Electricity: 2.850
Total number of company establishments: 240
| Period | Crimes |
|---|---|
| jan 2026 | 3 |
| jul 2025 | 4 |
| jun 2025 | 3 |
| mei 2025 | 2 |
| mrt 2025 | 1 |
| mrt 2026 | 2 |
| nov 2024 | 3 |
| nov 2025 | 4 |
| okt 2024 | 5 |
| okt 2025 | 5 |
| sep 2024 | 1 |
| sep 2025 | 3 |
These figures give an indicative picture of safety trends in the living environment of Deest.
Short answers based on current local statistics, handy for a quick comparison of the living environment.
Deest telt in 2026 ongeveer 1.911 inwoners.
De gemiddelde WOZ-waarde in Deest is in 2025 circa € 363.000.
Het gemiddelde inkomen per inwoner in Deest ligt rond € 29.400 per jaar.
Voor het huidige jaar gaat het om ongeveer 47 geregistreerde misdrijven. Gebruik deze cijfers als indicatie en vergelijk trends per periode.
In Deest komt vooral "Tussenwoningen" veel voor, met ongeveer 229 woningen.