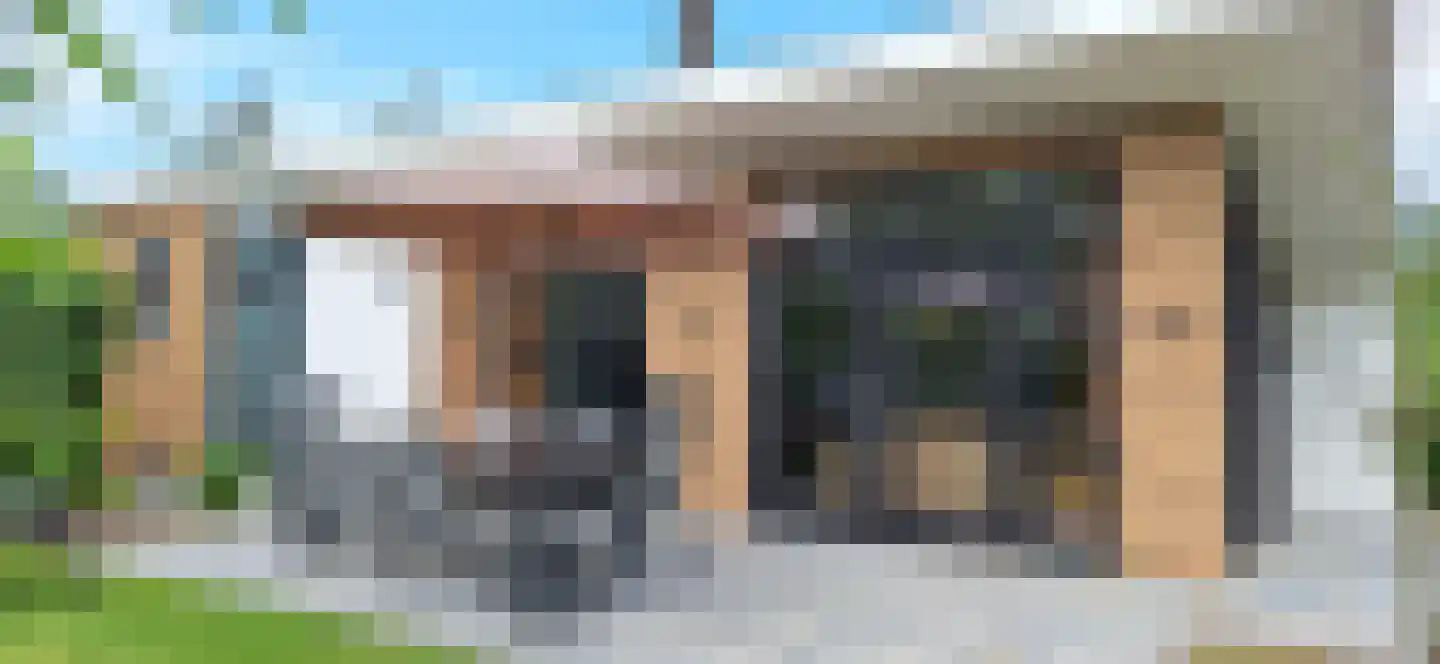
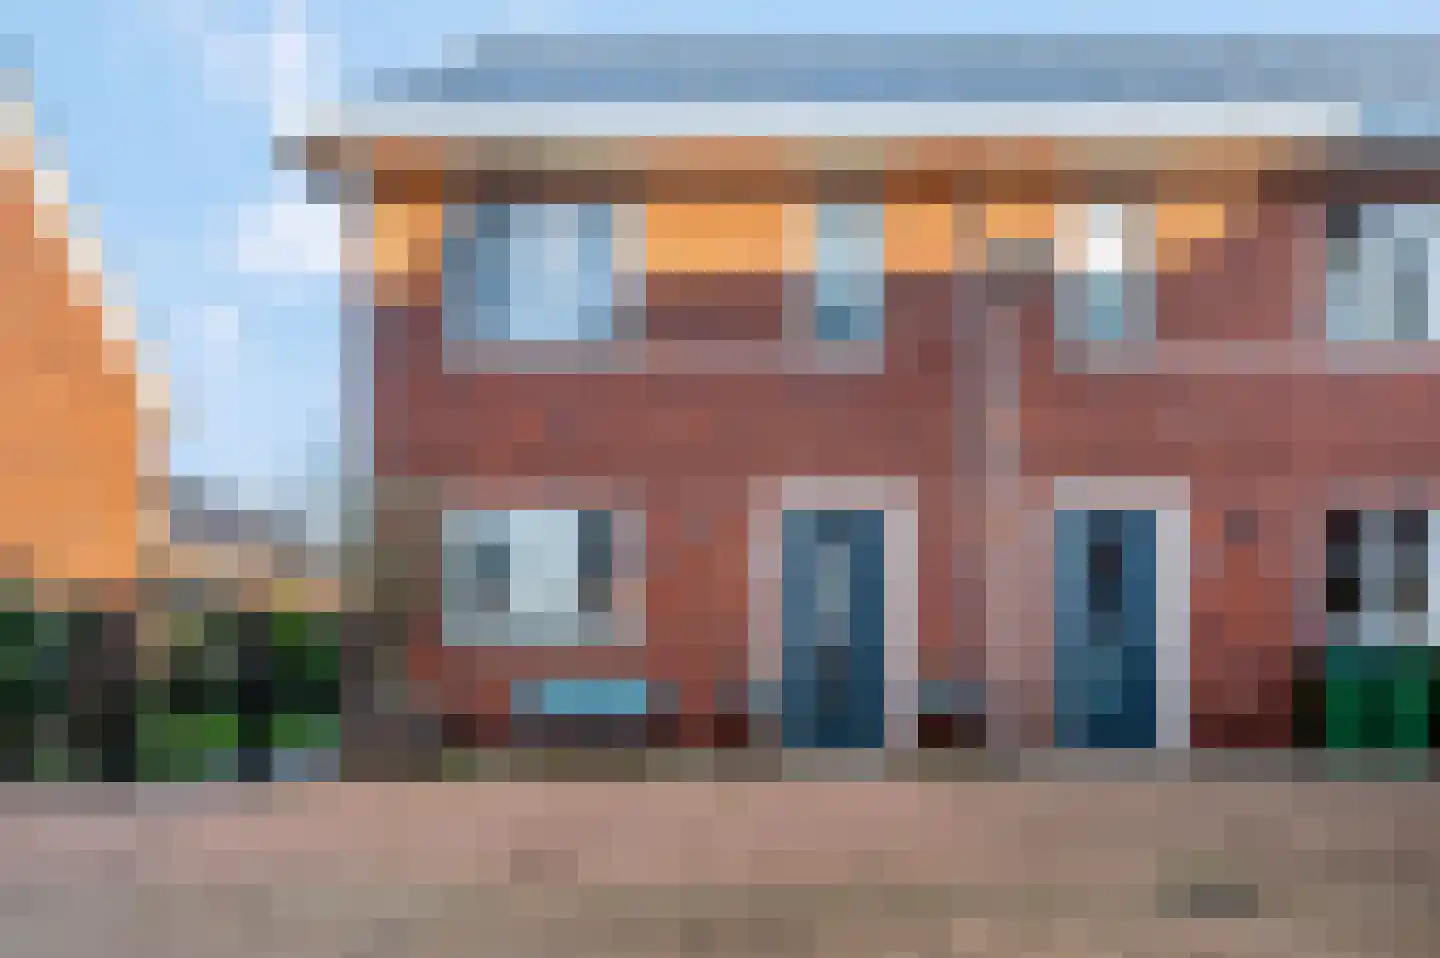
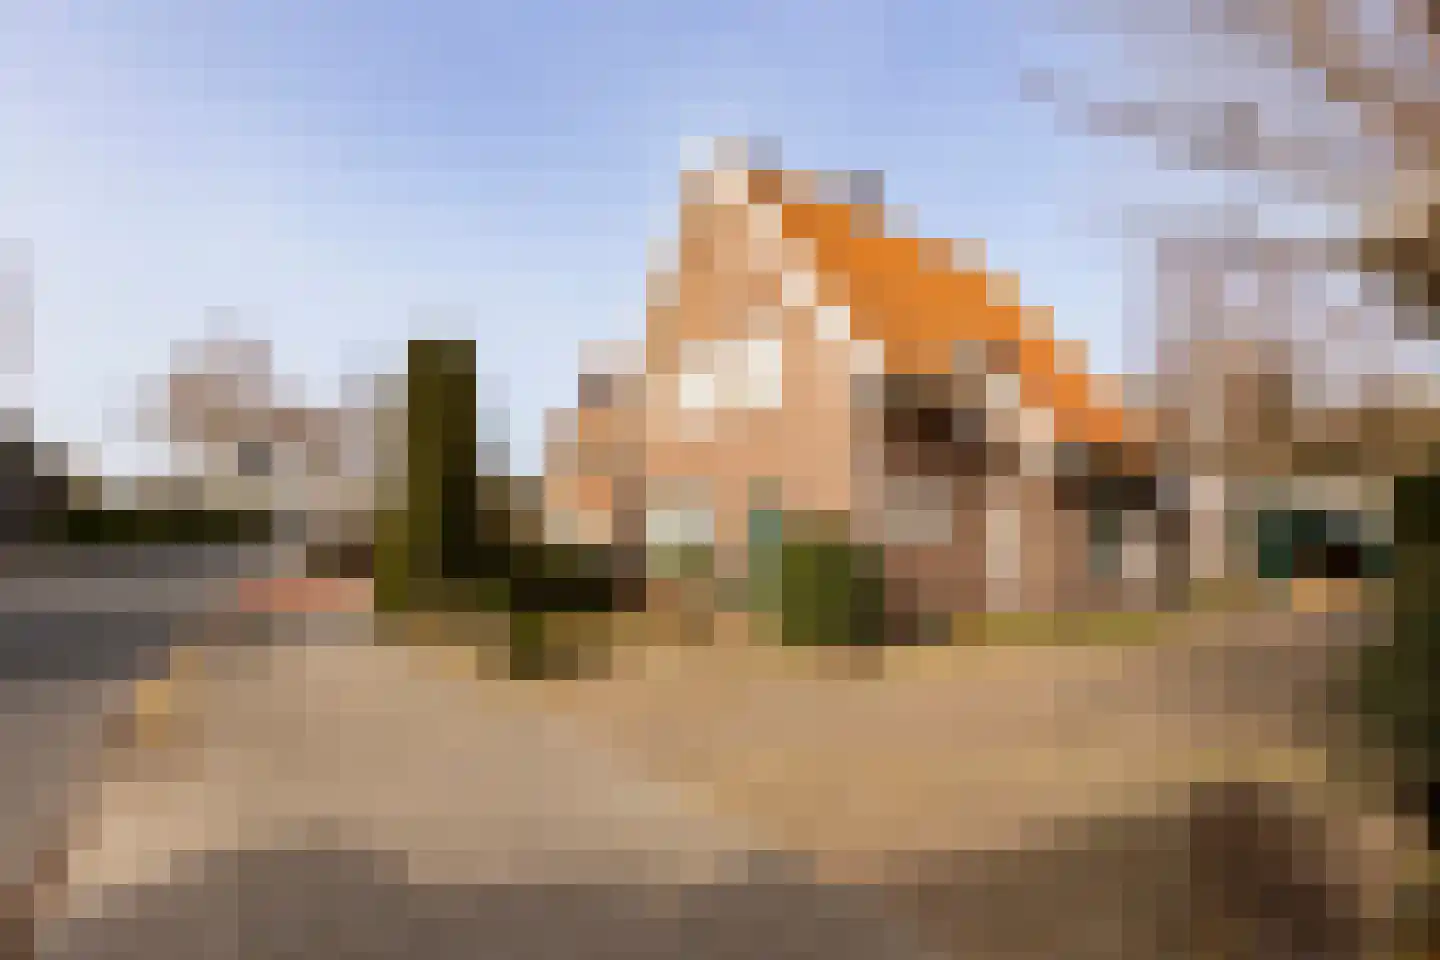
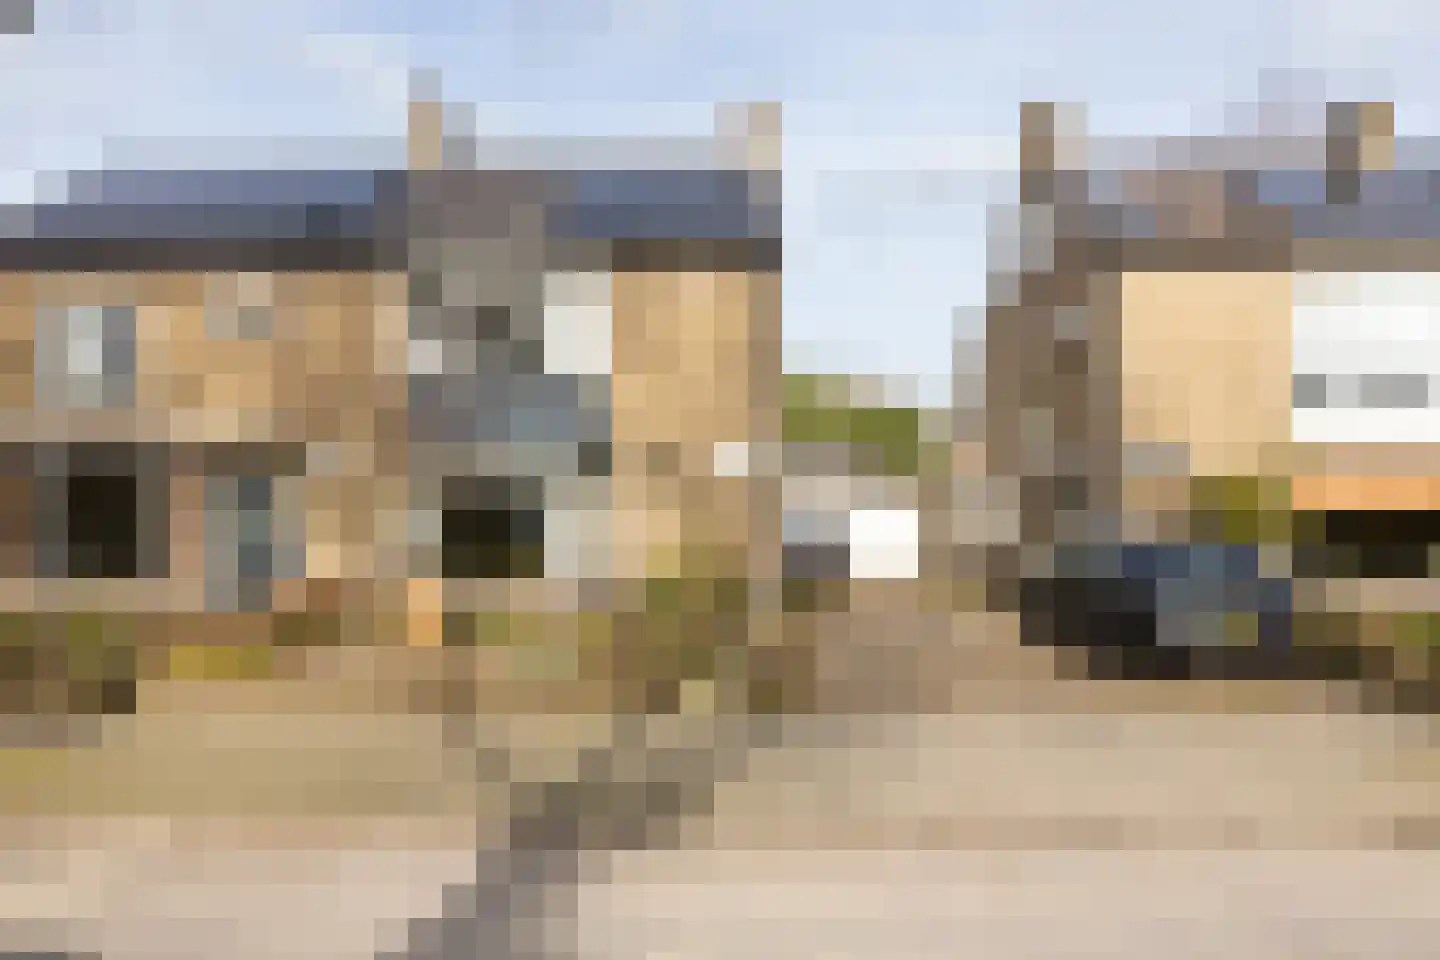
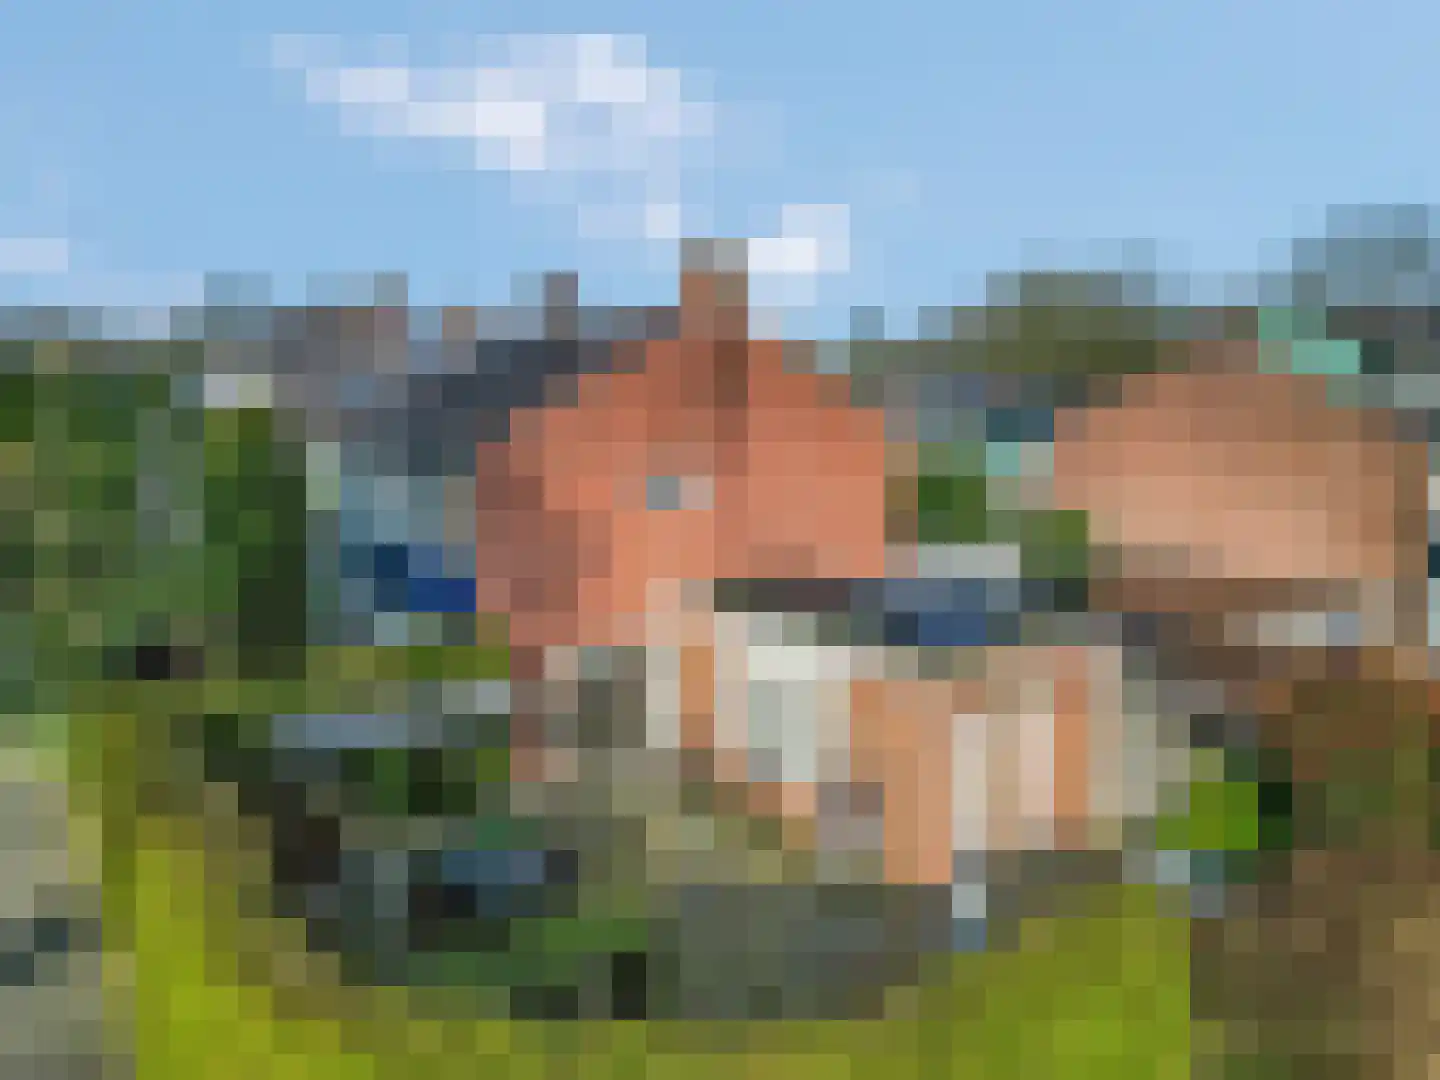
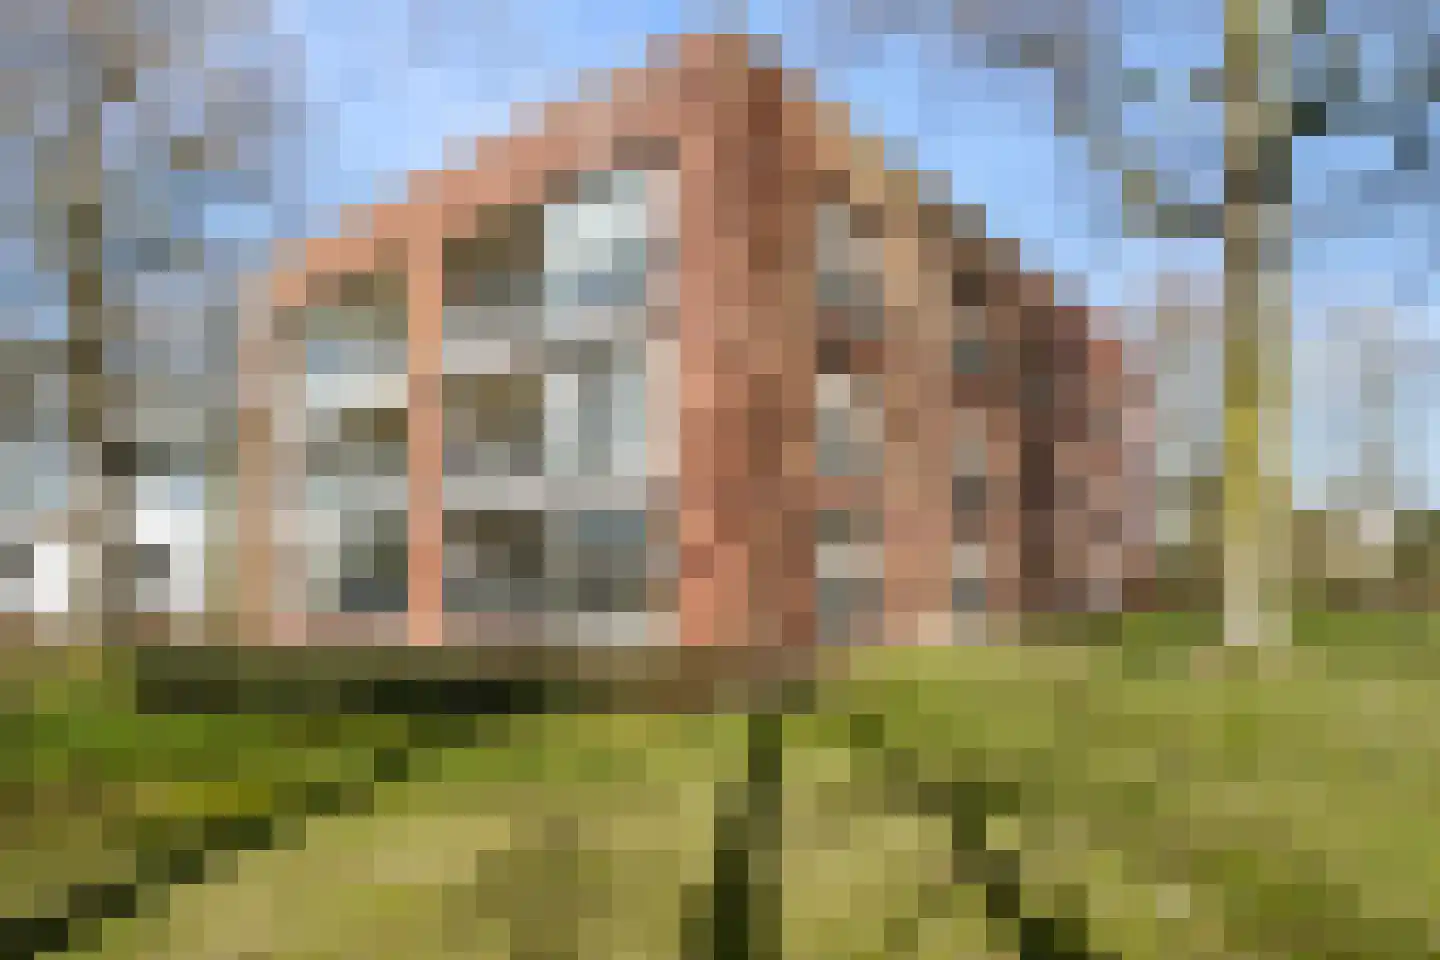
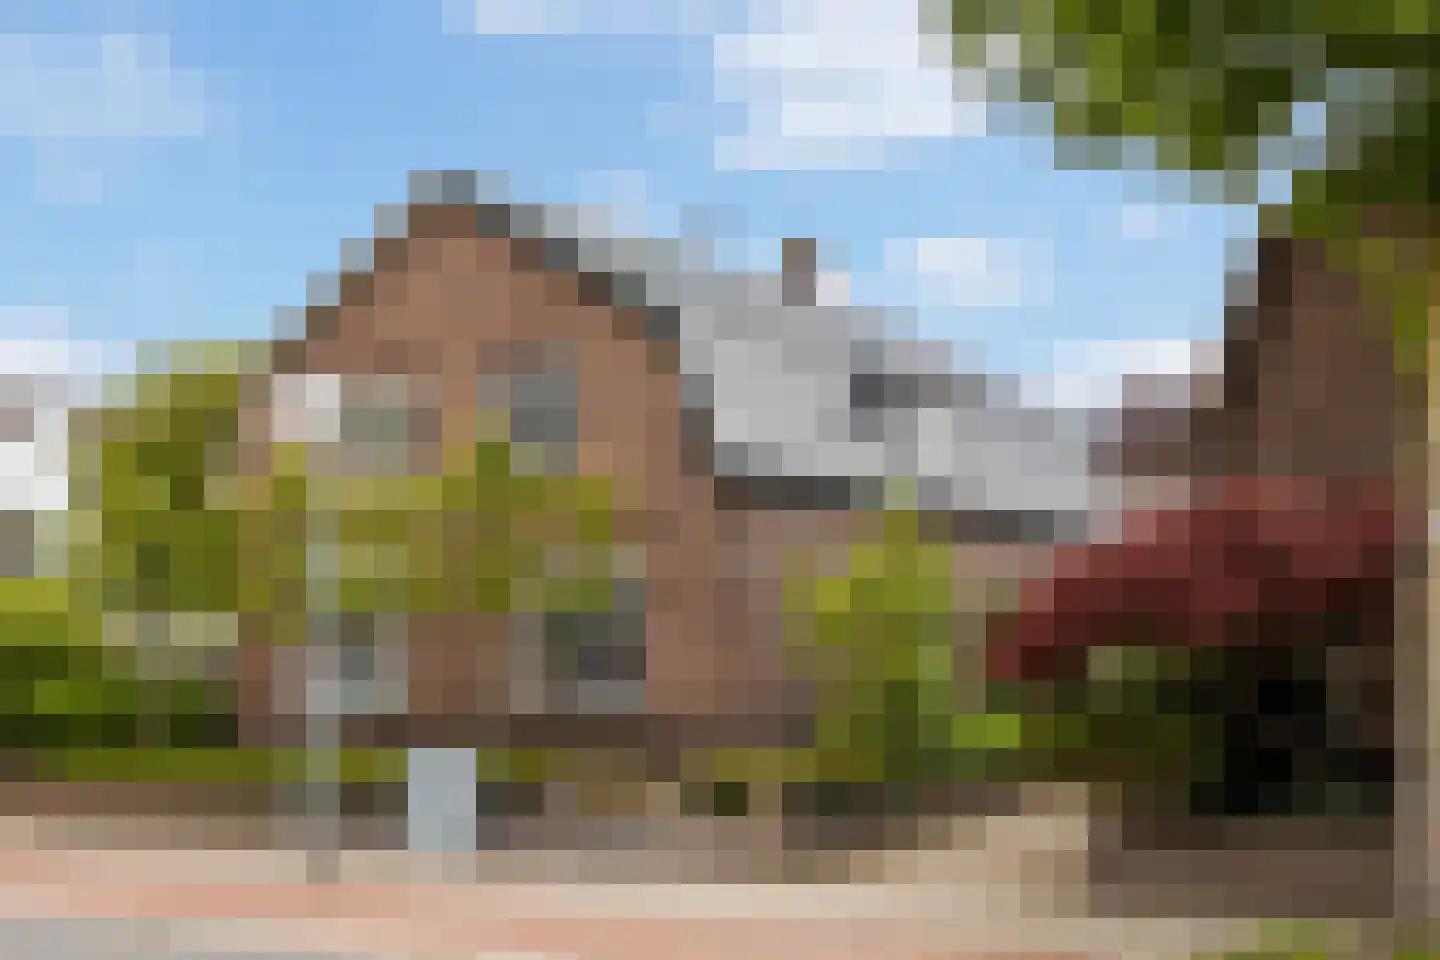
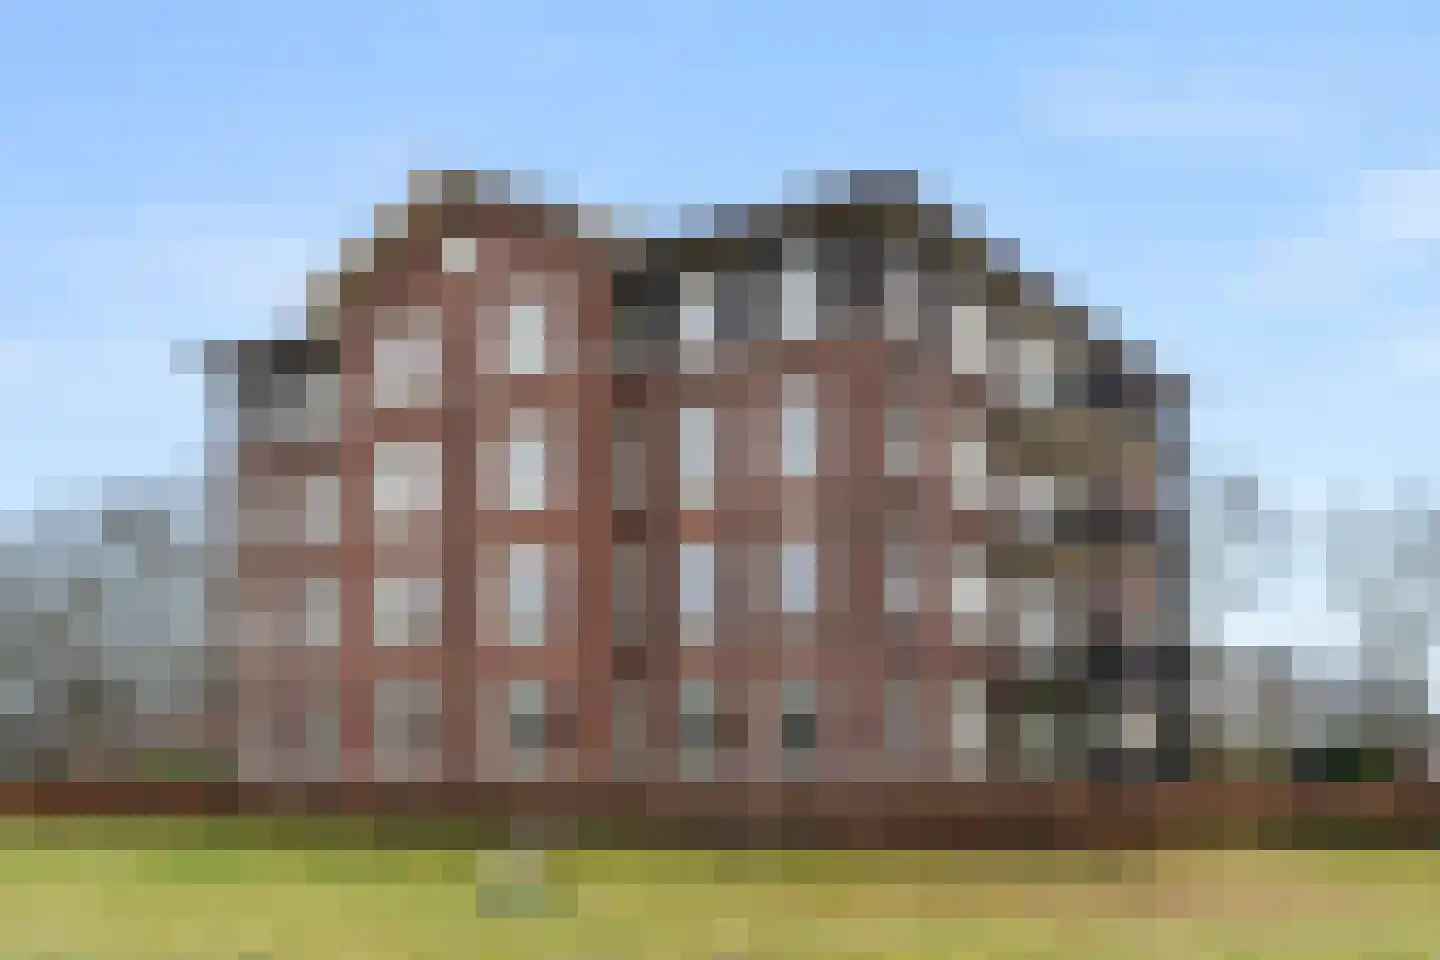
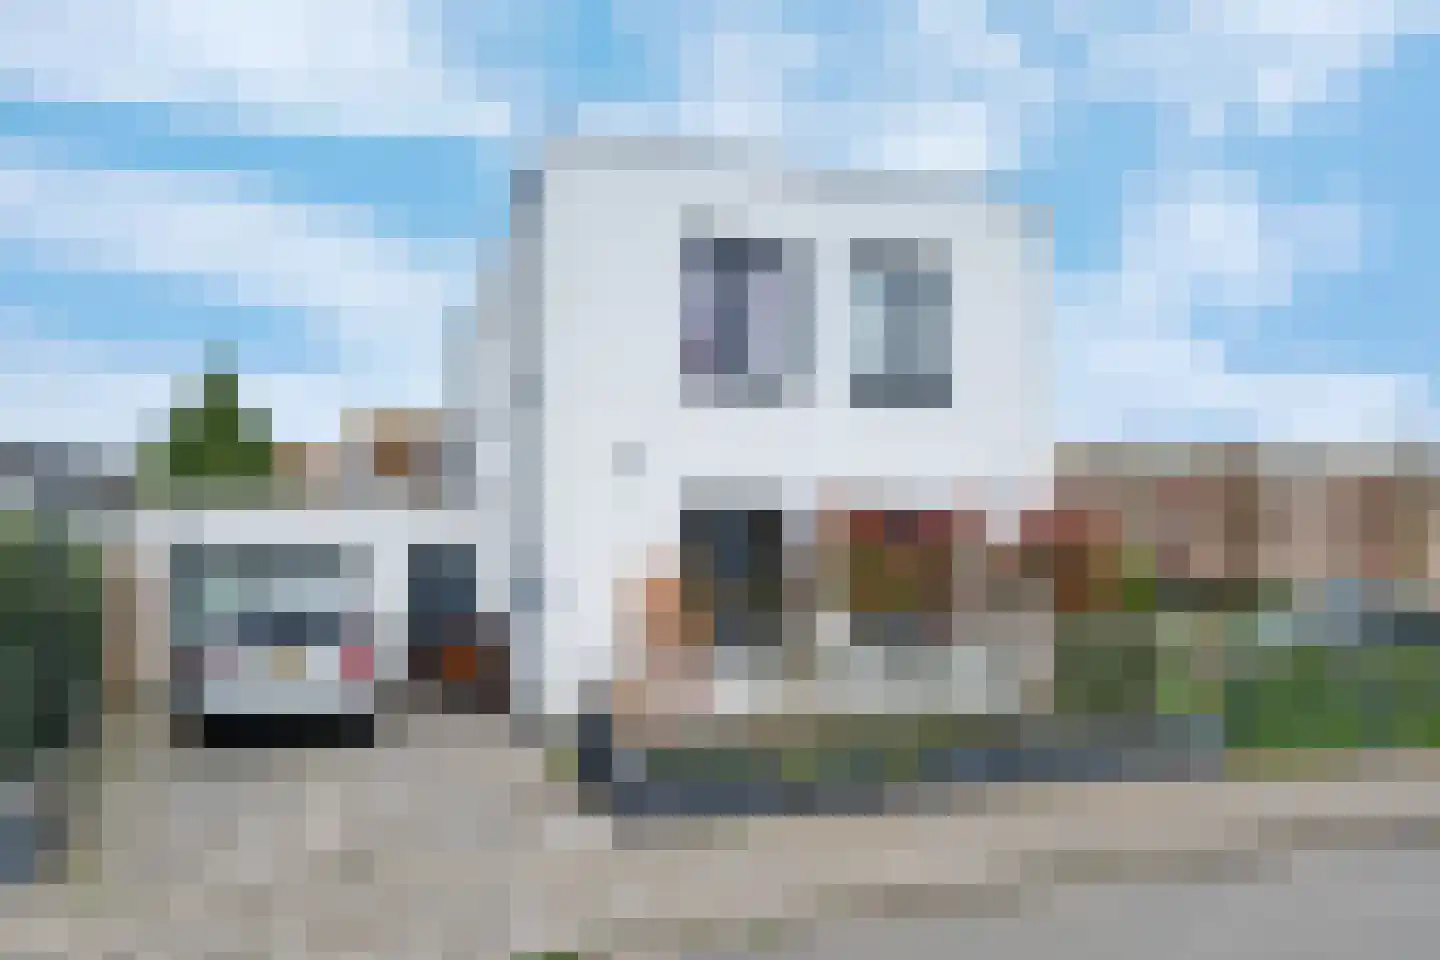
- Available
Hoorn 22 B
6713KR Ede
€ 750.000 k.k.
€ 5.172/m²
- Living area
- 145 m²
- Land area
- —
- Bedrooms
- 3
Searching in 1.217 houses in Ede
Type to search. Use arrow down and arrow up to navigate through results and press Enter to open.
Hidden search suggestions.
View current properties in Ede or search targeted on street, postal code and property characteristics.
View the current housing stock in Ede and quickly filter by price, living area, rooms and more. There are currently 1.217 houses in this place within our selection. View also 897 sold houses in Ede for extra insight into the local housing market.
6713KR Ede
€ 750.000 k.k.
€ 5.172/m²
6718GD Ede
€ 600.000 k.k.
€ 4.027/m²
6711AL Ede
€ 245.000 k.k.
€ 5.444/m²
6718TH Ede
€ 49.500
€ 1.100/m²
6716RE Ede
€ 375.000 k.k.
€ 4.573/m²
6717ZS Ede
€ 1.275.000 k.k.
€ 5.060/m²
6718TL Ede
€ 139.500
€ 2.536/m²
6714KK Ede
€ 575.000 k.k.
€ 3.938/m²
6711PC Ede
€ 695.000 k.k.
€ 4.793/m²
6712DX Ede
€ 669.000 k.k.
€ 5.529/m²
6711EN Ede
€ 675.000 k.k.
€ 4.272/m²
6711DK Ede
€ 895.000 k.k.
€ 5.665/m²
6714HM Ede
€ 360.000 k.k.
€ 3.830/m²
6712DL Ede
€ 745.000 k.k.
€ 3.531/m²
6715DP Ede
€ 565.000 k.k.
€ 4.593/m²
6712CX Ede
€ 619.000 k.k.
€ 6.448/m²
6712KB Ede
€ 750.000 k.k.
€ 4.902/m²
6718TL Ede
€ 119.500
€ 2.489/m²
6713SB Ede
€ 489.500 k.k.
€ 3.708/m²
6712CZ Ede
€ 659.000 k.k.
€ 5.272/m²
6711AZ Ede
€ 433.000 k.k.
€ 4.811/m²
6718PJ Ede
€ 970.000
€ 6.510/m²
6717GH Ede
€ 435.000 k.k.
€ 5.118/m²
6713AT Ede
€ 675.000 k.k.
€ 4.245/m²
6714GG Ede
€ 595.000 k.k.
€ 3.584/m²
6718TL Ede
€ 209.500 k.k.
€ 3.809/m²
6713LG Ede
€ 945.000 k.k.
€ 3.193/m²
6711CG Ede
€ 375.000 k.k.
€ 3.866/m²
Get free quotes from real estate agents with local market knowledge. Compare more than 65 real estate agents in Ede.
Selling a home in Ede? View the sales-oriented guide sell a house in Ede, compare all real estate agents in Ede or view the top 10 real estate agents in Ede for extra context to your choice.
Real estate agents make sharper offers when they know you're comparing — ask for quotes for sale or purchase.
Practical answers about housing supply, sales and comparing real estate agents in Ede.
The costs of a real estate agent in Ede depend on commission, setup costs, property presentation and the chosen service. Compare the 65 real estate agents in Ede via the real estate agent page and request multiple quotes to compare rates and approach well.
Within our selection, we are currently showing 1.217 houses in Ede. View also the sold houses in Ede to compare the current offering with recent transactions.
Take into account not only price and living area but also maintenance, energy label, location, outdoor space and sales status. This way you compare houses in Ede on more than just the asking price.
A local real estate agent knows the neighborhoods, recent transactions and demand in Ede. By comparing 65 real estate agents in the region you get a better insight into prices, sales strategy and expected yield; the top 10 in Ede provides a useful starting point.
Yes, when making a sales plan, a valuation in Ede is wise. You gain insight into a realistic asking price and can then compare offers from real estate agents specifically.
View current location data on residents, WOZ development, housing stock, energy consumption, business activity and safety in Ede. In 2026 were there 82.545 residents. The average WOZ value in 2025 is EUR 387.539.
These figures help to better assess and compare the housing stock in Ede with recent sold homes. Orient yourself then on suitable top real estate agents in Ede for sales advice in this region.
Residents
82.545
Last year: 2026
Average WOZ
EUR 387.539
Last year: 2025
Average income per person.
EUR 31.853
Source: AllNumbers
Crimes (current year)
3.392
Total registered
| Year | Residents |
|---|---|
| 2021 | 76.765 |
| 2022 | 78.010 |
| 2023 | 79.435 |
| 2024 | 81.035 |
| 2025 | 81.700 |
| 2026 | 82.545 |
| Year | Average WOZ |
|---|---|
| 2021 | EUR 268.097 |
| 2022 | EUR 291.576 |
| 2023 | EUR 340.390 |
| 2024 | EUR 365.994 |
| 2025 | EUR 387.539 |
Hoger
20.890
Praktisch
14.860
Middelbaar
24.850
Europa
4.825
Nederland
62.230
Buiten Europa
14.655
Label A
11.729
Label C
9.795
Label B
5.699
Label D
2.163
Label E
1.674
Label G
1.596
Label A++
1.456
Label A+
1.424
Label F
1.243
Label A+++
848
Label A++++
98
Label A+++++
30
| Year | Gas (m3) | Electricity (kWh) |
|---|---|---|
| 2020 | 942 | 2.754 |
| 2021 | 1.035 | 2.781 |
| 2022 | 803 | 2.610 |
| 2023 | 666 | 2.448 |
| 2024 | 640 | 2.507 |
Hoekwoning
Gas: 783 • Electricity: 2.674
Huurwoning
Gas: 497 • Electricity: 1.951
Koopwoning
Gas: 788 • Electricity: 2.770
Appartement
Gas: 415 • Electricity: 1.771
Tussenwoning
Gas: 675 • Electricity: 2.428
Vrijstaande woning
Gas: 1.228 • Electricity: 3.699
Twee-onder-één-kap woning
Gas: 981 • Electricity: 3.055
Total number of company establishments: 10.210
| Period | Crimes |
|---|---|
| jan 2026 | 289 |
| jul 2025 | 293 |
| jun 2025 | 255 |
| mei 2025 | 252 |
| mrt 2025 | 290 |
| mrt 2026 | 391 |
| nov 2024 | 273 |
| nov 2025 | 313 |
| okt 2024 | 334 |
| okt 2025 | 298 |
| sep 2024 | 204 |
| sep 2025 | 269 |
These figures give an indicative picture of safety trends in the living environment of Ede.
Short answers based on current local statistics, handy for a quick comparison of the living environment.
Ede telt in 2026 ongeveer 82.545 inwoners.
De gemiddelde WOZ-waarde in Ede is in 2025 circa € 387.539.
Het gemiddelde inkomen per inwoner in Ede ligt rond € 31.853 per jaar.
Voor het huidige jaar gaat het om ongeveer 3.392 geregistreerde misdrijven. Gebruik deze cijfers als indicatie en vergelijk trends per periode.
In Ede komt vooral "Appartementen" veel voor, met ongeveer 14.755 woningen.