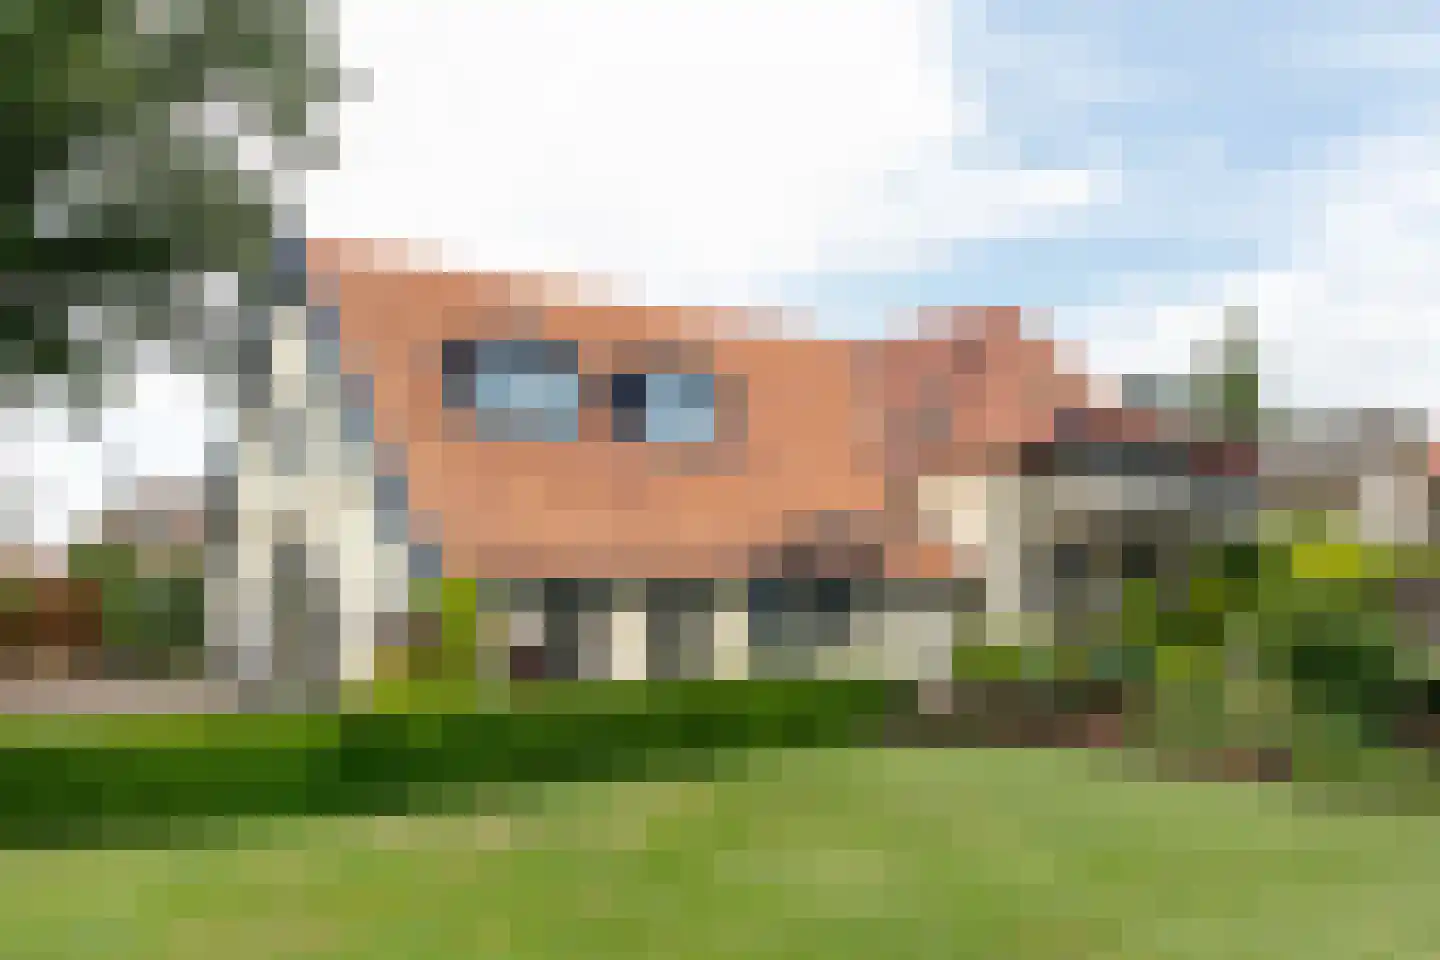
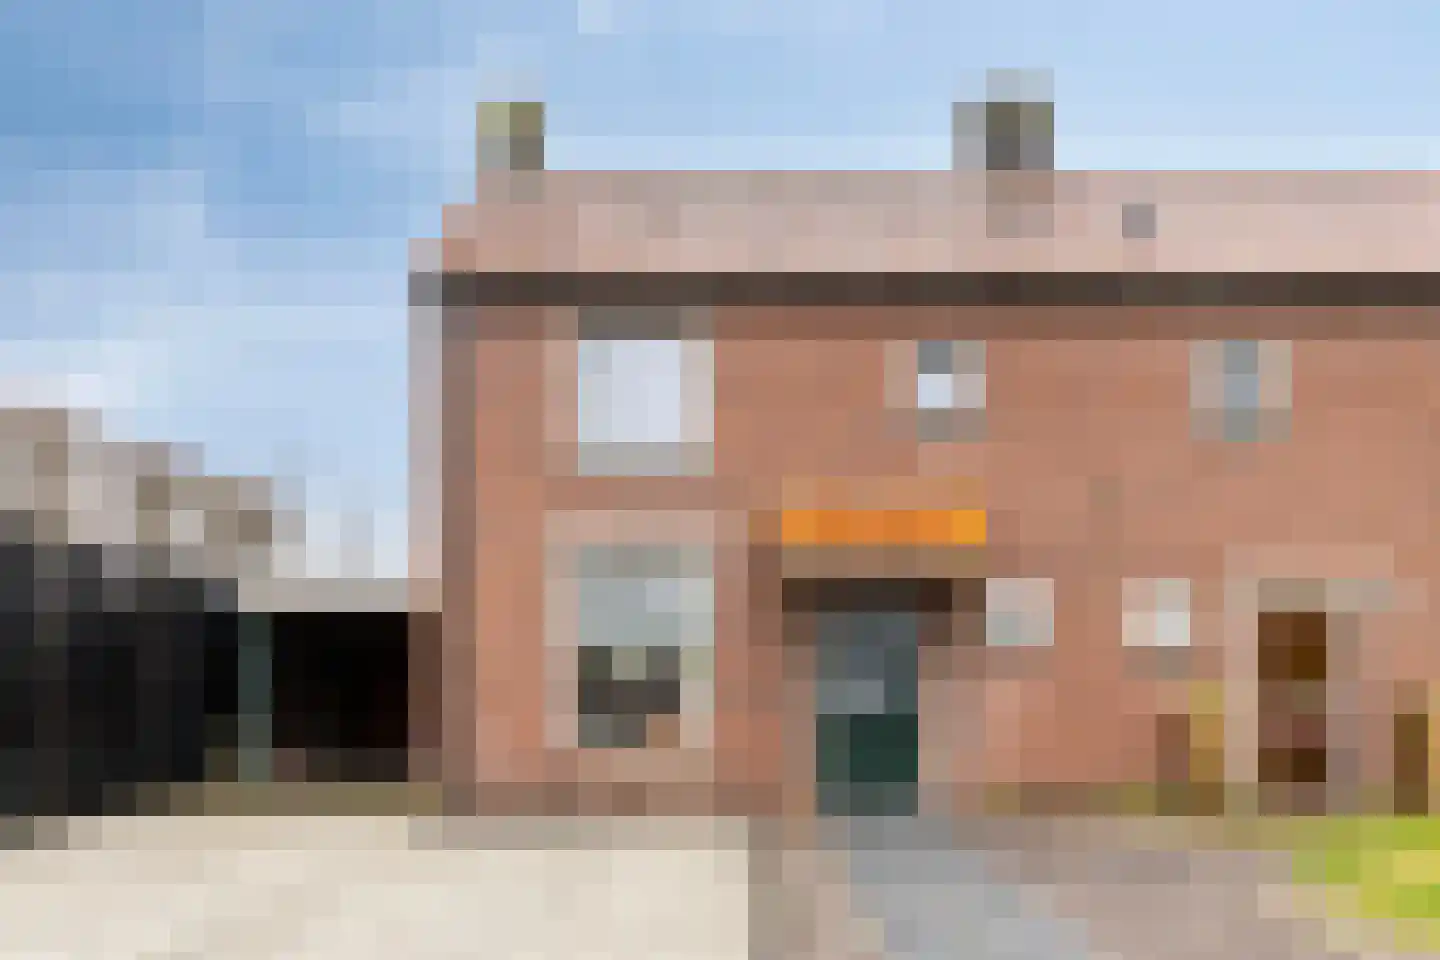
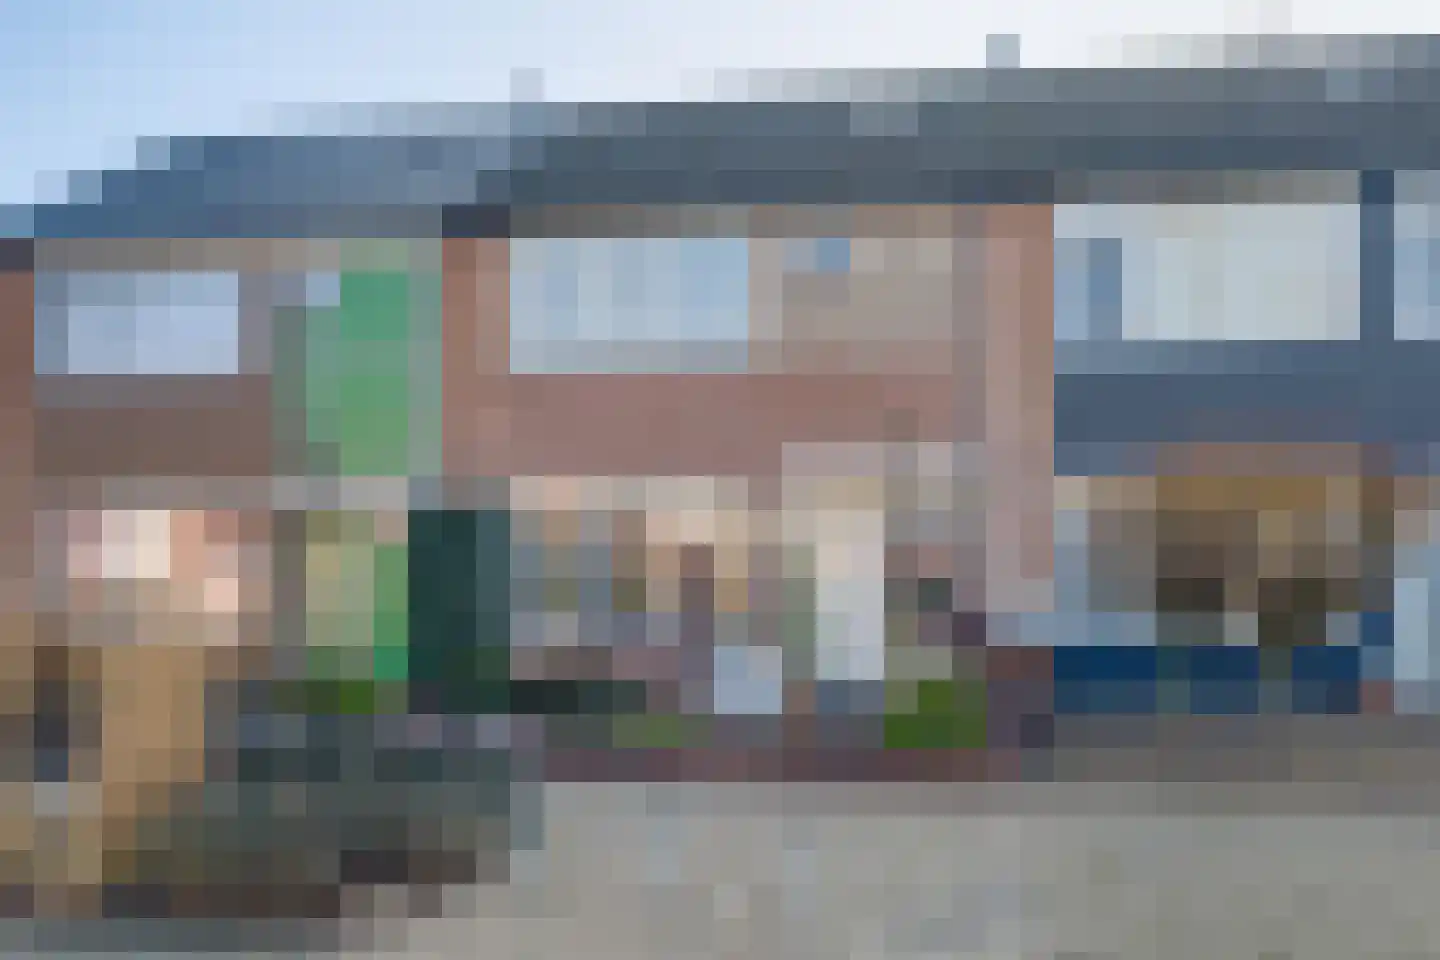
Houses sold in Eibergen

View 81 sold houses in Eibergen

Connected to: Vastgoed Nederland NVM Makelaars

On this page you will find recently sold homes in Eibergen. Use this overview to better estimate selling prices, popular neighborhoods, and the local housing supply before you choose a real estate agent. Also view the current housing supply with 117 houses in Eibergen.

Selection

Search and filter homes

Set your preferences and discover homes that suit you.

Total supply 241.794
Filters

Set price, area and other characteristics. Adjust a filter or click on Show homes. Location changes directly above.

Reset filters

You search for

  • Place Eibergen
  • Status Sold

Sell your house in Eibergen? Compare real estate agents

View recent sales and receive free quotes from local real estate agents. Compare more than 16 real estate agents in Eibergen.

Free request a quote

  • Quotes in Eibergen
  • Non-binding
  • Personal
  • Compare free rates

Selling your own home in Eibergen? Compare real estate agents in Eibergen or view the best real estate agents in Eibergen as a reference for your choice.

Compare multiple quotes

Real estate agents make sharper offers when they know you're comparing — ask for quotes for sale or purchase.

Frequently asked questions about sold homes in Eibergen

Short answers about housing prices, sold homes and comparing real estate agents in Eibergen.

Residential and neighborhood statistics in Eibergen

View current location data on residents, WOZ development, housing stock, energy consumption, business activity and safety in Eibergen. In 2026 were there 11.148 residents. The average WOZ value in 2025 is EUR 359.004.

These figures help to better assess and compare the housing stock in Eibergen with recent sold homes. Orient yourself then on suitable top real estate agents in Eibergen for sales advice in this region.

Residents

11.148

Last year: 2026

Average WOZ

EUR 359.004

Last year: 2025

Average income per person.

EUR 28.955

Source: AllNumbers

Crimes (current year)

251

Total registered

Demographics and WOZ development

Inhabitants per year

Inhabitants per year in Eibergen
Year Residents
2021 11.180
2022 11.200
2023 11.225
2024 11.115
2025 11.165
2026 11.148

Annual WOZ value

WOZ value per year in Eibergen
Year Average WOZ
2021 EUR 247.098
2022 EUR 269.562
2023 EUR 321.019
2024 EUR 338.256
2025 EUR 359.004

Composition of residents

Age build-up

65+: 2.970 0-15: 1.585 15-25: 1.145 25-45: 2.305 45-65: 3.135

Education level

Hoger

1.320

Praktisch

1.940

Middelbaar

3.410

Origin of residents (2025)

Europa

600

Nederland

9.885

Buiten Europa

690

Housing stock and construction periods

Types of homes

Hoekwoningen 943
Appartementen 1.061
Tussenwoningen 1.291
Vrijstaande woningen 1.114
Twee-onder-één-kap woningen 860

Construction period of buildings

Voor 1700 3
1700 tot 1900 58
1900 tot 1925 233
1925 tot 1950 550
1950 tot 1970 1.465
1970 tot 1980 927
1980 tot 1990 655
1990 tot 2000 488
2000 tot 2010 176
2010 tot 2020 266
2020 en later 165

Energy and sustainability

Energy label distribution

Label C

1.547

Label A

1.006

Label B

971

Label G

503

Label D

431

Label F

244

Label E

167

Label A+

136

Label A++

69

Label A+++

40

Label A++++

30

Label A+++++

0

Average energy consumption per year

Average energy consumption per year in Eibergen
Year Gas (m3) Electricity (kWh)
2020 1.282 2.880
2021 1.457 2.943
2022 1.152 2.791
2023 943 2.661
2024 917 2.777

Consumption per house type

Hoekwoning

Gas: 765 • Electricity: 2.067

Huurwoning

Gas: 752 • Electricity: 1.853

Koopwoning

Gas: 1.026 • Electricity: 2.991

Appartement

Gas: 591 • Electricity: 1.524

Tussenwoning

Gas: 684 • Electricity: 2.018

Vrijstaande woning

Gas: 1.275 • Electricity: 3.586

Twee-onder-één-kap woning

Gas: 970 • Electricity: 2.847

Business activity in Eibergen (2025)

Handel en HORECA 235
Nijverheid en energie 155
Zakelijke dienstverlening 245
Overheid, onderwijs en zorg 215
Landbouw, bosbouw en visserij 140
Vervoer, informatie en communicatie 50
Financiele diensten en onroerendgoed 90
Cultuur, recreatie en overige diensten 130

Total number of company establishments: 1.255

Recent crime statistics

Recent crime statistics in Eibergen
Period Crimes
jan 2026 24
jul 2025 26
jun 2025 19
mei 2025 19
mrt 2025 23
mrt 2026 14
nov 2024 29
nov 2025 27
okt 2024 32
okt 2025 20
sep 2024 26
sep 2025 12

These figures give an indicative picture of safety trends in the living environment of Eibergen.

Frequently asked questions about living in Eibergen

Short answers based on current local statistics, handy for a quick comparison of the living environment.

Hoeveel inwoners heeft Eibergen?

Eibergen telt in 2026 ongeveer 11.148 inwoners.

Wat is de gemiddelde WOZ-waarde in Eibergen?

De gemiddelde WOZ-waarde in Eibergen is in 2025 circa € 359.004.

Wat is het gemiddelde inkomen per inwoner in Eibergen?

Het gemiddelde inkomen per inwoner in Eibergen ligt rond € 28.955 per jaar.

Hoe veilig is wonen in Eibergen?

Voor het huidige jaar gaat het om ongeveer 251 geregistreerde misdrijven. Gebruik deze cijfers als indicatie en vergelijk trends per periode.

Welke woningtypen komen het meest voor in Eibergen?

In Eibergen komt vooral "Tussenwoningen" veel voor, met ongeveer 1.291 woningen.

Receive free, non-binding quotes

Compare multiple real estate agents and choose the best match.