Residents
11.148
Last year: 2026
7151MG Eibergen • Gelderland
€ 1.075.000 k.k.
Cost of copper (estimated): € 23.350
2% transfer tax (€ 21.500) + notary (€ 1.150) + valuation (€ 700)
Total incl. VAT: € 1.098.350
Purchase price /m²: € 3.812
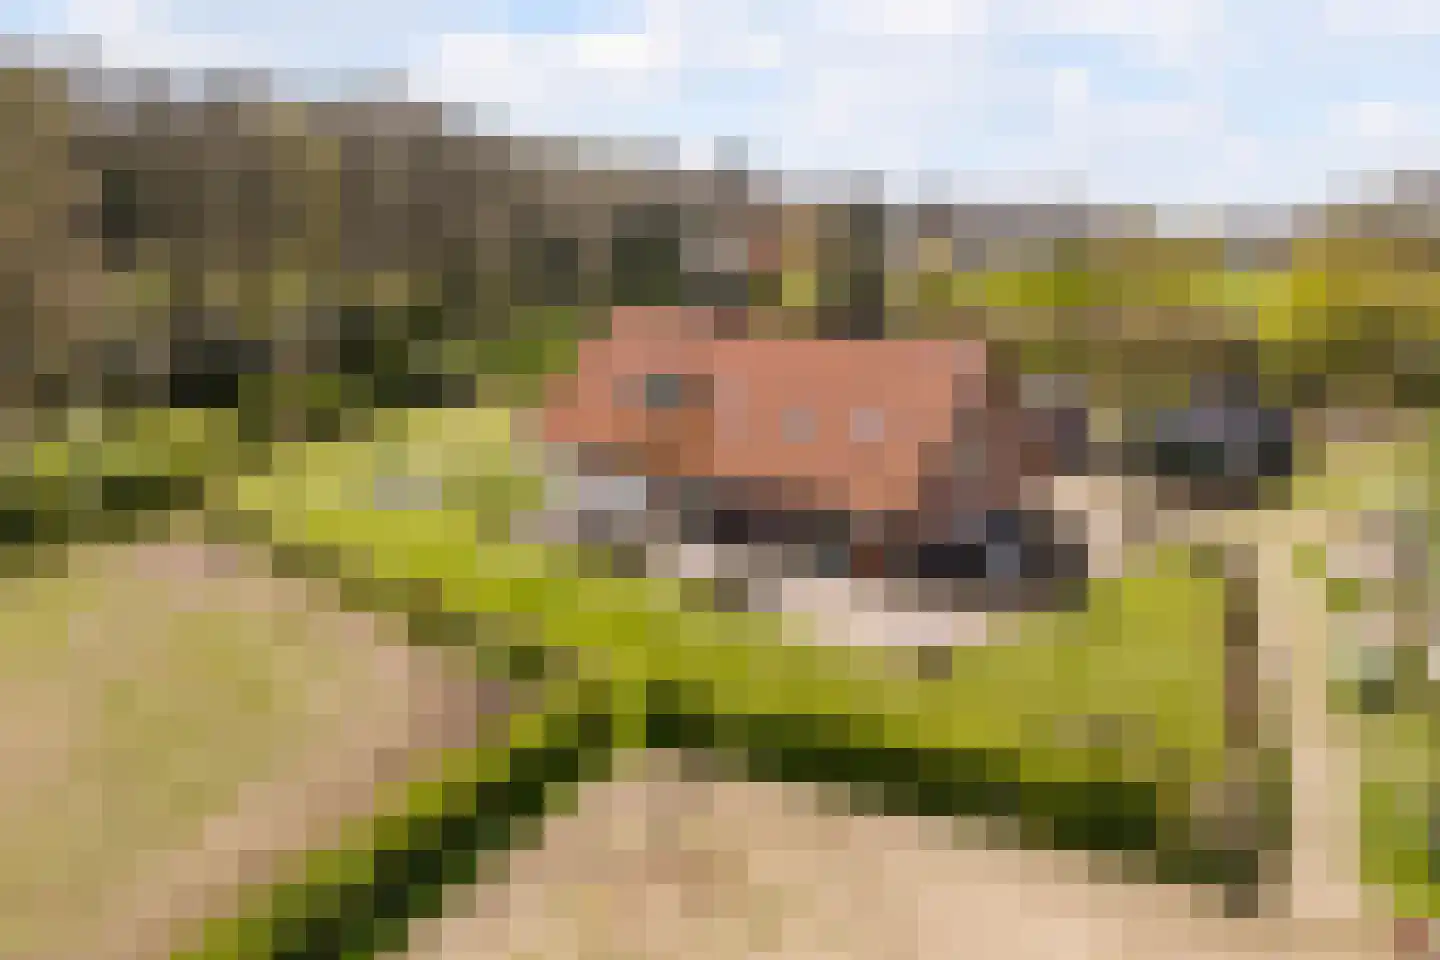
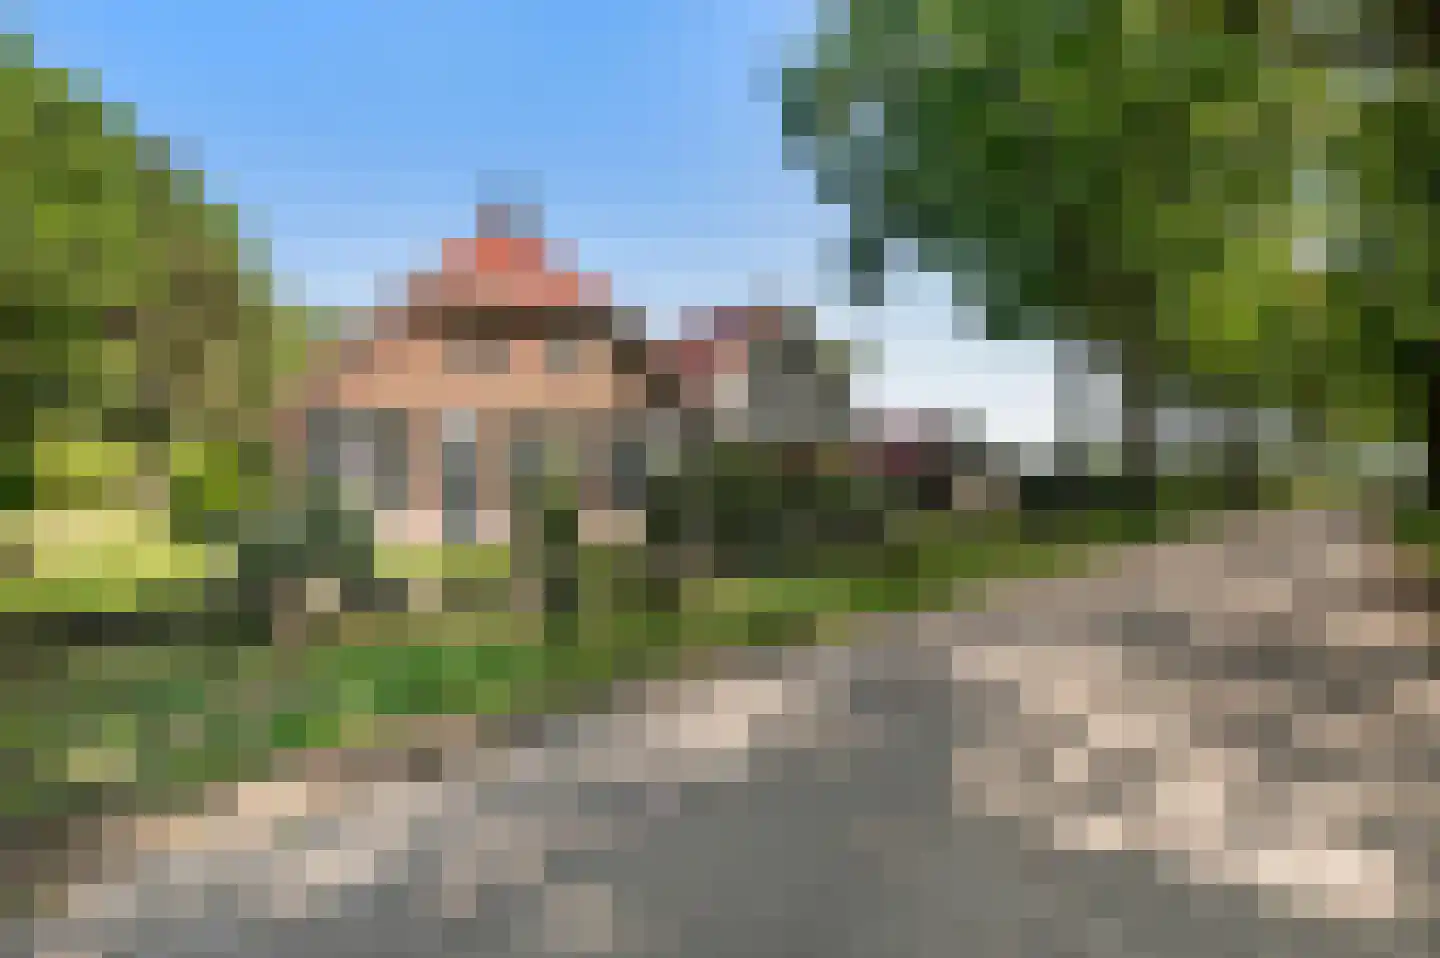
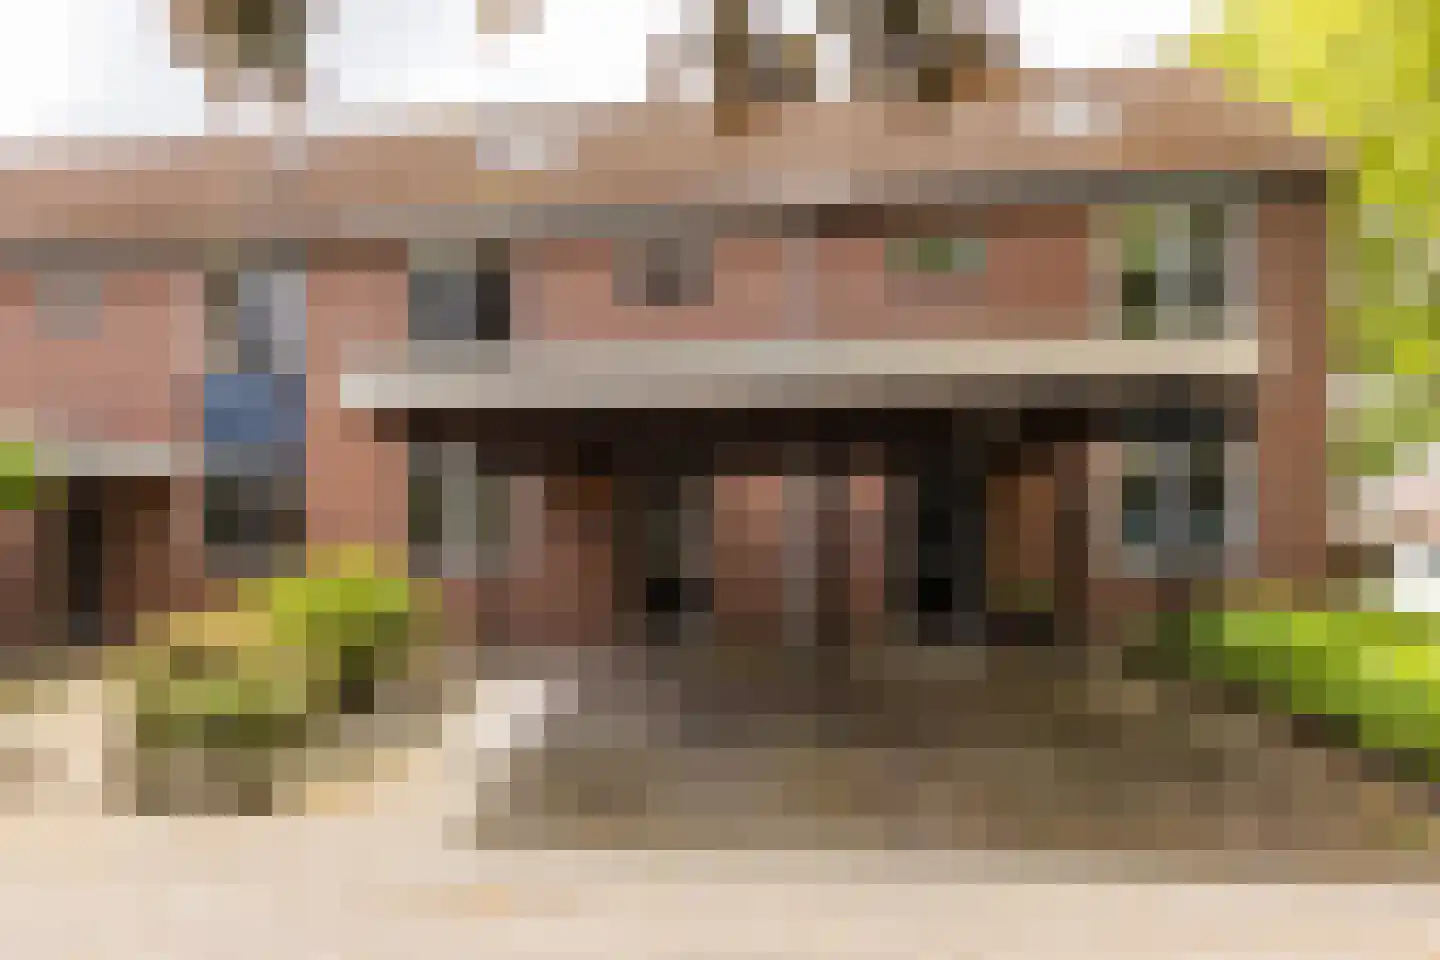
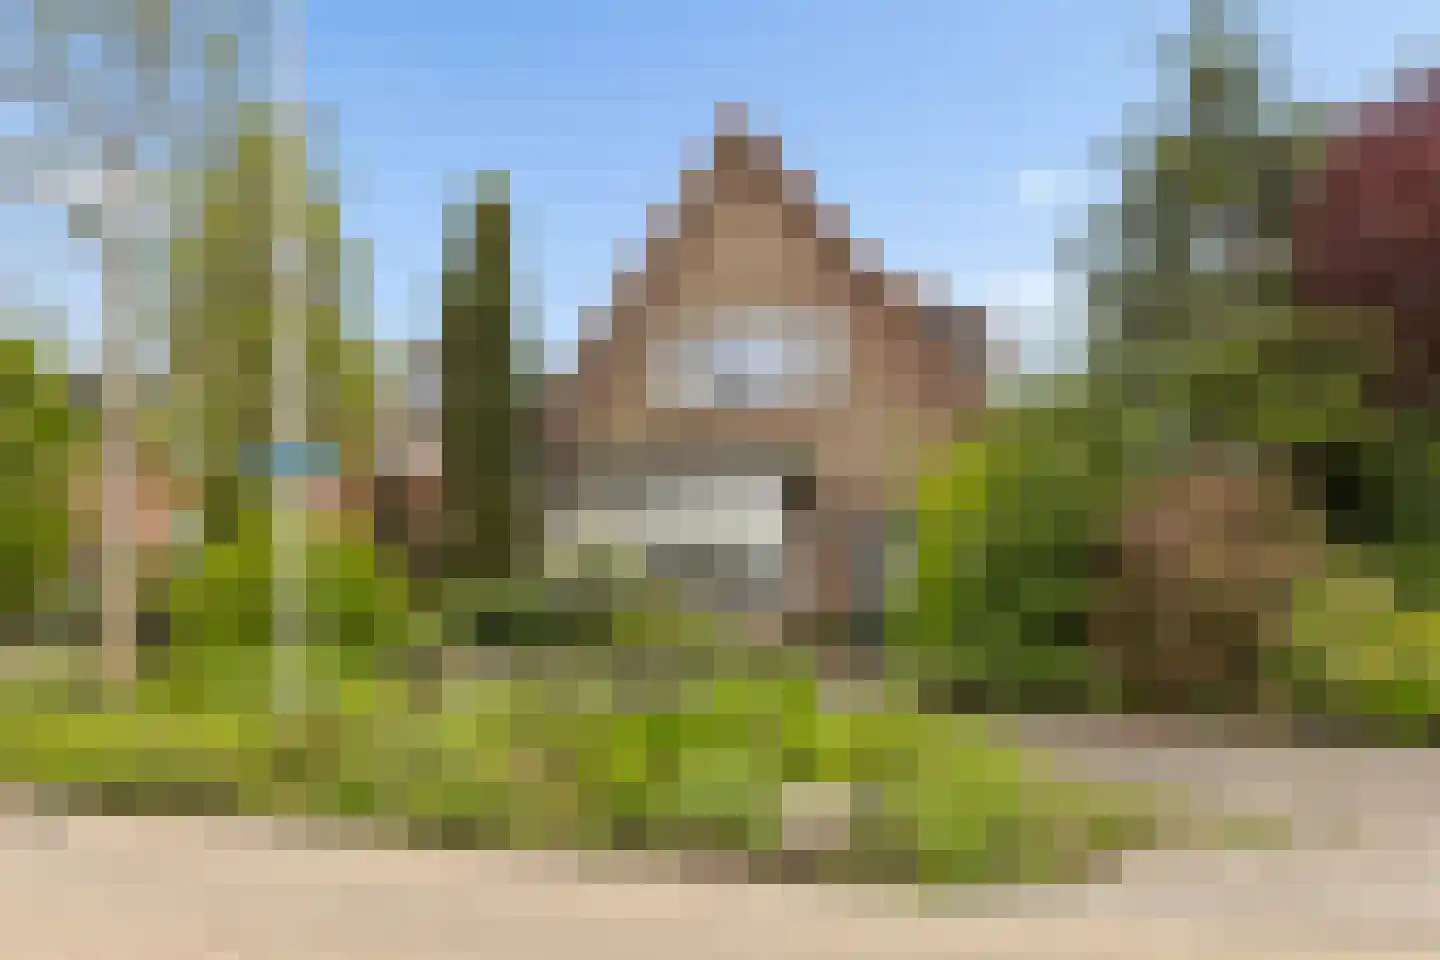
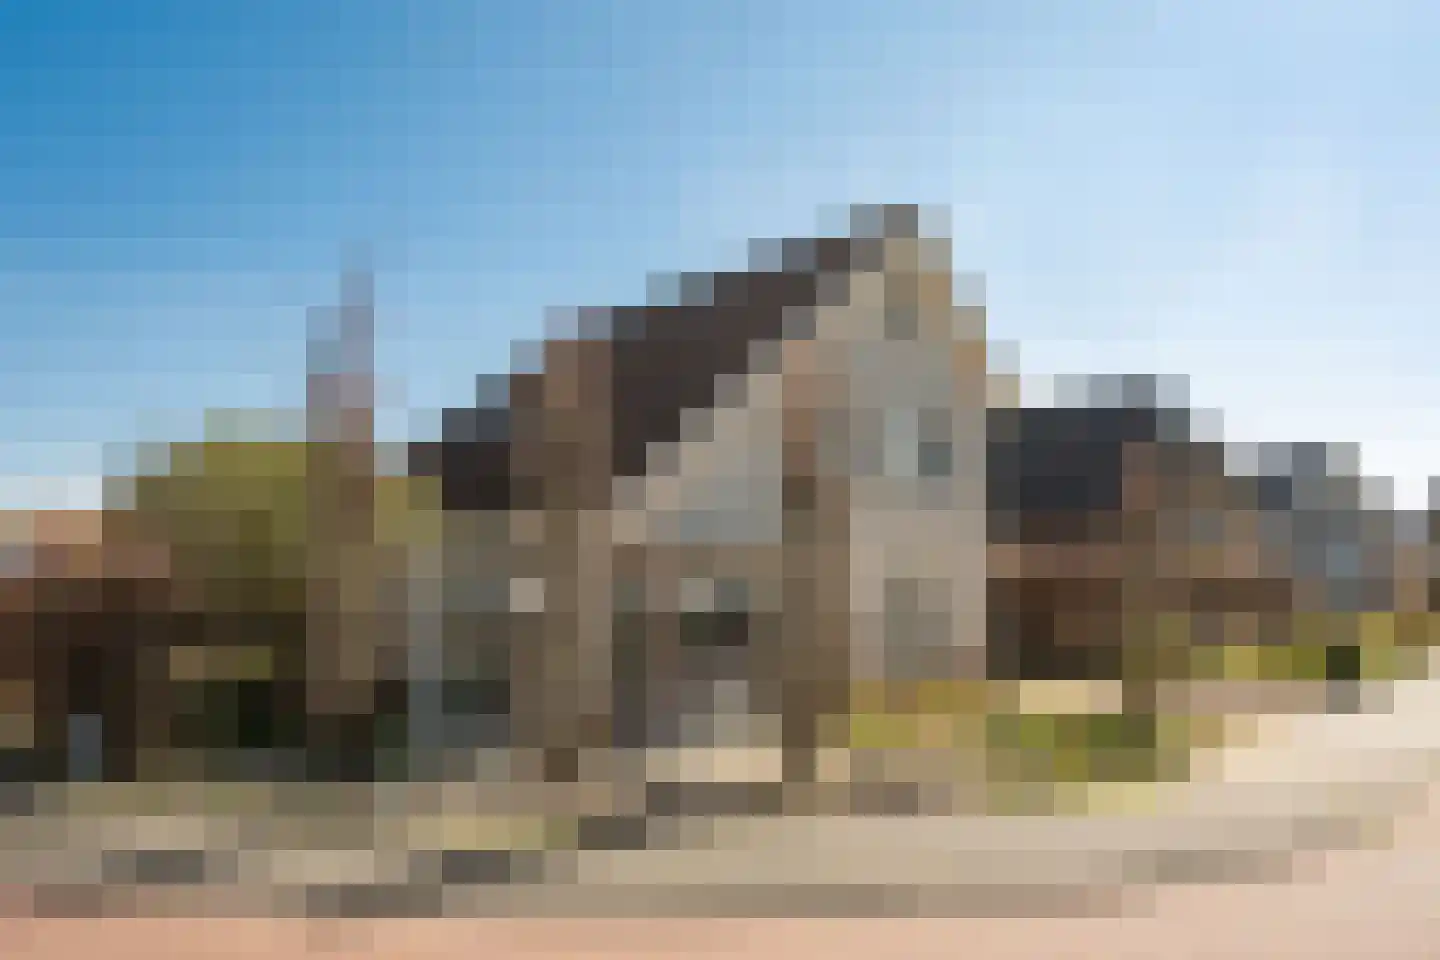
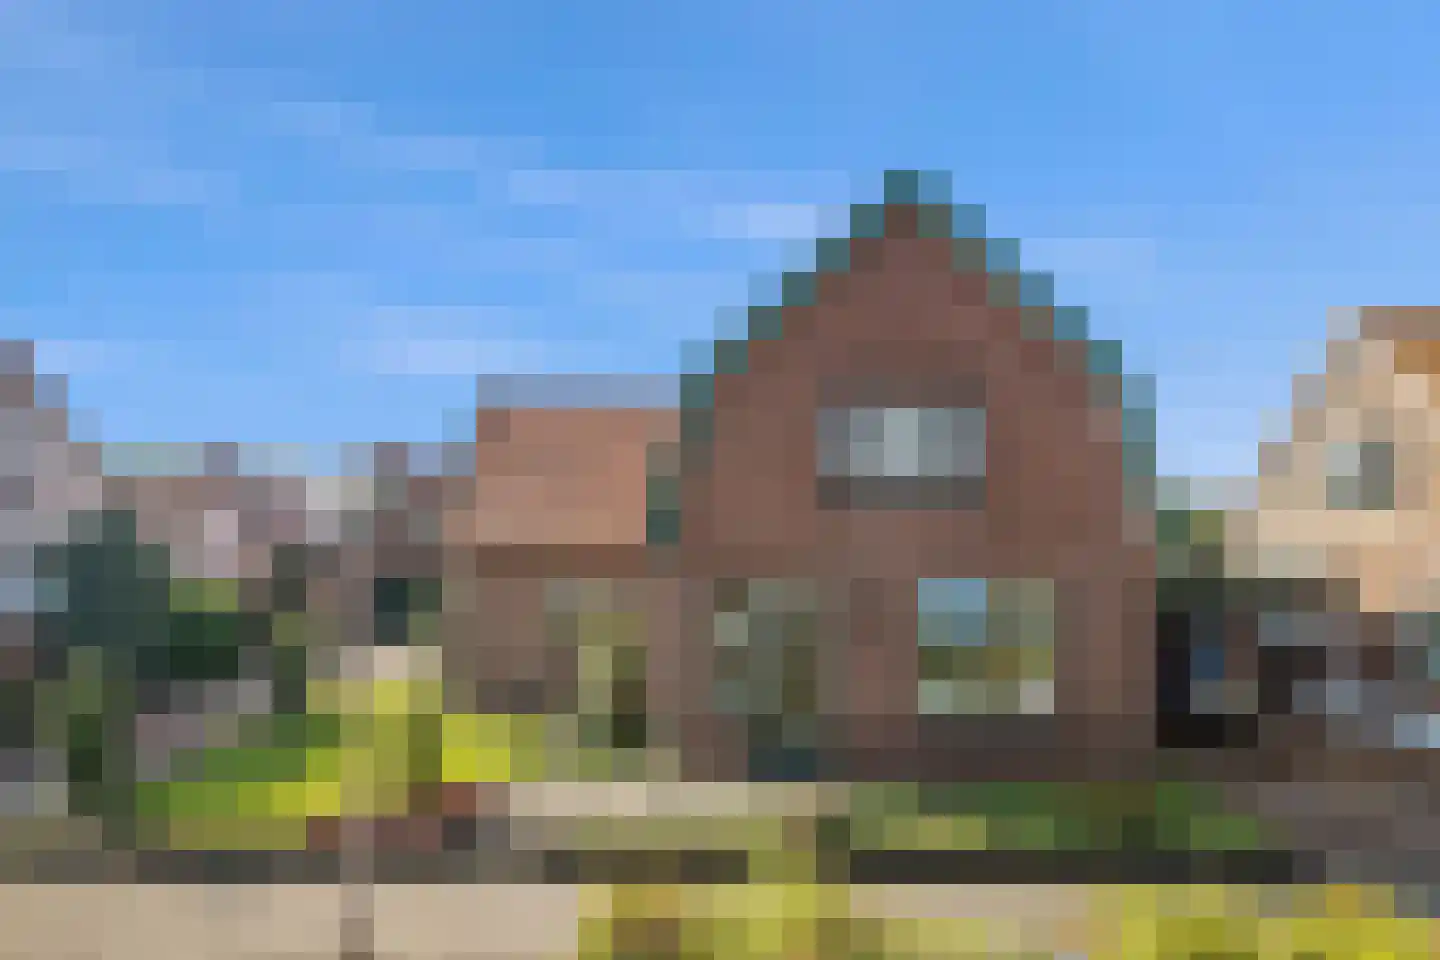
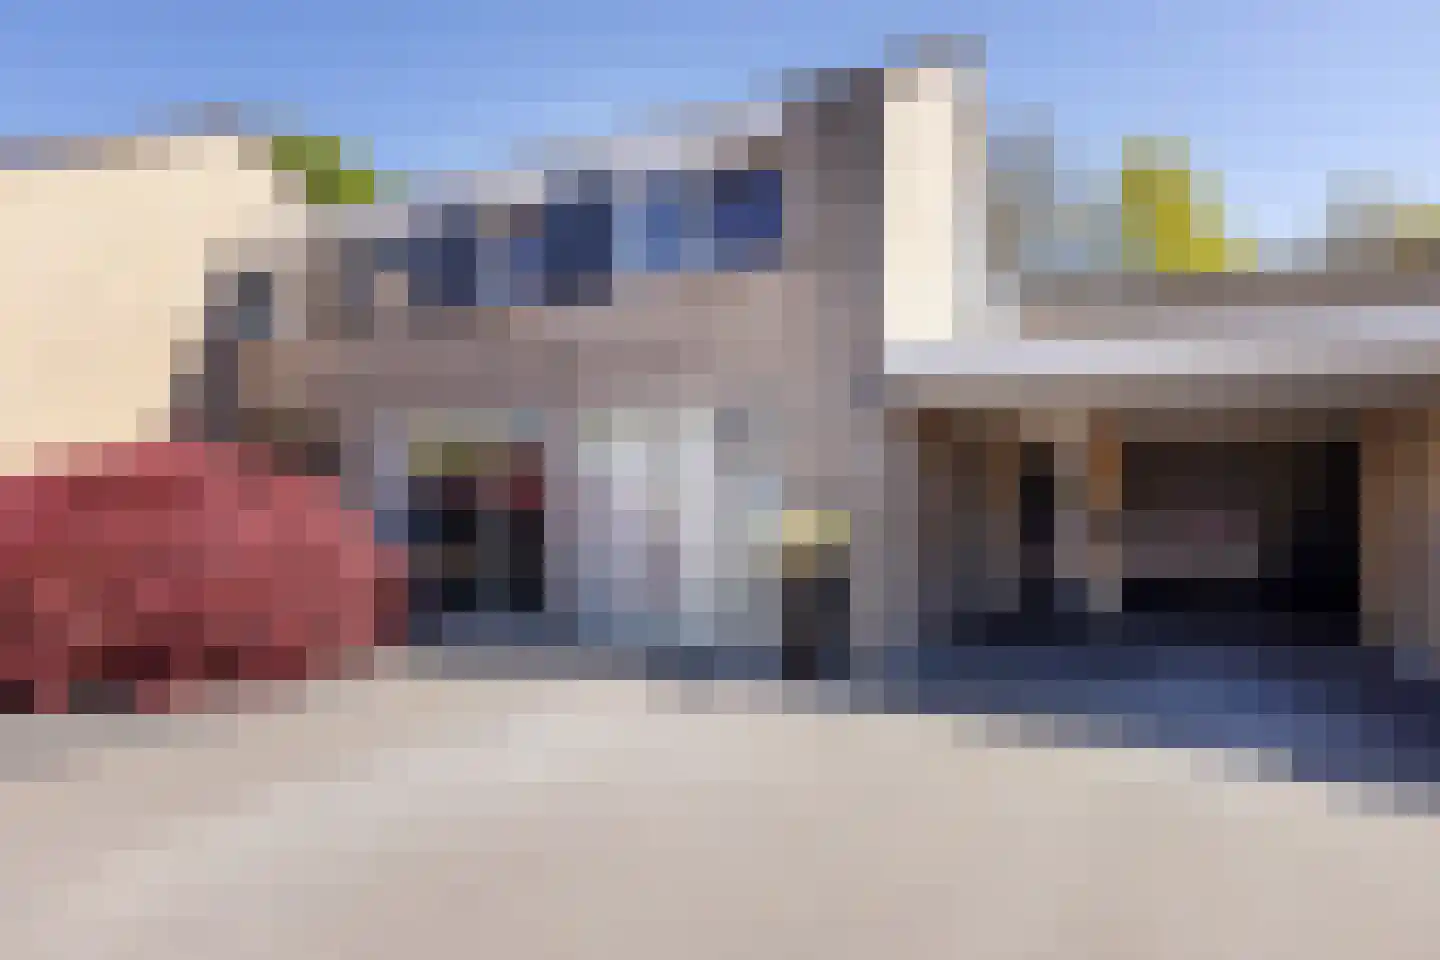
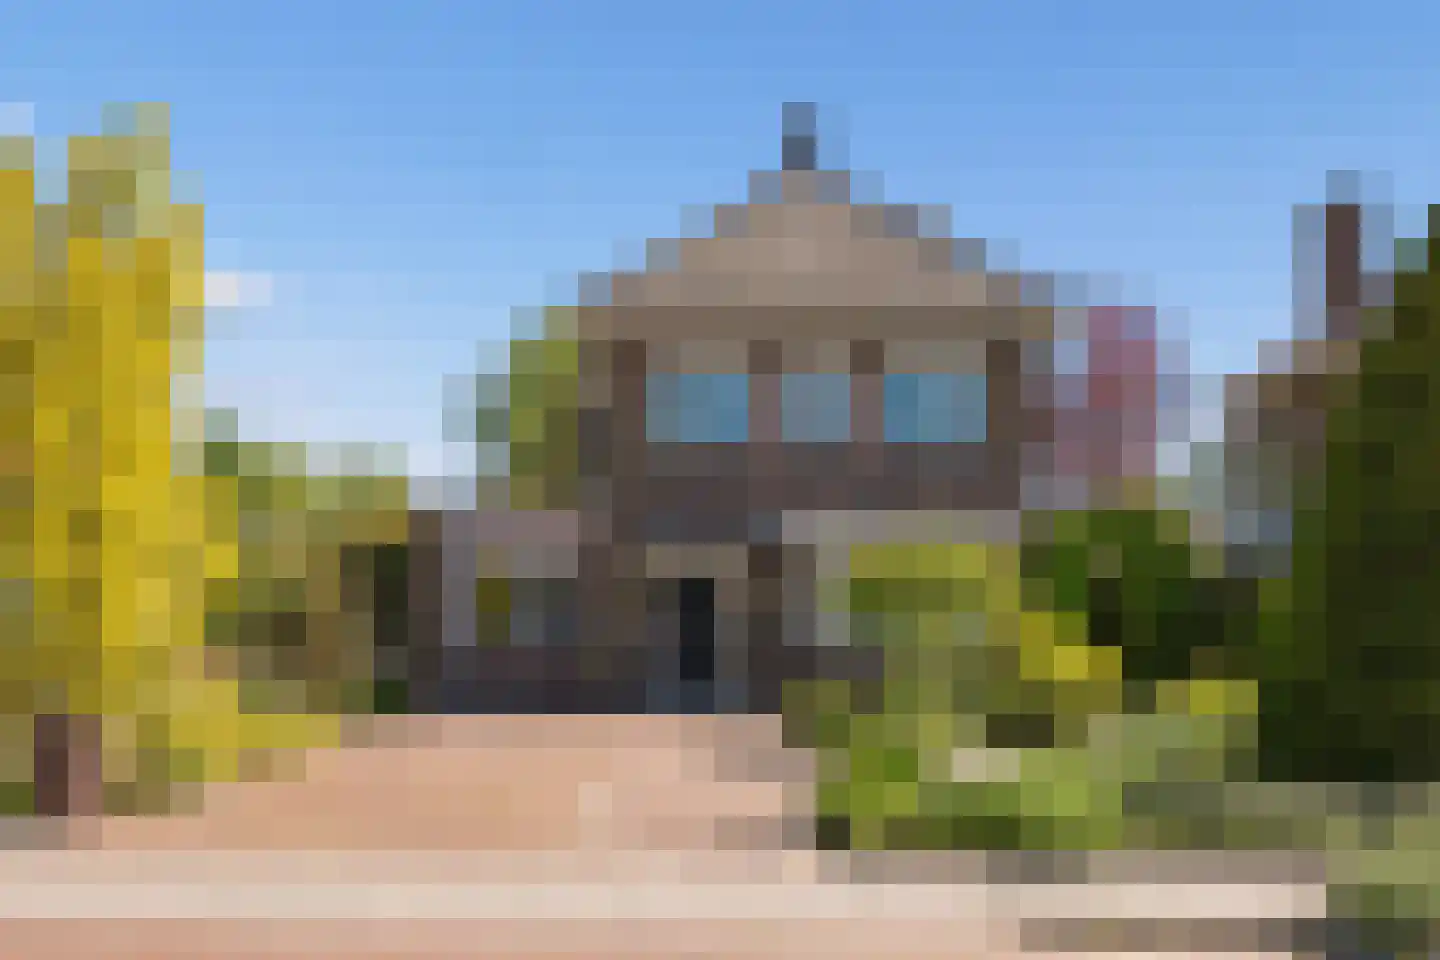
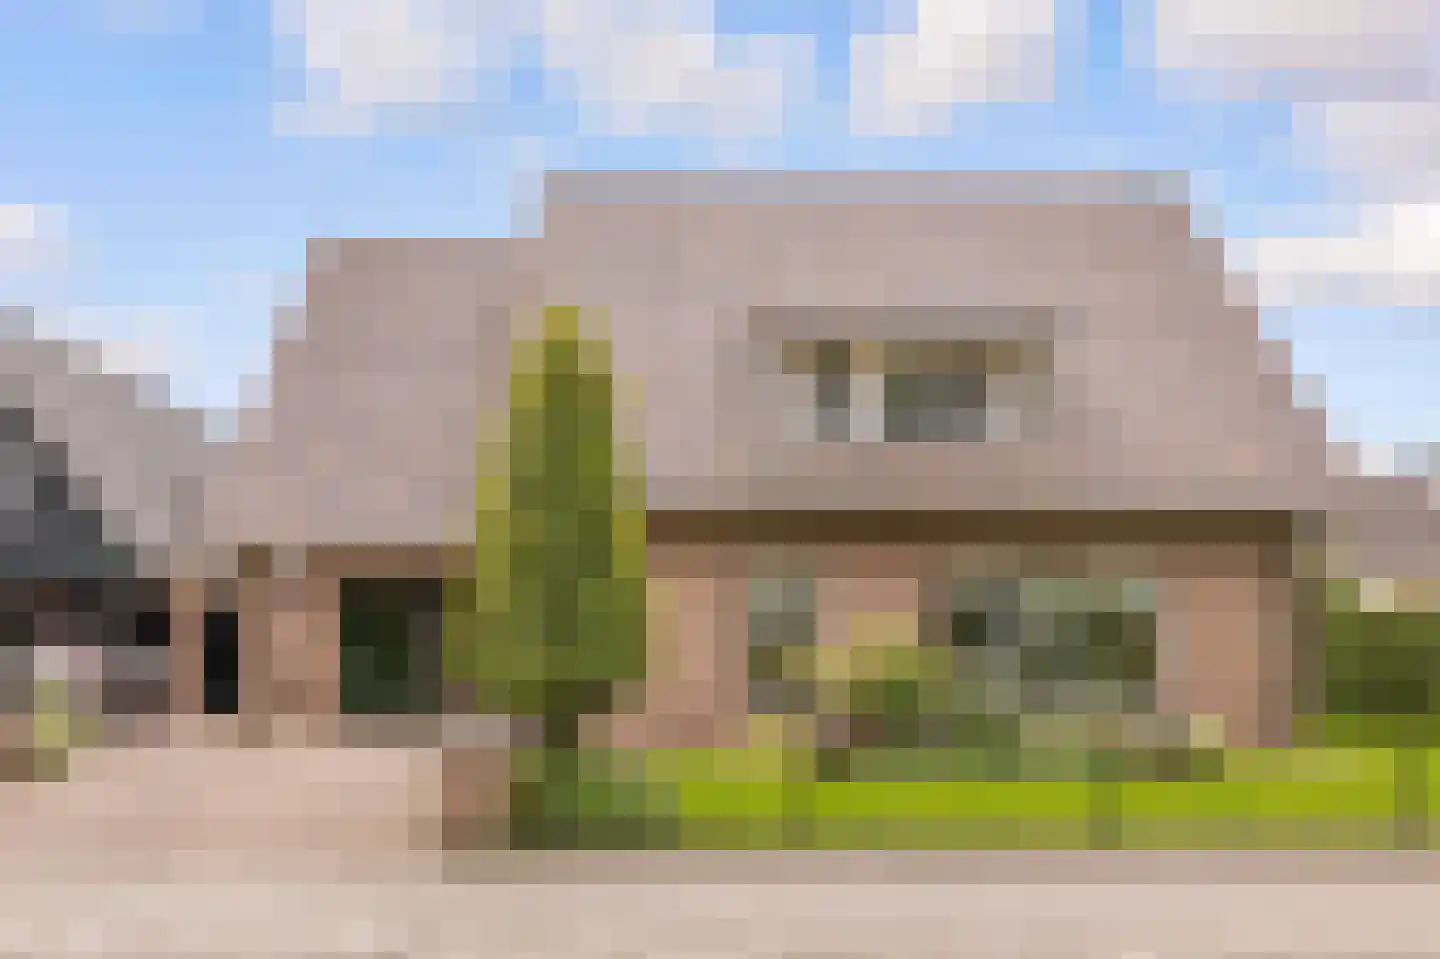
Op een prachtige locatie in het buitengebied van Eibergen staat deze gerenoveerde woonboerderij met oneindig veel mogelijkheden. Het geheel is gelegen op maar liefst drie percelen met een totale oppervlakte van meer dan 17.000 m², ingedeeld over een woonperceel, weiland en een prachtige omringende tuin. Wat het geheel helemaal uniek maakt is het een eigen bos van bijna één hectare! Op één van de percelen bevindt zich een extra (recreatie)woning met eigen huisnummer (5a). Verder beschikt het perceel over een ingericht gastenverblijf, voor recreatief gebruik, een vrijstaande schuur en stalruimte. Hierdoor zijn er mogelijkheden voor het houden van paarden of ander kleinvee en meer dan voldoende ruimte om lekker te hobbyen. Vanaf 2016 is de woning grotendeels gerenoveerd en dit heeft geresulteerd in een vrijwel energie neutrale en gasloze woning. Op de begane grond bevindt zich een zeer riante woonkamer van ruim 70 m², een woonkeuken, bijkeuken, toilet en daarnaast een slaap- en badkamer. Eventueel kan deze kamer ook gebruikt worden als thuiskantoor. Echter zijn we er dan nog lang niet, de verdieping beschikt namelijk over maar liefst zes slaapkamers. Een van de slaapkamers is voorzien van eigen badkamer-ensuite en voor de overige kamers is er een compleet ingerichte badkamer aanwezig. Ook is er nog een multifunctionele ruimte aanwezig, wederom geschikt als thuiswerkplek, maar ook als speelkamer. Op de vliering is nog extra bergruimte aanwezig. Rondom de woning ligt een parkachtige tuin, ingericht met sierbestrating, vele borders, fruitbomen, meerdere zitjes en een prachtig terras. Het gastenverblijf bevindt zich aan de voorzijde van het perceel, waardoor de gasten en bewoners meer dan voldoende privacy hebben. Een leuk weetje, is het feit de zon opkomt achter het bos en dat er dan een prachtige jakobsladder door de bomen schijnt. Aan de achterzijde van het perceel staat nog een vrijstaande schuur van ruim 50 m², opgedeeld in verschillende compartimenten en voor vele doeleinden in gebruik te nemen. Tot slot is er ook nog een schuur ingericht met twee stallen aanwezig. Dit alles bevind zich in een buurtschap waar iedereen gesteld is op zijn privacy, maar waar het Achterhoekse Noaberschap absoluut aanwezig is. Het dorp Eibergen beschikt over een actief verenigingsleven en de benodigde voorzieningen. Daarnaast zijn er meerdere natuurgebieden op steenworp afstand gelegen, wat de locatie geliefd maakt bij wandelaars en fietsen. Globale indeling woonboerderij Begane grond: Entree met trapopgang naar de verdieping; (slaap)kamer I met een badkamer-en-suite; centrale hal; royale woonkeuken met openslaande deuren naar de tuin, ideaal voor binnen-buiten leven; tweede hal met aansluitingen voor wasmachine en droger en extra garderoberuimte; separaat toilet; praktische bijkeuken met de technische installaties; imposante en zeer ruime woonkamer van maar liefst circa 70 m², met volop lichtinval en diverse indelingsmogelijkheden. Verdieping: Riante overloop met toegang tot de vliering; slaapkamer II met eigen badkamer; complete badkamer voor de overige slaapkamers; tussenkamer, ideaal als werk- of hobbyruimte; slaapkamer III; slaapkamer IV; slaapkamer V; slaapkamer VI; slaapkamer VII. Vliering: Te bereiken door middel van een vlizotrap; ingericht met extra bergruimte. Gastenverblijf Het gastenverblijf beschikt over een ruime overkapping, waar het heerlijk vertoeven is. Het verblijf zelf is ingericht met een woonkamer met ruimte voor een eettafel aangrenzend een keukenopstelling. Verder zijn er twee slaapkamers en een badkamer aanwezig. Installaties: • Verwarming en warm water door middel van een warmtepomp van Nefit uit 2018. • De woning is gedeeltelijk voorzien van vloerverwarming en daarnaast ook muurverwarming. • In 2018 zijn er in totaal zijn 30 zonnepanelen geïnstalleerd. Bestemming: Ter plaatse van de woning, verdere opstallen en erf is de bestemming ‘Wonen’, een deel Recreatie, Agrarisch en het aangrenzende bos heeft de bestemming ‘Bos’. Meer informatie kunt u vinden bij de gemeente, Het Omgevingsloket of de website van Het Betere Boerenerf. Algemeen: • Bouwjaar voorhuis 1954 en het achterhuis dateert uit 1949. • Woonoppervlakte ca. 282 m²; overig inpandige ruimte ca. 7 m²; gebouw gebonden buitenruimte ca. 28 m²; externe bergruimte ca. 80 m²; inhoud ca. 1.002 m³. • Wonen, werken en hobby’s combineren: gastenverblijf, schuren en ruimte voor paarden of kleinvee. • Ultieme vrijheid: 17.000 m² met eigen bos, weiland en volledige privacy in het buitengebied. • Energielabel A+. ‘Kortom, woonboerderij met oneindig veel mogelijkheden. Bekijk daarom de foto’s op internet, in onze brochure en maak voor het verkrijgen van een juiste indruk van indeling en sfeer een afspraak voor een bezichtiging.’ Aanvaarding in overleg.
€ 1.075.000
Cost of copper (estimated): € 23.350
2% transfer tax (€ 21.500) + notary (€ 1.150) + valuation (€ 700)
Total purchase (incl. p.p.): € 1.098.350
3,21%
Yearly
€ 53.750
Direct available
Estimated mortgage
Indicative gross monthly cost
Based on annuity and 30 year term
Indicative net monthly cost
iDisclaimer: this mortgage calculation is a simplified indication based on general assumptions. No rights can be derived from the results shown. Calculated with 10-annual interest (zonder NHG), automatically determined based on the price limit € 470.000. Source: 10-jaars rente uit mortgage_rates (07-06-2026 03:45). For non-NHG, an 80% mortgage of the market value has been used in this indication.
2 douches, 3 toiletten, 2 wastafels, dubbele wastafel, inloopdouche, ligbad, en 2 wastafelmeubels
Discover where agents are active in Eibergen
View current location data on residents, WOZ development, housing stock, energy consumption, business activity and safety in Eibergen. In 2026 were there 11.148 residents. The average WOZ value in 2025 is EUR 359.004.
Residents
11.148
Last year: 2026
Average WOZ
EUR 359.004
Last year: 2025
Average income per person.
EUR 28.955
Source: AllNumbers
Crimes (current year)
251
Total registered
| Year | Residents |
|---|---|
| 2021 | 11.180 |
| 2022 | 11.200 |
| 2023 | 11.225 |
| 2024 | 11.115 |
| 2025 | 11.165 |
| 2026 | 11.148 |
| Year | Average WOZ |
|---|---|
| 2021 | EUR 247.098 |
| 2022 | EUR 269.562 |
| 2023 | EUR 321.019 |
| 2024 | EUR 338.256 |
| 2025 | EUR 359.004 |
Hoger
1.320
Praktisch
1.940
Middelbaar
3.410
Europa
600
Nederland
9.885
Buiten Europa
690
Label C
1.547
Label A
1.006
Label B
971
Label G
503
Label D
431
Label F
244
Label E
167
Label A+
136
Label A++
69
Label A+++
40
Label A++++
30
Label A+++++
0
| Year | Gas (m3) | Electricity (kWh) |
|---|---|---|
| 2020 | 1.282 | 2.880 |
| 2021 | 1.457 | 2.943 |
| 2022 | 1.152 | 2.791 |
| 2023 | 943 | 2.661 |
| 2024 | 917 | 2.777 |
Hoekwoning
Gas: 765 • Electricity: 2.067
Huurwoning
Gas: 752 • Electricity: 1.853
Koopwoning
Gas: 1.026 • Electricity: 2.991
Appartement
Gas: 591 • Electricity: 1.524
Tussenwoning
Gas: 684 • Electricity: 2.018
Vrijstaande woning
Gas: 1.275 • Electricity: 3.586
Twee-onder-één-kap woning
Gas: 970 • Electricity: 2.847
Total number of company establishments: 1.255
| Period | Crimes |
|---|---|
| jan 2026 | 24 |
| jul 2025 | 26 |
| jun 2025 | 19 |
| mei 2025 | 19 |
| mrt 2025 | 23 |
| mrt 2026 | 14 |
| nov 2024 | 29 |
| nov 2025 | 27 |
| okt 2024 | 32 |
| okt 2025 | 20 |
| sep 2024 | 26 |
| sep 2025 | 12 |
These figures give an indicative picture of safety trends in the living environment of Eibergen.
Short answers based on current local statistics, handy for a quick comparison of the living environment.
Eibergen telt in 2026 ongeveer 11.148 inwoners.
De gemiddelde WOZ-waarde in Eibergen is in 2025 circa € 359.004.
Het gemiddelde inkomen per inwoner in Eibergen ligt rond € 28.955 per jaar.
Voor het huidige jaar gaat het om ongeveer 251 geregistreerde misdrijven. Gebruik deze cijfers als indicatie en vergelijk trends per periode.
In Eibergen komt vooral "Tussenwoningen" veel voor, met ongeveer 1.291 woningen.
View more homes in this location.
7152BP Eibergen
€ 985.000 k.k.
€ 5.267/m²
7152BJ Eibergen
€ 338.000 k.k.
€ 3.073/m²
7151DR Eibergen
€ 695.000 k.k.
€ 4.137/m²
7152KV Eibergen
€ 665.000 k.k.
€ 3.866/m²
7151DE Eibergen
€ 547.500 k.k.
€ 3.967/m²
7151VN Eibergen
€ 475.000 k.k.
€ 3.571/m²
7151AE Eibergen
€ 750.000 k.k.
€ 4.688/m²
7151EE Eibergen
€ 595.000 k.k.
€ 4.281/m²
