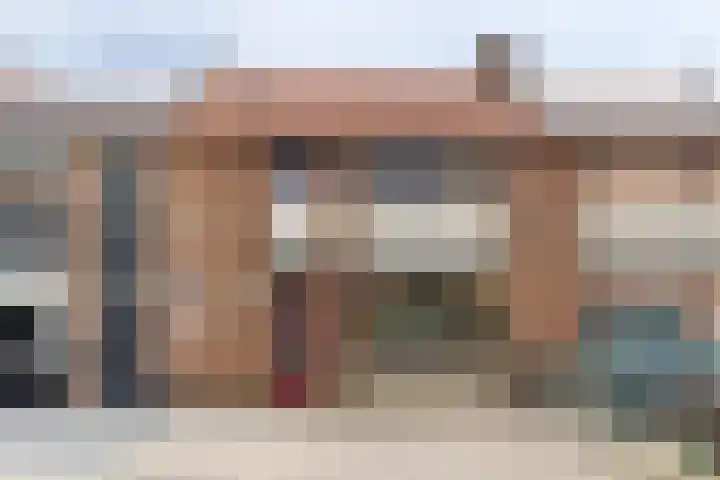
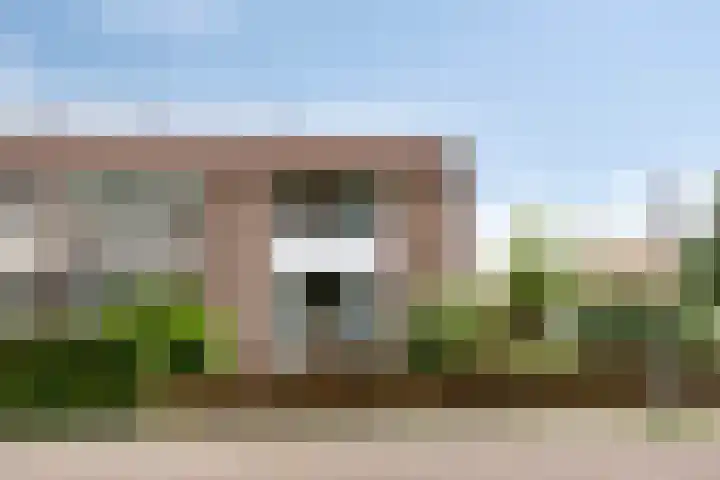
Houses sold in Groesbeek

View 135 sold houses in Groesbeek

Connected to: Vastgoed Nederland NVM Makelaars

On this page you will find recently sold homes in Groesbeek. Use this overview to better estimate selling prices, popular neighborhoods, and the local housing supply before you choose a real estate agent. Also view the current housing supply with 190 houses in Groesbeek.

Selection

Search and filter homes

Set your preferences and discover homes that suit you.

Total supply 241.455
Filters

Set price, area and other characteristics. Adjust a filter or click on Show homes. Location changes directly above.

Reset filters

You search for

  • Place Groesbeek
  • Status Sold

Huis verkopen in Groesbeek? Vergelijk verkoopmakelaars

Bekijk recente verkopen en ontvang gratis offertes van lokale verkoopmakelaars in Groesbeek.

Free request a quote

  • Quotes in Groesbeek
  • Non-binding
  • Personal
  • Gratis tarieven vergelijken

Zelf je woning verkopen in Groesbeek? Vergelijk verkoopmakelaars in Groesbeek of bekijk de beste verkoopmakelaars in Groesbeek als referentie bij jouw keuze.

Vergelijk meerdere offertes

Makelaars maken scherpere voorstellen als ze weten dat je vergelijkt — vraag offertes aan voor verkoop of aankoop.

Frequently asked questions about sold homes in Groesbeek

Short answers about housing prices, sold homes and comparing real estate agents in Groesbeek.

Residential and neighborhood statistics in Groesbeek

View current location data on residents, WOZ development, housing stock, energy consumption, business activity and safety in Groesbeek. In 2026 were there 17.231 residents. The average WOZ value in 2025 is EUR 378.526.

These figures help to better assess and compare the housing stock in Groesbeek with recent sold homes. Orient yourself then on suitable top real estate agents in Groesbeek for sales advice in this region.

Residents

17.231

Last year: 2026

Average WOZ

EUR 378.526

Last year: 2025

Average income per person.

EUR 29.548

Source: AllNumbers

Crimes (current year)

603

Total registered

Demographics and WOZ development

Inhabitants per year

Inhabitants per year in Groesbeek
Year Residents
2021 16.750
2022 16.745
2023 17.120
2024 17.160
2025 17.205
2026 17.231

Annual WOZ value

WOZ value per year in Groesbeek
Year Average WOZ
2021 EUR 262.246
2022 EUR 288.873
2023 EUR 333.543
2024 EUR 354.904
2025 EUR 378.526

Composition of residents

Age build-up

65+: 4.615 0-15: 2.240 15-25: 1.790 25-45: 3.905 45-65: 4.715

Education level

Hoger

3.540

Praktisch

3.820

Middelbaar

5.480

Origin of residents (2025)

Europa

1.555

Nederland

14.370

Buiten Europa

1.285

Housing stock and construction periods

Types of homes

Hoekwoningen 1.209
Appartementen 1.806
Tussenwoningen 2.048
Vrijstaande woningen 1.627
Twee-onder-één-kap woningen 1.214

Construction period of buildings

Voor 1700 2
1700 tot 1900 59
1900 tot 1925 142
1925 tot 1950 742
1950 tot 1970 1.581
1970 tot 1980 1.392
1980 tot 1990 852
1990 tot 2000 765
2000 tot 2010 686
2010 tot 2020 655
2020 en later 308

Energy and sustainability

Energy label distribution

Label A

2.113

Label C

1.743

Label B

1.334

Label F

614

Label D

534

Label G

368

Label E

259

Label A+++

256

Label A+

229

Label A++

160

Label A++++

8

Label A+++++

3

Average energy consumption per year

Average energy consumption per year in Groesbeek
Year Gas (m3) Electricity (kWh)
2020 1.295 3.044
2021 1.403 3.100
2022 1.109 2.908
2023 909 2.771
2024 888 2.801

Consumption per house type

Hoekwoning

Gas: 867 • Electricity: 2.603

Huurwoning

Gas: 671 • Electricity: 2.192

Koopwoning

Gas: 1.082 • Electricity: 3.155

Appartement

Gas: 561 • Electricity: 2.062

Tussenwoning

Gas: 754 • Electricity: 2.466

Vrijstaande woning

Gas: 1.418 • Electricity: 3.921

Twee-onder-één-kap woning

Gas: 1.084 • Electricity: 2.988

Business activity in Groesbeek (2025)

Handel en HORECA 295
Nijverheid en energie 405
Zakelijke dienstverlening 390
Overheid, onderwijs en zorg 335
Landbouw, bosbouw en visserij 75
Vervoer, informatie en communicatie 75
Financiele diensten en onroerendgoed 115
Cultuur, recreatie en overige diensten 225

Total number of company establishments: 1.910

Recent crime statistics

Recent crime statistics in Groesbeek
Period Crimes
jan 2026 44
jul 2025 49
jun 2025 44
mei 2025 58
mrt 2025 51
mrt 2026 46
nov 2024 26
nov 2025 35
okt 2024 45
okt 2025 61
sep 2024 49
sep 2025 34

These figures give an indicative picture of safety trends in the living environment of Groesbeek.

Frequently asked questions about living in Groesbeek

Short answers based on current local statistics, handy for a quick comparison of the living environment.

Hoeveel inwoners heeft Groesbeek?

Groesbeek telt in 2026 ongeveer 17.231 inwoners.

Wat is de gemiddelde WOZ-waarde in Groesbeek?

De gemiddelde WOZ-waarde in Groesbeek is in 2025 circa € 378.526.

Wat is het gemiddelde inkomen per inwoner in Groesbeek?

Het gemiddelde inkomen per inwoner in Groesbeek ligt rond € 29.548 per jaar.

Hoe veilig is wonen in Groesbeek?

Voor het huidige jaar gaat het om ongeveer 603 geregistreerde misdrijven. Gebruik deze cijfers als indicatie en vergelijk trends per periode.

Welke woningtypen komen het meest voor in Groesbeek?

In Groesbeek komt vooral "Tussenwoningen" veel voor, met ongeveer 2.048 woningen.

Gratis vrijblijvende offertes ontvangen

Vergelijk meerdere makelaars en kies de beste match.