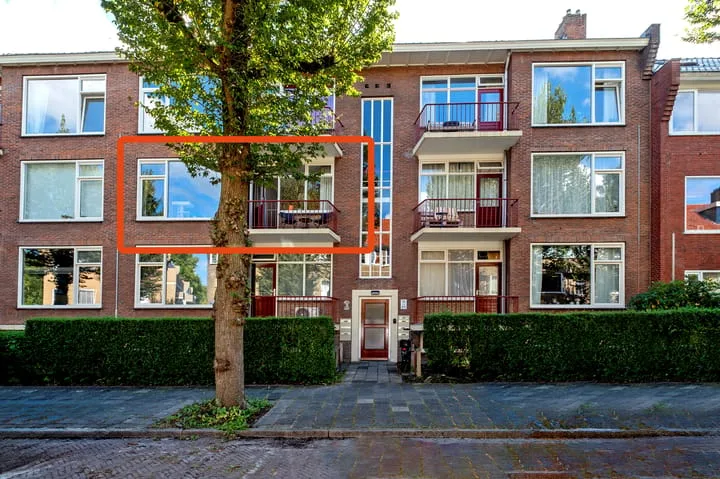
- Sold
Jadestraat 17
9743HA Groningen
€ 365.000 k.k.
€ 3.686/m²
- Living area
- 99 m²
- Land area
- 465 m²
- Bedrooms
- 4
Searching in 3.231 houses in Groningen
Type to search. Use arrow down and arrow up to navigate through results and press Enter to open.
Hidden search suggestions.
View current properties in Groningen or search targeted on street, postal code and property characteristics.
View the current housing stock in Groningen and quickly filter by price, living area, rooms and more. There are currently 3.231 houses in this place within our selection. View also 2.463 sold houses in Groningen for extra insight into the local housing market.
9743HA Groningen
€ 365.000 k.k.
€ 3.686/m²
9722CW Groningen
€ 275.000 k.k.
€ 3.716/m²
9718SB Groningen
€ 245.000 k.k.
€ 3.402/m²
9724JZ Groningen
€ 325.000 k.k.
€ 4.452/m²
9713KC Groningen
€ 475.000 k.k.
€ 4.750/m²
9728AE Groningen
€ 215.000 k.k.
€ 3.583/m²
9718BX Groningen
€ 575.000 k.k.
€ 5.582/m²
9711GB Groningen
€ 300.000 k.k.
€ 4.285/m²
9742SC Groningen
€ 495.000 k.k.
€ 4.057/m²
9737LW Groningen
€ 289.500 k.k.
€ 3.047/m²
9722NH Groningen
€ 275.000 k.k.
€ 3.353/m²
9728SB Groningen
€ 435.000 k.k.
€ 4.350/m²
9722AA Groningen
€ 525.000 k.k.
€ 4.646/m²
9746TD Groningen
€ 750.000 k.k.
€ 2.343/m²
9718GN Groningen
€ 510.000 k.k.
€ 3.187/m²
9721WB Groningen
€ 1.049.000 k.k.
€ 5.827/m²
9721PH Groningen
€ 235.000 k.k.
€ 2.831/m²
9723LB Groningen
€ 290.000 k.k.
€ 4.393/m²
9717GT Groningen
€ 375.000 k.k.
€ 5.514/m²
9734CV Groningen
€ 435.000 k.k.
€ 3.686/m²
9736TT Groningen
Price upon request
9725HP Groningen
Price upon request
9743ES Groningen
€ 400.000 k.k.
€ 3.389/m²
9746AR Groningen
€ 479.000 k.k.
€ 3.926/m²
9726JM Groningen
€ 249.000 k.k.
€ 3.112/m²
9722PT Groningen
€ 295.000 k.k.
€ 3.687/m²
9741HD Groningen
€ 250.000 k.k.
€ 3.205/m²
9732AG Groningen
€ 239.000 k.k.
€ 2.597/m²
Get free quotes from realtors with local market knowledge in Groningen.
Woning verkopen in Groningen? Bekijk de verkoopgerichte gids huis verkopen in Groningen, vergelijk alle makelaars in Groningen of bekijk de top 10 makelaars in Groningen voor extra context bij je keuze.
Makelaars maken scherpere voorstellen als ze weten dat je vergelijkt — vraag offertes aan voor verkoop of aankoop.
Practical answers about housing supply, sales and comparing real estate agents in Groningen.
The costs of a real estate agent in Groningen depend on commission, start-up costs, property presentation and the chosen service. View the real estate agents in Groningen and request multiple quotes to compare rates and approach properly.
Within our selection, we are currently showing 3.231 houses in Groningen. View also the sold houses in Groningen to compare the current offering with recent transactions.
Take into account not only price and living area but also maintenance, energy label, location, outdoor space and sales status. This way you compare houses in Groningen on more than just the asking price.
A local real estate agent knows the neighborhoods, recent transactions and demand in Groningen. By comparing agents you get a better insight into fees, sales strategy and expected yield; the top 10 in Groningen gives a handy starting point.
Yes, when making a sales plan, a valuation in Groningen is wise. You gain insight into a realistic asking price and can then compare offers from real estate agents specifically.
View current location data on residents, WOZ development, housing stock, energy consumption, business activity and safety in Groningen. In 2025 were there 211.700 residents. The average WOZ value in 2025 is EUR 293.695.
These figures help to better assess and compare the housing stock in Groningen with recent sold homes. Orient yourself then on suitable top real estate agents in Groningen for sales advice in this region.
Residents
211.700
Last year: 2025
Average WOZ
EUR 293.695
Last year: 2025
Average income per person.
EUR 30.848
Source: AllNumbers
Crimes (current year)
14.334
Total registered
| Year | Residents |
|---|---|
| 2021 | 202.905 |
| 2022 | 203.955 |
| 2023 | 206.010 |
| 2024 | 211.120 |
| 2025 | 211.700 |
| Year | Average WOZ |
|---|---|
| 2021 | EUR 212.933 |
| 2022 | EUR 237.307 |
| 2023 | EUR 278.911 |
| 2024 | EUR 282.292 |
| 2025 | EUR 293.695 |
Hoger
78.440
Praktisch
27.960
Middelbaar
70.780
Europa
25.770
Nederland
144.365
Buiten Europa
41.575
Label A
35.130
Label C
23.443
Label B
16.569
Label D
8.436
Label E
6.737
Label G
5.153
Label A+
4.522
Label F
4.407
Label A+++
3.164
Label A++
2.391
Label A++++
461
Label A+++++
31
| Year | Gas (m3) | Electricity (kWh) |
|---|---|---|
| 2020 | 1.018 | 2.119 |
| 2021 | 1.125 | 2.152 |
| 2022 | 877 | 2.017 |
| 2023 | 746 | 1.905 |
| 2024 | 721 | 1.921 |
Hoekwoning
Gas: 1.032 • Electricity: 2.369
Huurwoning
Gas: 677 • Electricity: 1.728
Koopwoning
Gas: 872 • Electricity: 2.183
Appartement
Gas: 630 • Electricity: 1.651
Tussenwoning
Gas: 894 • Electricity: 2.209
Vrijstaande woning
Gas: 1.448 • Electricity: 3.256
Twee-onder-één-kap woning
Gas: 1.159 • Electricity: 2.635
Total number of company establishments: 27.345
| Period | Crimes |
|---|---|
| jan 2025 | 1.088 |
| jan 2026 | 1.104 |
| jul 2025 | 1.142 |
| jun 2025 | 1.229 |
| mei 2025 | 1.195 |
| mrt 2025 | 1.166 |
| nov 2024 | 1.246 |
| nov 2025 | 1.266 |
| okt 2024 | 1.436 |
| okt 2025 | 1.390 |
| sep 2024 | 1.231 |
| sep 2025 | 1.275 |
These figures give an indicative picture of safety trends in the living environment of Groningen.
Short answers based on current local statistics, handy for a quick comparison of the living environment.
Groningen telt in 2025 ongeveer 211.700 inwoners.
De gemiddelde WOZ-waarde in Groningen is in 2025 circa € 293.695.
Het gemiddelde inkomen per inwoner in Groningen ligt rond € 30.848 per jaar.
Voor het huidige jaar gaat het om ongeveer 14.334 geregistreerde misdrijven. Gebruik deze cijfers als indicatie en vergelijk trends per periode.
In Groningen komt vooral "Appartementen" veel voor, met ongeveer 76.656 woningen.