Residents
7.972
Last year: 2026
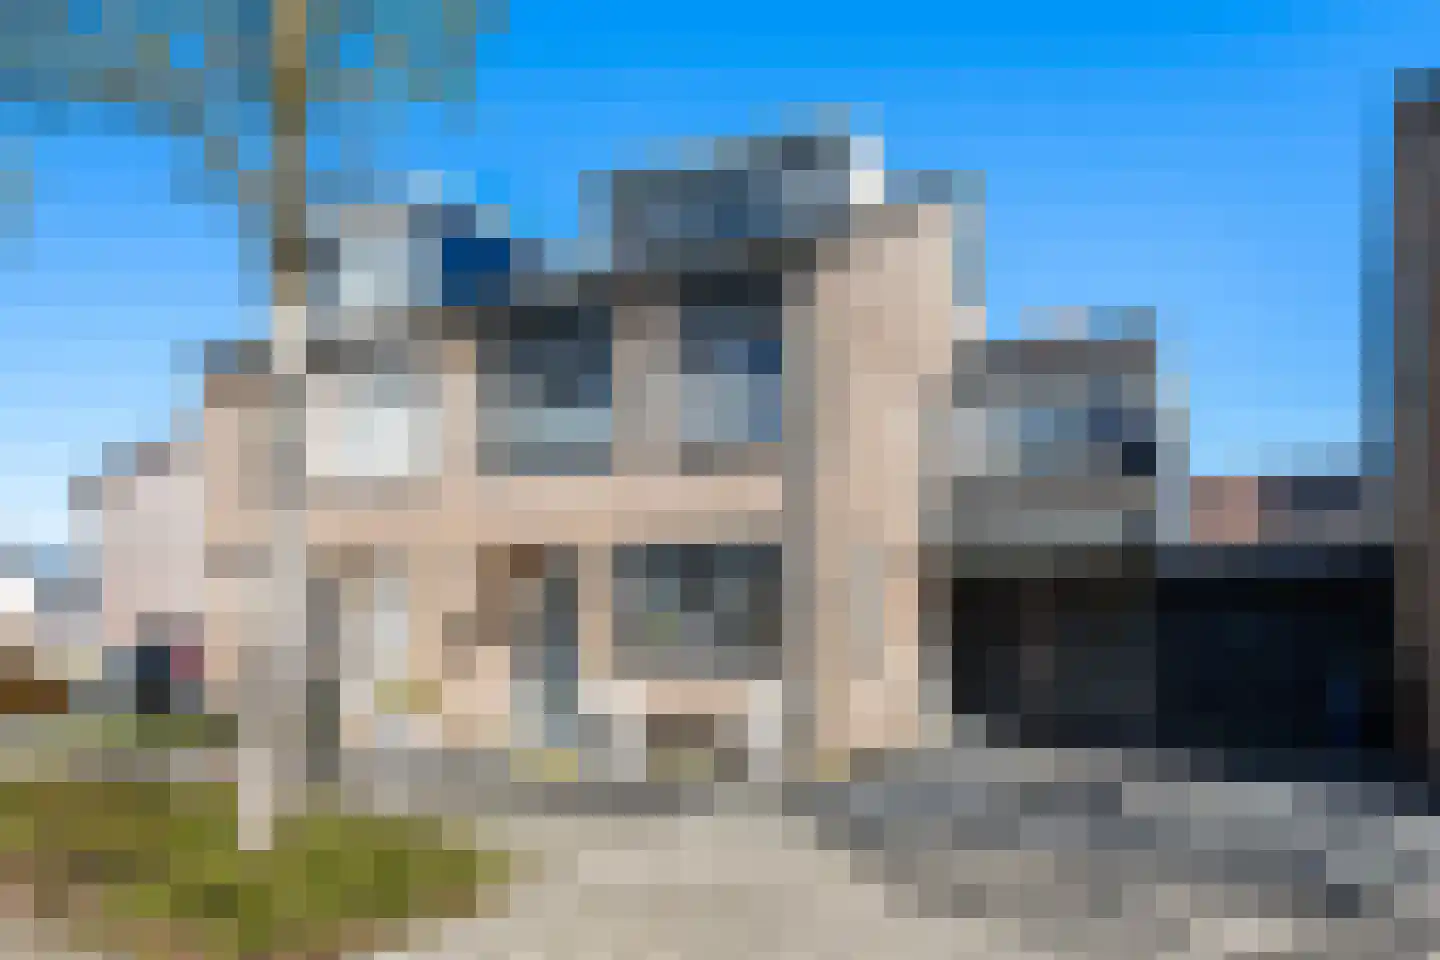
8061LP Hasselt • Overijssel
€ 475.000 k.k.
Cost of copper (estimated): € 11.350
2% transfer tax (€ 9.500) + notary (€ 1.150) + valuation (€ 700)
Total incl. VAT: € 486.350
Purchase price /m²: € 3.167
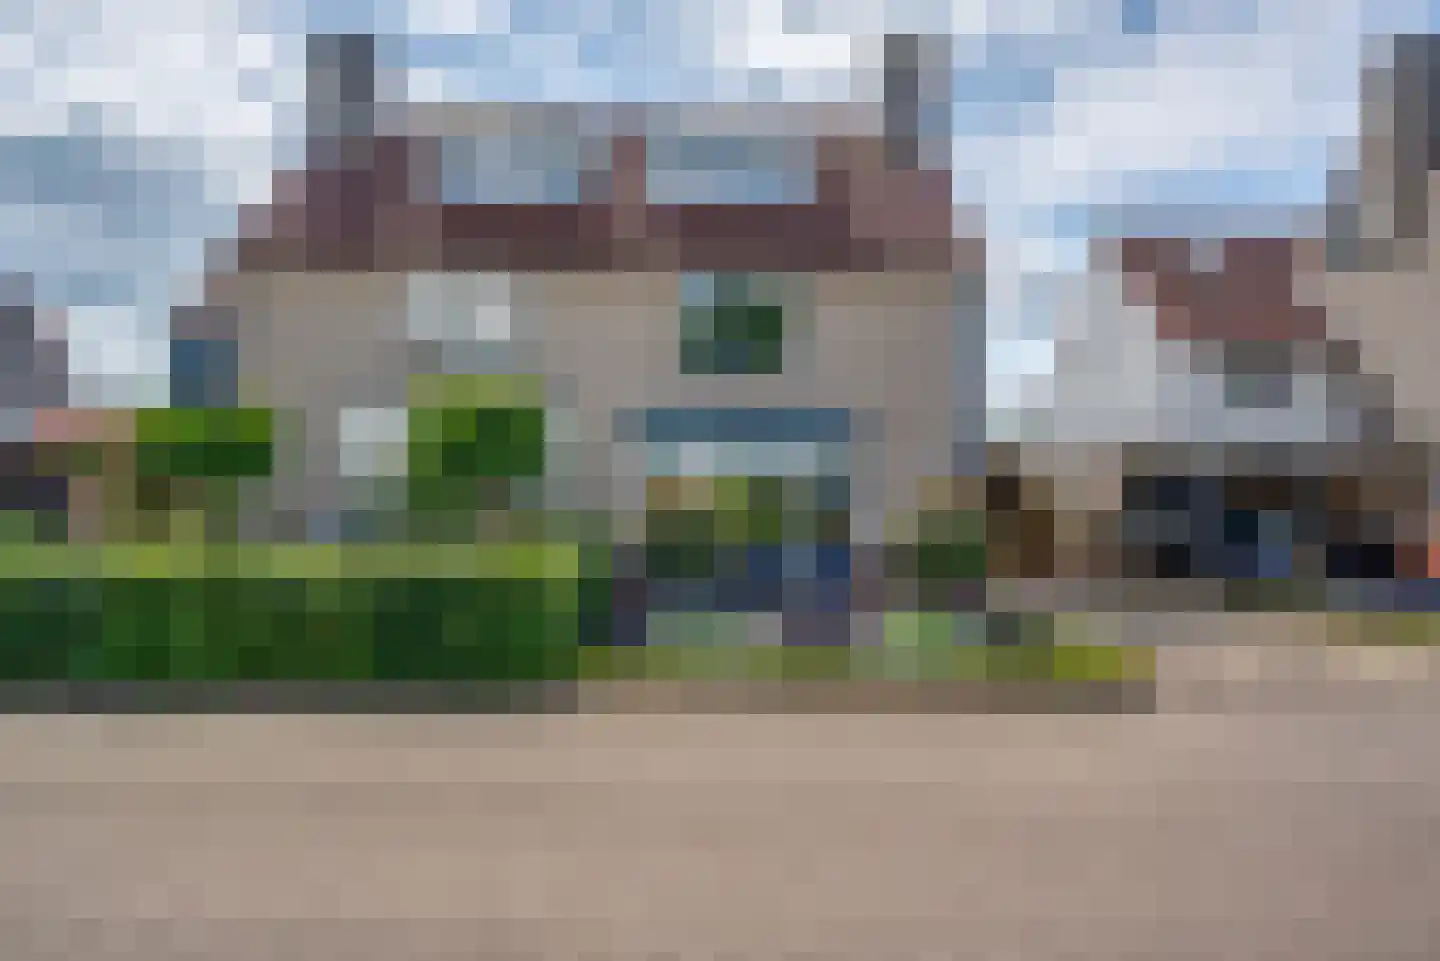
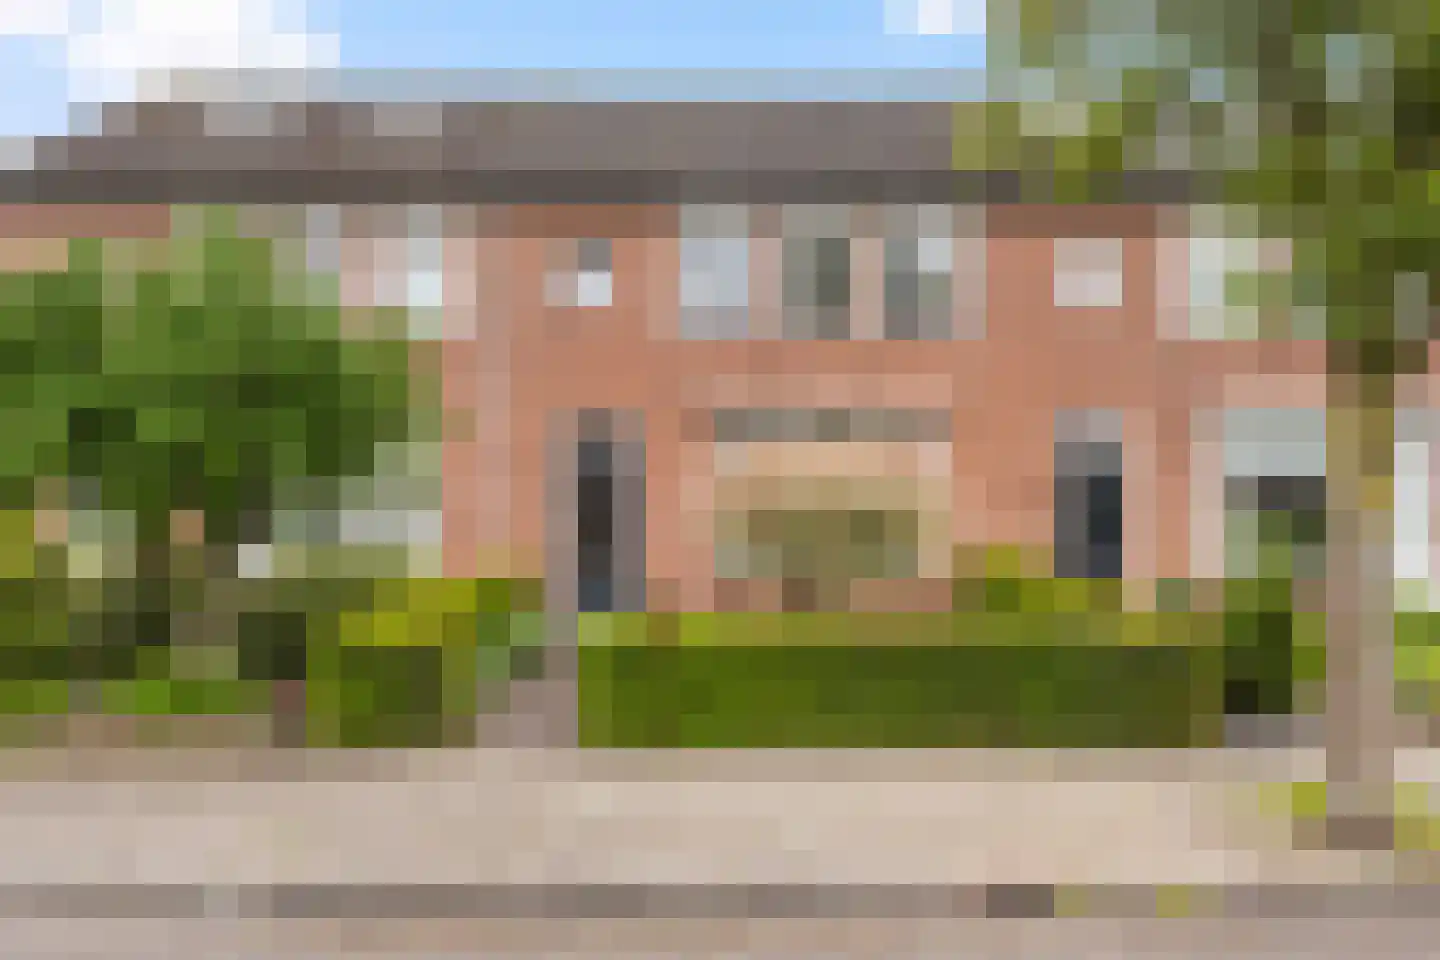
RUIMTE, LICHT EN COMFORT OP EEN RUSTIGE PLEK IN HASSELT Aan de Rietsnit 10 in Hasselt staat deze goed onderhouden twee-onder-één-kapwoning met een verrassend ruime indeling en een eigen oprit. De woning is over de volle breedte uitgebouwd en beschikt over een serre, een opbouw boven de berging en maar liefst vier volwaardige slaapkamers. Een fijne plek voor wie rustig wil wonen, met alle dagelijkse voorzieningen en Zwolle op korte afstand. WONEN IN HASSELT, MET DE STAD DICHTBIJ Hasselt biedt een mooie balans tussen rust en levendigheid. Je woont hier in een sfeervolle omgeving met een historische binnenstad, terwijl Zwolle op slechts enkele minuten afstand ligt. Ook de A28 is goed bereikbaar, wat deze locatie praktisch maakt voor woon-werkverkeer. In de directe omgeving vind je winkels, basisscholen en sportverenigingen. Daarnaast nodigt de omgeving uit tot wandelen, fietsen of een tocht op het water. RUSTIGE LIGGING IN EEN KINDVRIENDELIJKE WIJK De woning ligt aan een brede straat aan het begin van de wijk, dichtbij een speeltuin en een basisschool. De wijk is ruim opgezet en kindvriendelijk, waardoor het een prettige plek is voor gezinnen. Hier woon je rustig, met alles wat je nodig hebt binnen handbereik. BEGANE GROND – LICHT EN LEEFRUIMTE Via de hal met toiletruimte, meterkast en trapopgang kom je in de leefruimte. Aan de voorzijde bevindt zich de keuken, die in 2019 is vernieuwd en is voorzien van onder andere een granieten werkblad, een Stoves fornuis met drie ovens en inductiekookplaat, een Siemens vaatwasser en een koelkast. De huidige eigenaren hebben extra ramen in de zij- en voorgevel laten plaatsen, wat zorgt voor veel lichtinval. De uitgebouwde woonkamer ligt aan de achterzijde en voelt ruim en licht aan door de lichtkoepels in het dak, de grote glaspui en de schuifpui naar de serre, van waaruit je doorloopt naar de tuin. De PVC-vloer met vloerverwarming zorgt voor een comfortabel geheel en de pelletkachel vormt een sfeervolle aanvulling, die desgewenst kan worden overgenomen. De serre vormt een mooi verlengstuk van de woonkamer. Aansluitend vind je de bijkeuken met wasmachineaansluiting, een deur naar de tuin en toegang tot de aangebouwde berging. Vanuit de berging bereik je de oprit met overkapping. Heb je een elektrische auto, dan is het goed om te weten dat er een laadpaal aanwezig is die overgenomen kan worden. EERSTE VERDIEPING – DRIE SLAAPKAMERS EN EEN RUIME OPBOUW Op de eerste verdieping zijn drie slaapkamers aanwezig. De slaapkamer aan de voorzijde beslaat de volledige breedte van de woning, net als een van de kamers aan de achterzijde. De opbouw boven de berging zorgt voor extra ruimte en biedt een royale slaapkamer met airco, een dakkapel aan de voorzijde en een dakraam en deur met raam aan de achterzijde. De badkamer is in 2016 vernieuwd en beschikt over een douche, wastafelmeubel, tweede toilet, vloerverwarming en een raam voor daglicht en ventilatie. TWEEDE VERDIEPING – EXTRA SLAAPKAMER EN BERGRUIMTE Via een vaste trap bereik je de tweede verdieping. Hier vind je de voorzolder met de cv-opstelling en mechanische ventilatie. Daarnaast is er een ruime vierde slaapkamer met dakkapel, zijraam en praktische bergruimte achter de knieschotten. TUIN – GENIETEN VAN BUITEN, HET HELE JAAR DOOR De achtertuin ligt op het noordoosten en is verzorgd aangelegd. Je vindt hier zowel zon- als schaduwplekken. De glazen serre met schuifdeuren maakt het mogelijk om al vroeg in het jaar van het buitenleven te genieten en vormt een fijne overgang tussen binnen en buiten. BIJZONDERHEDEN Twee-onder-één-kapwoning met uitbouw, serre en opbouw Vier ruime slaapkamers Keuken vernieuwd in 2019 Badkamer vernieuwd in 2016 13 zonnepanelen en energielabel B Extra vloerisolatie aangebracht in 2020 Cv-ketel (ATAG, 2016) Oprit met overkapping Rustige ligging nabij Zwolle en uitvalswegen
€ 475.000
Cost of copper (estimated): € 11.350
2% transfer tax (€ 9.500) + notary (€ 1.150) + valuation (€ 700)
Total purchase (incl. p.p.): € 486.350
3,21%
Yearly
€ 23.750
Direct available
Estimated mortgage
Indicative gross monthly cost
Based on annuity and 30 year term
Indicative net monthly cost
iDisclaimer: this mortgage calculation is a simplified indication based on general assumptions. No rights can be derived from the results shown. Calculated with 10-annual interest (zonder NHG), automatically determined based on the price limit € 470.000. Source: 10-jaars rente uit mortgage_rates (08-06-2026 03:45). For non-NHG, an 80% mortgage of the market value has been used in this indication.
Douche, toilet, en wastafelmeubel
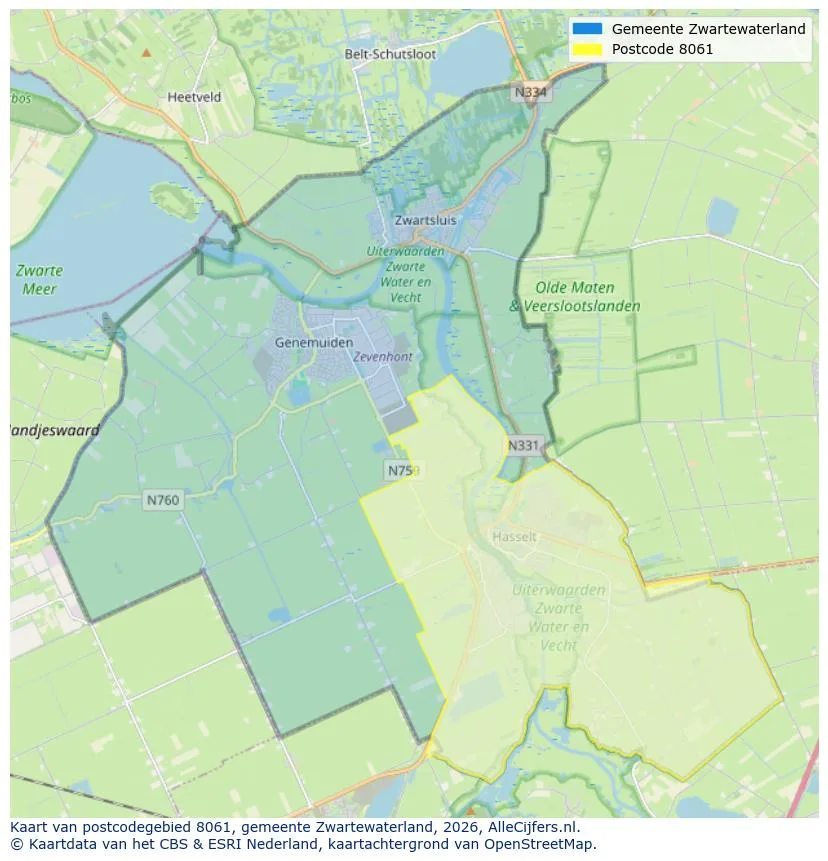
Spatial overview of the work area in Hasselt
View current location data on residents, WOZ development, housing stock, energy consumption, business activity and safety in Hasselt. In 2026 were there 7.972 residents. The average WOZ value in 2025 is EUR 338.830.
Residents
7.972
Last year: 2026
Average WOZ
EUR 338.830
Last year: 2025
Average income per person.
EUR 28.694
Source: AllNumbers
Crimes (current year)
117
Total registered
| Year | Residents |
|---|---|
| 2021 | 7.380 |
| 2022 | 7.520 |
| 2023 | 7.735 |
| 2024 | 7.775 |
| 2025 | 7.840 |
| 2026 | 7.972 |
| Year | Average WOZ |
|---|---|
| 2021 | EUR 236.693 |
| 2022 | EUR 264.025 |
| 2023 | EUR 300.626 |
| 2024 | EUR 319.504 |
| 2025 | EUR 338.830 |
Hoger
1.390
Praktisch
1.580
Middelbaar
2.730
Europa
305
Nederland
7.055
Buiten Europa
480
Label C
993
Label A
686
Label B
533
Label D
220
Label F
207
Label G
178
Label A+++
94
Label E
87
Label A+
87
Label A++++
65
Label A++
57
Label A+++++
1
| Year | Gas (m3) | Electricity (kWh) |
|---|---|---|
| 2020 | 1.235 | 2.858 |
| 2021 | 1.401 | 2.966 |
| 2022 | 1.081 | 2.818 |
| 2023 | 883 | 2.693 |
| 2024 | 845 | 2.778 |
Hoekwoning
Gas: 874 • Electricity: 2.453
Huurwoning
Gas: 794 • Electricity: 2.117
Koopwoning
Gas: 918 • Electricity: 2.890
Appartement
Gas: 547 • Electricity: 1.970
Tussenwoning
Gas: 743 • Electricity: 2.200
Vrijstaande woning
Gas: 1.135 • Electricity: 3.689
Twee-onder-één-kap woning
Gas: 982 • Electricity: 2.953
Total number of company establishments: 820
| Period | Crimes |
|---|---|
| jan 2026 | 8 |
| jul 2025 | 11 |
| jun 2025 | 11 |
| mei 2025 | 9 |
| mrt 2025 | 7 |
| mrt 2026 | 12 |
| nov 2024 | 14 |
| nov 2025 | 10 |
| okt 2024 | 10 |
| okt 2025 | 7 |
| sep 2024 | 17 |
| sep 2025 | 13 |
These figures give an indicative picture of safety trends in the living environment of Hasselt.
Short answers based on current local statistics, handy for a quick comparison of the living environment.
Hasselt telt in 2026 ongeveer 7.972 inwoners.
De gemiddelde WOZ-waarde in Hasselt is in 2025 circa € 338.830.
Het gemiddelde inkomen per inwoner in Hasselt ligt rond € 28.694 per jaar.
Voor het huidige jaar gaat het om ongeveer 117 geregistreerde misdrijven. Gebruik deze cijfers als indicatie en vergelijk trends per periode.
In Hasselt komt vooral "Tussenwoningen" veel voor, met ongeveer 1.208 woningen.
View more homes in this location.
8061MG Hasselt
€ 485.000 k.k.
€ 4.110/m²

8061BR Hasselt
€ 525.000 k.k.
€ 5.198/m²
8061AV Hasselt
€ 345.000 k.k.
€ 2.899/m²

8061RB Hasselt
€ 1.200 p/m
€ 5/m²

8061DG Hasselt
€ 489.000 k.k.
€ 4.008/m²
8061BJ Hasselt
€ 305.000 k.k.
€ 2.163/m²

8061RV Hasselt
€ 1.100.000 k.k.
€ 3.179/m²

8061GK Hasselt
€ 350.000 k.k.
€ 3.535/m²
