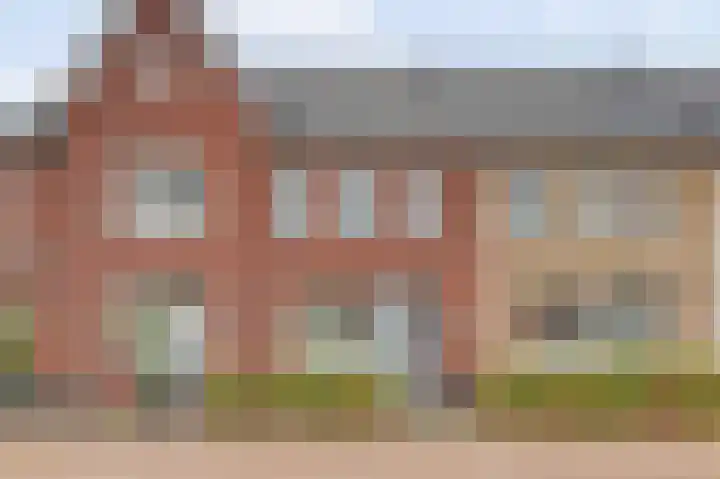
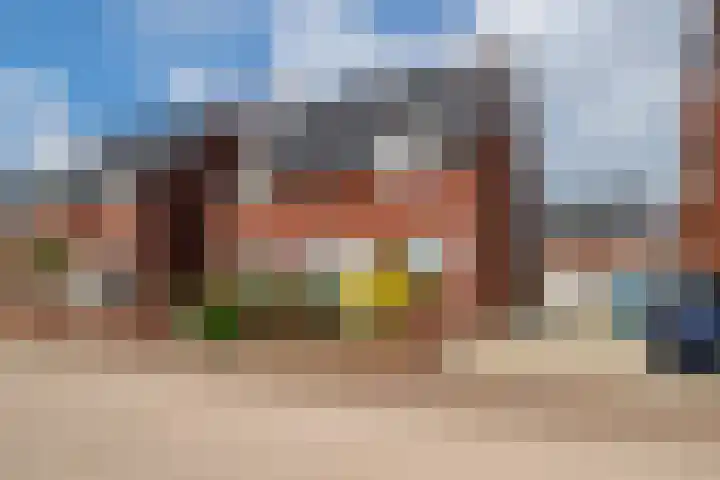
- Sold
Boutlaan 38
4171DE Herwijnen
€ 450.000 k.k.
€ 5.555/m²
- Living area
- 81 m²
- Land area
- —
- Bedrooms
- 2
View 20 sold houses in Herwijnen
Type to search. Use arrow down and arrow up to navigate through results and press Enter to open.
Hidden search suggestions.
Compare sold homes in Herwijnen or view the current offering in this location directly.
On this page you will find recently sold homes in Herwijnen. Use this overview to better estimate selling prices, popular neighborhoods, and the local housing supply before you choose a real estate agent. Also view the current housing supply with 23 houses in Herwijnen.
4171DE Herwijnen
€ 450.000 k.k.
€ 5.555/m²
4171LJ Herwijnen
€ 1.075.000 k.k.
€ 5.657/m²
4171DA Herwijnen
€ 525.000 k.k.
€ 4.375/m²
4171BP Herwijnen
€ 310.000 k.k.
€ 3.647/m²
4171CG Herwijnen
€ 345.000 k.k.
€ 2.827/m²
4171AS Herwijnen
€ 305.000 k.k.
€ 3.719/m²
4171AG Herwijnen
€ 565.000 k.k.
€ 4.448/m²
4171KE Herwijnen
€ 750.000 k.k.
€ 5.281/m²
4171DA Herwijnen
€ 439.000 k.k.
€ 3.990/m²
4171CX Herwijnen
Price upon request
4171BV Herwijnen
€ 489.000 k.k.
€ 3.943/m²
4171AK Herwijnen
€ 350.000 k.k.
€ 4.117/m²
4171CT Herwijnen
€ 375.000 k.k.
€ 4.310/m²
4171AB Herwijnen
€ 590.000 k.k.
€ 2.694/m²
4171DK Herwijnen
€ 665.000 k.k.
€ 4.208/m²
4171CB Herwijnen
€ 685.000 k.k.
€ 3.044/m²
4171AR Herwijnen
€ 415.000 k.k.
€ 3.267/m²
4171AB Herwijnen
€ 500.000 k.k.
€ 3.816/m²
4171DA Herwijnen
€ 438.000 k.k.
€ 5.407/m²
4171CB Herwijnen
€ 515.000 k.k.
€ 4.557/m²
Bekijk recente verkopen en ontvang gratis offertes van lokale verkoopmakelaars in Herwijnen.
Zelf je woning verkopen in Herwijnen? Vergelijk verkoopmakelaars in Herwijnen of bekijk de beste verkoopmakelaars in Herwijnen als referentie bij jouw keuze.
Makelaars maken scherpere voorstellen als ze weten dat je vergelijkt — vraag offertes aan voor verkoop of aankoop.
Short answers about housing prices, sold homes and comparing real estate agents in Herwijnen.
The costs of a real estate agent in Herwijnen vary per office, property type and sales approach. Therefore, compare multiple quotes and also look at the real estate agents in Herwijnen to better compare rates, presentation and local experience.
On this page we currently show 20 sold houses in Herwijnen from our selection. This helps you to better assess recent transactions and the local housing market.
Houses sold in Herwijnen give insight into asking prices, house types and neighborhoods where recent transactions have taken place. Compare this also with the current housing stock in Herwijnen to better understand the market.
You can use sold homes as a first market indication, but a local real estate agent can better take into account finishing, location, maintenance and current demand in Herwijnen.
Vergelijk makelaars in Herwijnen op lokale verkoopervaring, reviews, verwachte opbrengst, courtage en marketingaanpak. Bekijk verkoopmakelaars in Herwijnen of de top 10 makelaars in Herwijnen om snel sterke kantoren te ontdekken.
View current location data on residents, WOZ development, housing stock, energy consumption, business activity and safety in Herwijnen. In 2025 were there 2.850 residents. The average WOZ value in 2025 is EUR 456.000.
These figures help to better assess and compare the housing stock in Herwijnen with recent sold homes. Orient yourself then on suitable top real estate agents in Herwijnen for sales advice in this region.
Residents
2.850
Last year: 2025
Average WOZ
EUR 456.000
Last year: 2025
Average income per person.
EUR 35.400
Source: AllNumbers
Crimes (current year)
57
Total registered
| Year | Residents |
|---|---|
| 2021 | 2.750 |
| 2022 | 2.790 |
| 2023 | 2.810 |
| 2024 | 2.820 |
| 2025 | 2.850 |
| Year | Average WOZ |
|---|---|
| 2021 | EUR 317.000 |
| 2022 | EUR 346.000 |
| 2023 | EUR 404.000 |
| 2024 | EUR 422.000 |
| 2025 | EUR 456.000 |
Hoger
420
Praktisch
570
Middelbaar
1.050
Europa
110
Nederland
2.585
Buiten Europa
150
Label A
264
Label C
248
Label B
183
Label G
150
Label D
115
Label A++++
69
Label F
58
Label A+++
29
Label E
17
Label A+
13
Label A++
2
Label A+++++
0
| Year | Gas (m3) | Electricity (kWh) |
|---|---|---|
| 2020 | 1.390 | 3.410 |
| 2021 | 1.530 | 3.420 |
| 2022 | 1.140 | 3.190 |
| 2023 | 950 | 3.010 |
| 2024 | 930 | 3.140 |
Hoekwoning
Gas: 780 • Electricity: 2.660
Huurwoning
Gas: 730 • Electricity: 2.050
Koopwoning
Gas: 1.050 • Electricity: 3.480
Appartement
Gas: 600 • Electricity: 1.650
Tussenwoning
Gas: 700 • Electricity: 2.460
Vrijstaande woning
Gas: 1.310 • Electricity: 4.000
Twee-onder-één-kap woning
Gas: 1.000 • Electricity: 3.240
Total number of company establishments: 415
| Period | Crimes |
|---|---|
| jan 2026 | 3 |
| jul 2025 | 6 |
| jun 2025 | 2 |
| mei 2025 | 7 |
| mrt 2025 | 10 |
| mrt 2026 | 1 |
| nov 2024 | 3 |
| nov 2025 | 1 |
| okt 2024 | 7 |
| okt 2025 | 5 |
| sep 2024 | 7 |
| sep 2025 | 1 |
These figures give an indicative picture of safety trends in the living environment of Herwijnen.
Short answers based on current local statistics, handy for a quick comparison of the living environment.
Herwijnen telt in 2025 ongeveer 2.850 inwoners.
De gemiddelde WOZ-waarde in Herwijnen is in 2025 circa € 456.000.
Het gemiddelde inkomen per inwoner in Herwijnen ligt rond € 35.400 per jaar.
Voor het huidige jaar gaat het om ongeveer 57 geregistreerde misdrijven. Gebruik deze cijfers als indicatie en vergelijk trends per periode.
In Herwijnen komt vooral "Vrijstaande woningen" veel voor, met ongeveer 388 woningen.