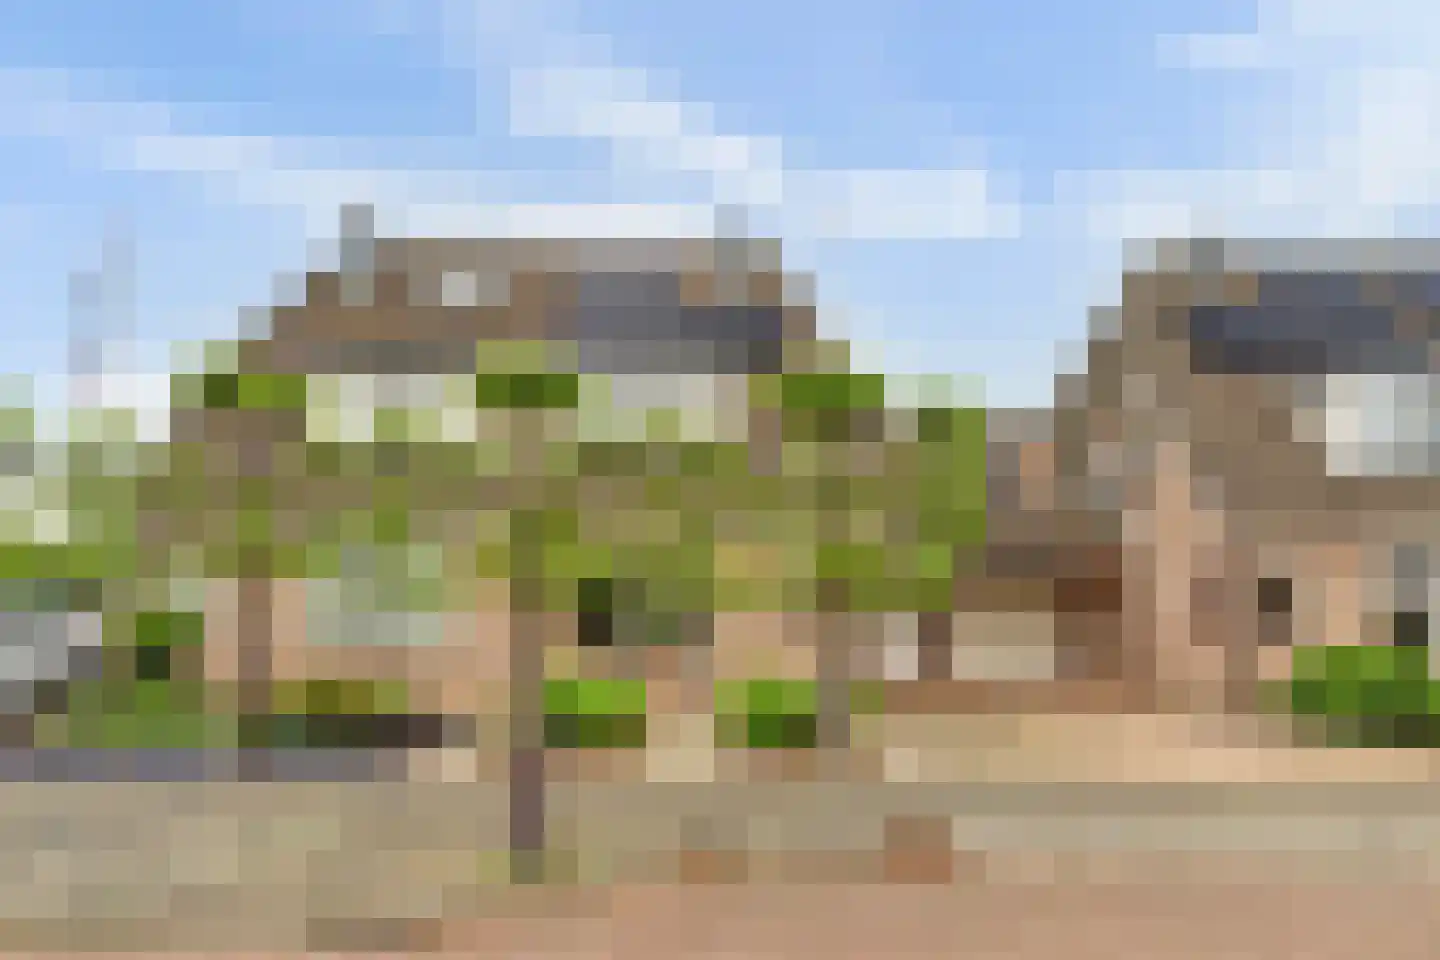
- Available
Waaldijk 38
4171CE Herwijnen
€ 849.000 k.k.
€ 5.979/m²
- Living area
- 142 m²
- Land area
- 3000 m²
- Bedrooms
- 4
Searching in 26 houses in Herwijnen
Type to search. Use arrow down and arrow up to navigate through results and press Enter to open.
Hidden search suggestions.
View current properties in Herwijnen or search targeted on street, postal code and property characteristics.
View the current housing stock in Herwijnen and quickly filter by price, living area, rooms and more. There are currently 26 houses in this place within our selection. View also 19 sold houses in Herwijnen for extra insight into the local housing market.
4171CE Herwijnen
€ 849.000 k.k.
€ 5.979/m²
4171CA Herwijnen
€ 795.000 k.k.
€ 6.411/m²
4171CV Herwijnen
€ 775.000 k.k.
€ 5.871/m²
4171CE Herwijnen
€ 895.000 k.k.
€ 1.689/m²
4171BR Herwijnen
€ 500.000 k.k.
€ 3.937/m²
4171DA Herwijnen
€ 485.000 k.k.
€ 4.254/m²
4171DE Herwijnen
€ 450.000 k.k.
€ 5.555/m²
4171LJ Herwijnen
€ 1.075.000 k.k.
€ 5.657/m²
4171DA Herwijnen
€ 525.000 k.k.
€ 4.375/m²
4171BP Herwijnen
€ 310.000 k.k.
€ 3.647/m²
4171CG Herwijnen
€ 345.000 k.k.
€ 2.827/m²
4171AS Herwijnen
€ 305.000 k.k.
€ 3.719/m²
4171AG Herwijnen
€ 565.000 k.k.
€ 4.448/m²
4171KE Herwijnen
€ 750.000 k.k.
€ 5.281/m²
4171DA Herwijnen
€ 439.000 k.k.
€ 3.990/m²
4171CX Herwijnen
Price upon request
4171BV Herwijnen
€ 489.000 k.k.
€ 3.943/m²
4171AK Herwijnen
€ 350.000 k.k.
€ 4.117/m²
4171CT Herwijnen
€ 375.000 k.k.
€ 4.310/m²
4171AB Herwijnen
€ 590.000 k.k.
€ 2.694/m²
4171DK Herwijnen
€ 665.000 k.k.
€ 4.208/m²
4171CB Herwijnen
€ 685.000 k.k.
€ 3.044/m²
4171AR Herwijnen
€ 415.000 k.k.
€ 3.267/m²
4171BL Herwijnen
€ 1.250.000 k.k.
€ 4.139/m²
4171AB Herwijnen
€ 500.000 k.k.
€ 3.816/m²
4171DA Herwijnen
€ 438.000 k.k.
€ 5.407/m²
Get free quotes from real estate agents with local market knowledge. Compare more than 36 real estate agents in Herwijnen.
Selling a home in Herwijnen? Compare all real estate agents in Herwijnen or view the top 10 real estate agents in Herwijnen for extra context for your choice.
Real estate agents make sharper offers when they know you're comparing — ask for quotes for sale or purchase.
Practical answers about housing supply, sales and comparing real estate agents in Herwijnen.
The costs of a real estate agent in Herwijnen depend on commission, setup costs, property presentation and the chosen service. Compare the 36 real estate agents in Herwijnen via the real estate agent page and request multiple quotes to compare rates and approach well.
Within our selection, we are currently showing 26 houses in Herwijnen. View also the sold houses in Herwijnen to compare the current offering with recent transactions.
Take into account not only price and living area but also maintenance, energy label, location, outdoor space and sales status. This way you compare houses in Herwijnen on more than just the asking price.
A local real estate agent knows the neighborhoods, recent transactions and demand in Herwijnen. By comparing 36 real estate agents in the region you get a better insight into prices, sales strategy and expected yield; the top 10 in Herwijnen provides a useful starting point.
Yes, when making a sales plan, a valuation in Herwijnen is wise. You gain insight into a realistic asking price and can then compare offers from real estate agents specifically.
View current location data on residents, WOZ development, housing stock, energy consumption, business activity and safety in Herwijnen. In 2025 were there 2.850 residents. The average WOZ value in 2025 is EUR 456.000.
These figures help to better assess and compare the housing stock in Herwijnen with recent sold homes. Orient yourself then on suitable top real estate agents in Herwijnen for sales advice in this region.
Residents
2.850
Last year: 2025
Average WOZ
EUR 456.000
Last year: 2025
Average income per person.
EUR 35.400
Source: AllNumbers
Crimes (current year)
57
Total registered
| Year | Residents |
|---|---|
| 2021 | 2.750 |
| 2022 | 2.790 |
| 2023 | 2.810 |
| 2024 | 2.820 |
| 2025 | 2.850 |
| Year | Average WOZ |
|---|---|
| 2021 | EUR 317.000 |
| 2022 | EUR 346.000 |
| 2023 | EUR 404.000 |
| 2024 | EUR 422.000 |
| 2025 | EUR 456.000 |
Hoger
420
Praktisch
570
Middelbaar
1.050
Europa
110
Nederland
2.585
Buiten Europa
150
Label A
264
Label C
248
Label B
183
Label G
150
Label D
115
Label A++++
69
Label F
58
Label A+++
29
Label E
17
Label A+
13
Label A++
2
Label A+++++
0
| Year | Gas (m3) | Electricity (kWh) |
|---|---|---|
| 2020 | 1.390 | 3.410 |
| 2021 | 1.530 | 3.420 |
| 2022 | 1.140 | 3.190 |
| 2023 | 950 | 3.010 |
| 2024 | 930 | 3.140 |
Hoekwoning
Gas: 780 • Electricity: 2.660
Huurwoning
Gas: 730 • Electricity: 2.050
Koopwoning
Gas: 1.050 • Electricity: 3.480
Appartement
Gas: 600 • Electricity: 1.650
Tussenwoning
Gas: 700 • Electricity: 2.460
Vrijstaande woning
Gas: 1.310 • Electricity: 4.000
Twee-onder-één-kap woning
Gas: 1.000 • Electricity: 3.240
Total number of company establishments: 415
| Period | Crimes |
|---|---|
| jan 2026 | 3 |
| jul 2025 | 6 |
| jun 2025 | 2 |
| mei 2025 | 7 |
| mrt 2025 | 10 |
| mrt 2026 | 1 |
| nov 2024 | 3 |
| nov 2025 | 1 |
| okt 2024 | 7 |
| okt 2025 | 5 |
| sep 2024 | 7 |
| sep 2025 | 1 |
These figures give an indicative picture of safety trends in the living environment of Herwijnen.
Short answers based on current local statistics, handy for a quick comparison of the living environment.
Herwijnen telt in 2025 ongeveer 2.850 inwoners.
De gemiddelde WOZ-waarde in Herwijnen is in 2025 circa € 456.000.
Het gemiddelde inkomen per inwoner in Herwijnen ligt rond € 35.400 per jaar.
Voor het huidige jaar gaat het om ongeveer 57 geregistreerde misdrijven. Gebruik deze cijfers als indicatie en vergelijk trends per periode.
In Herwijnen komt vooral "Vrijstaande woningen" veel voor, met ongeveer 388 woningen.