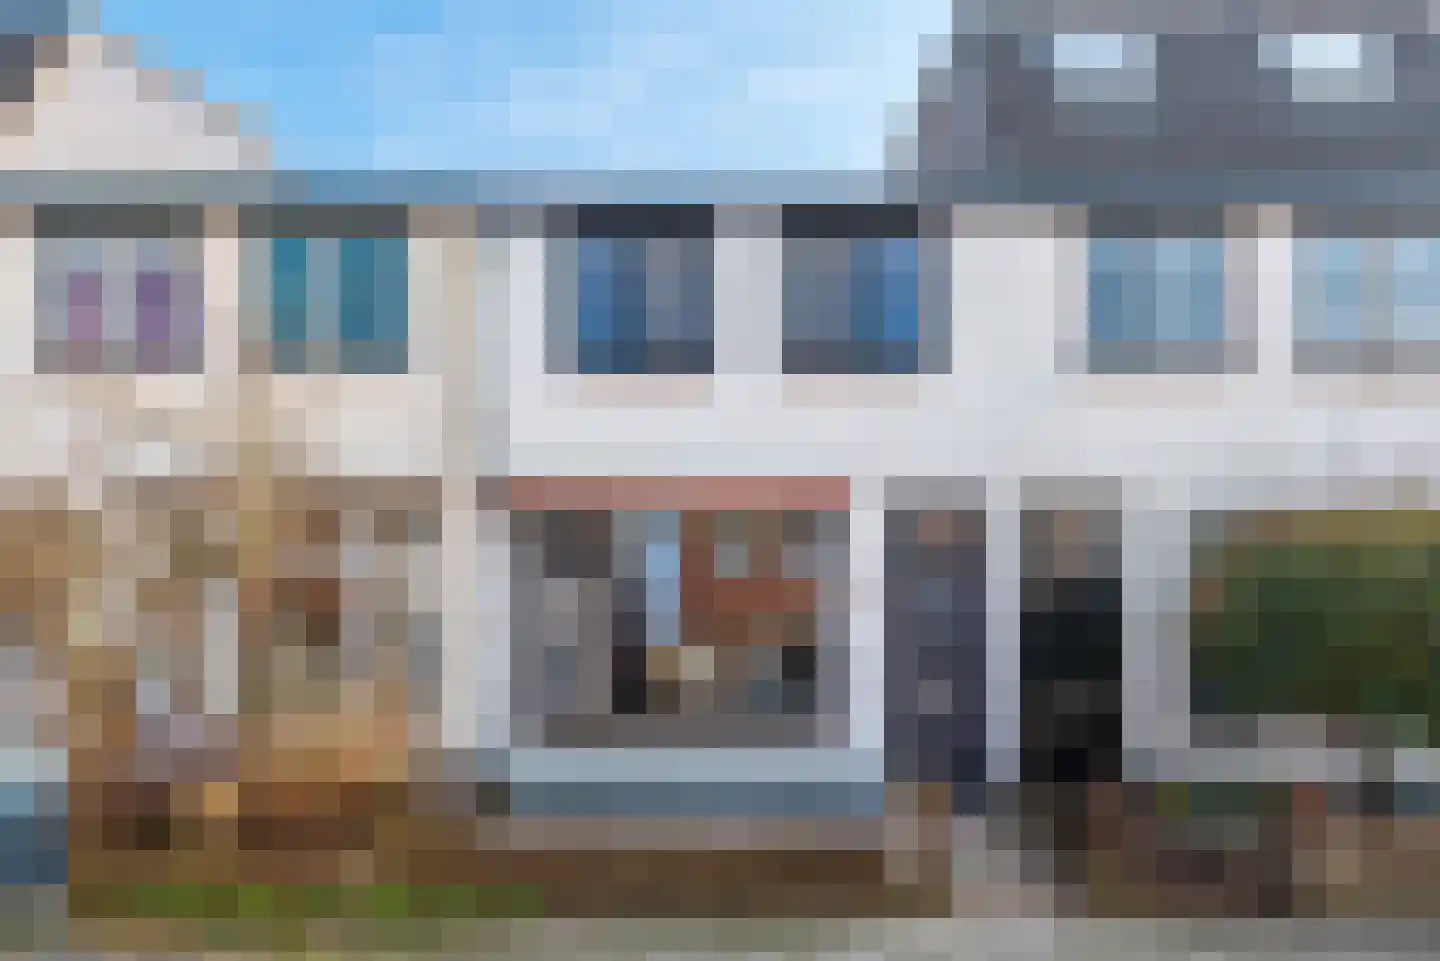
- Available
Stationsstraat 58
1211EP Hilversum
€ 350.000 k.k.
€ 4.118/m²
- Living area
- 85 m²
- Land area
- —
- Bedrooms
- 1
Searching in 1.442 houses in Hilversum
Type to search. Use arrow down and arrow up to navigate through results and press Enter to open.
Hidden search suggestions.
View current properties in Hilversum or search targeted on street, postal code and property characteristics.
View the current housing stock in Hilversum and quickly filter by price, living area, rooms and more. There are currently 1.442 houses in this place within our selection. View also 970 sold houses in Hilversum for extra insight into the local housing market.
1211EP Hilversum
€ 350.000 k.k.
€ 4.118/m²
1213BL Hilversum
€ 695.000 k.k.
€ 5.560/m²
1221CL Hilversum
€ 898.000 k.k.
€ 5.161/m²
1222KA Hilversum
€ 395.000 k.k.
€ 4.247/m²
1216AB Hilversum
€ 690.000 k.k.
€ 4.600/m²
1211LH Hilversum
€ 550.000 k.k.
€ 5.238/m²
1214BB Hilversum
€ 775.000 k.k.
€ 6.301/m²
1223DK Hilversum
€ 425.000 k.k.
€ 5.592/m²
1214AR Hilversum
€ 470.000 k.k.
€ 6.267/m²
1222PE Hilversum
€ 299.000 k.k.
1222PE Hilversum
€ 110.000 k.k.
1217SR Hilversum
€ 310.000 k.k.
€ 4.133/m²
1212AD Hilversum
€ 350.000 k.k.
€ 5.385/m²
1223NZ Hilversum
€ 469.500 k.k.
€ 5.103/m²
1217BJ Hilversum
€ 550.000 k.k.
€ 5.238/m²
1214JA Hilversum
€ 450.000 k.k.
€ 6.618/m²
1217RP Hilversum
€ 2.685.000 k.k.
€ 9.555/m²
1211LV Hilversum
€ 14.500 k.k.
1215RB Hilversum
€ 37.500 k.k.
1213LR Hilversum
€ 495.000 k.k.
€ 5.824/m²
1217SZ Hilversum
€ 310.000 k.k.
€ 4.844/m²
1213TH Hilversum
€ 1.795.000 k.k.
€ 4.918/m²
1216EN Hilversum
€ 325.000 k.k.
€ 5.702/m²
1215PV Hilversum
€ 379.500 k.k.
€ 4.312/m²
1222KP Hilversum
€ 325.000 k.k.
€ 5.508/m²
1217DM Hilversum
€ 695.000 k.k.
€ 6.950/m²
1217BM Hilversum
€ 985.000 k.k.
€ 4.301/m²
1211GK Hilversum
€ 329.000 k.k.
€ 5.672/m²
Get free quotes from real estate agents with local market knowledge. Compare more than 154 real estate agents in Hilversum.
Selling a home in Hilversum? View the sales-oriented guide sell a house in Hilversum, compare all real estate agents in Hilversum or view the top 10 real estate agents in Hilversum for extra context to your choice.
Real estate agents make sharper offers when they know you're comparing — ask for quotes for sale or purchase.
Practical answers about housing supply, sales and comparing real estate agents in Hilversum.
The costs of a real estate agent in Hilversum depend on commission, setup costs, property presentation and the chosen service. Compare the 154 real estate agents in Hilversum via the real estate agent page and request multiple quotes to compare rates and approach well.
Within our selection, we are currently showing 1.442 houses in Hilversum. View also the sold houses in Hilversum to compare the current offering with recent transactions.
Take into account not only price and living area but also maintenance, energy label, location, outdoor space and sales status. This way you compare houses in Hilversum on more than just the asking price.
A local real estate agent knows the neighborhoods, recent transactions and demand in Hilversum. By comparing 154 real estate agents in the region you get a better insight into prices, sales strategy and expected yield; the top 10 in Hilversum provides a useful starting point.
Yes, when making a sales plan, a valuation in Hilversum is wise. You gain insight into a realistic asking price and can then compare offers from real estate agents specifically.
View current location data on residents, WOZ development, housing stock, energy consumption, business activity and safety in Hilversum. In 2026 were there 94.601 residents. The average WOZ value in 2025 is EUR 477.000.
These figures help to better assess and compare the housing stock in Hilversum with recent sold homes. Orient yourself then on suitable top real estate agents in Hilversum for sales advice in this region.
Residents
94.601
Last year: 2026
Average WOZ
EUR 477.000
Last year: 2025
Average income per person.
EUR 39.700
Source: AllNumbers
Crimes (current year)
4.114
Total registered
| Year | Residents |
|---|---|
| 2022 | 91.733 |
| 2023 | 93.345 |
| 2024 | 94.435 |
| 2025 | 94.393 |
| 2026 | 94.601 |
| Year | Average WOZ |
|---|---|
| 2021 | EUR 358.000 |
| 2022 | EUR 397.000 |
| 2023 | EUR 451.000 |
| 2024 | EUR 469.000 |
| 2025 | EUR 477.000 |
Hoger
42
Praktisch
23
Middelbaar
35
Europa
11.514
Nederland
61.032
Buiten Europa
21.847
Label A
9.915
Label C
9.056
Label G
6.001
Label F
5.042
Label B
4.716
Label E
4.636
Label D
3.971
Label A+
1.044
Label A++
521
Label A+++
511
Label A++++
76
Label A+++++
5
| Year | Gas (m3) | Electricity (kWh) |
|---|---|---|
| 2020 | 1.240 | 2.620 |
| 2021 | 1.420 | 2.700 |
| 2022 | 1.110 | 2.540 |
| 2023 | 950 | 2.400 |
| 2024 | 920 | 2.450 |
Hoekwoning
Gas: 1.180 • Electricity: 2.790
Huurwoning
Gas: 740 • Electricity: 1.830
Koopwoning
Gas: 1.130 • Electricity: 2.870
Appartement
Gas: 660 • Electricity: 1.750
Tussenwoning
Gas: 940 • Electricity: 2.450
Vrijstaande woning
Gas: 2.180 • Electricity: 4.850
Twee-onder-één-kap woning
Gas: 1.500 • Electricity: 3.700
Total number of company establishments: 16.060
| Period | Crimes |
|---|---|
| jan 2025 | 312 |
| jan 2026 | 357 |
| jul 2025 | 337 |
| jun 2025 | 342 |
| mei 2025 | 355 |
| mrt 2025 | 425 |
| nov 2024 | 398 |
| nov 2025 | 286 |
| okt 2024 | 385 |
| okt 2025 | 320 |
| sep 2024 | 319 |
| sep 2025 | 316 |
These figures give an indicative picture of safety trends in the living environment of Hilversum.
Short answers based on current local statistics, handy for a quick comparison of the living environment.
Hilversum telt in 2026 ongeveer 94.601 inwoners.
De gemiddelde WOZ-waarde in Hilversum is in 2025 circa € 477.000.
Het gemiddelde inkomen per inwoner in Hilversum ligt rond € 39.700 per jaar.
Voor het huidige jaar gaat het om ongeveer 4.114 geregistreerde misdrijven. Gebruik deze cijfers als indicatie en vergelijk trends per periode.
In Hilversum komt vooral "Appartementen" veel voor, met ongeveer 19.575 woningen.