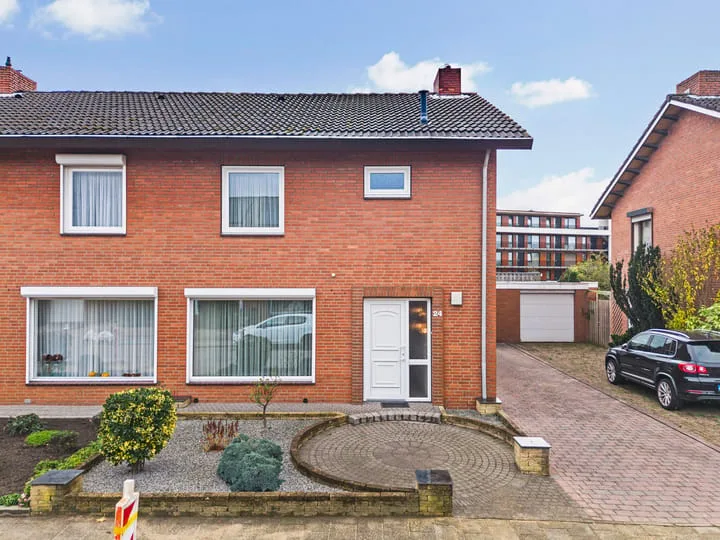
Houses sold in Landgraaf

View 295 sold houses in Landgraaf

Connected to: Vastgoed Nederland NVM Makelaars

On this page you will find recently sold homes in Landgraaf. Use this overview to better estimate selling prices, popular neighborhoods, and the local housing supply before you choose a real estate agent. Also view the current housing supply with 466 houses in Landgraaf.

Selection

Search and filter homes

Set your preferences and discover homes that suit you.

Total supply 240.175
Filters

Set price, area and other characteristics. Adjust a filter or click on Show homes. Location changes directly above.

Reset filters

You search for

  • Place Landgraaf
  • Status Sold

Selling a home in Landgraaf? Compare realtor offers

Get free quotes from realtors with local market knowledge in Landgraaf.

Free request a quote

  • Quotes in Landgraaf
  • Non-binding
  • Personal
  • Free property website

Selling a home in Landgraaf? Compare real estate agents who know the local housing market. Also check out all real estate agents in Landgraaf or the top 10 real estate agents in Landgraaf for extra context for your choice.

Save an average of €5000,-

By comparing brokers and requesting quotes

Frequently asked questions about sold homes in Landgraaf

Short answers about housing prices, sold homes and comparing real estate agents in Landgraaf.

Residential and neighborhood statistics in Landgraaf

View current location data on residents, WOZ development, housing stock, energy consumption, business activity and safety in Landgraaf. In 2026 were there 36.844 residents. The average WOZ value in 2025 is EUR 265.000.

These figures help to better assess and compare the housing stock in Landgraaf with recent sold homes. Orient yourself then on suitable top real estate agents in Landgraaf for sales advice in this region.

Residents

36.844

Last year: 2026

Average WOZ

EUR 265.000

Last year: 2025

Average income per person.

EUR 31.800

Source: AllNumbers

Crimes (current year)

1.375

Total registered

Demographics and WOZ development

Inhabitants per year

Inhabitants per year in Landgraaf
Year Residents
2022 37.023
2023 37.175
2024 37.112
2025 36.839
2026 36.844

Annual WOZ value

WOZ value per year in Landgraaf
Year Average WOZ
2021 EUR 197.000
2022 EUR 212.000
2023 EUR 248.000
2024 EUR 247.000
2025 EUR 265.000

Composition of residents

Age build-up

65+: 10.573 0-15: 4.552 15-25: 3.422 25-45: 8.127 45-65: 10.170

Education level

Hoger

23

Praktisch

34

Middelbaar

43

Origin of residents (2025)

Europa

5.824

Nederland

27.859

Buiten Europa

3.156

Housing stock and construction periods

Types of homes

Hoekwoningen 3.333
Appartementen 4.230
Tussenwoningen 5.704
Vrijstaande woningen 2.148
Twee-onder-één-kap woningen 2.999

Construction period of buildings

Voor 1700 22
1700 tot 1900 151
1900 tot 1925 915
1925 tot 1950 2.024
1950 tot 1970 5.649
1970 tot 1980 2.720
1980 tot 1990 2.130
1990 tot 2000 1.124
2000 tot 2010 734
2010 tot 2020 318
2020 en later 224

Energy and sustainability

Energy label distribution

Label C

4.932

Label A

3.139

Label B

2.575

Label D

2.345

Label F

2.076

Label G

1.573

Label E

1.278

Label A+

371

Label A+++

140

Label A++

120

Label A++++

22

Label A+++++

3

Average energy consumption per year

Average energy consumption per year in Landgraaf
Year Gas (m3) Electricity (kWh)
2020 1.250 2.830
2021 1.430 2.870
2022 1.100 2.740
2023 910 2.660
2024 890 2.710

Consumption per house type

Hoekwoning

Gas: 950 • Electricity: 2.710

Huurwoning

Gas: 760 • Electricity: 2.080

Koopwoning

Gas: 1.000 • Electricity: 3.000

Appartement

Gas: 670 • Electricity: 1.900

Tussenwoning

Gas: 860 • Electricity: 2.630

Vrijstaande woning

Gas: 1.340 • Electricity: 3.890

Twee-onder-één-kap woning

Gas: 1.040 • Electricity: 2.920

Business activity in Landgraaf (2025)

Handel en HORECA 605
Nijverheid en energie 485
Zakelijke dienstverlening 630
Overheid, onderwijs en zorg 620
Landbouw, bosbouw en visserij 30
Vervoer, informatie en communicatie 150
Financiele diensten en onroerendgoed 105
Cultuur, recreatie en overige diensten 465

Total number of company establishments: 3.090

Recent crime statistics

Recent crime statistics in Landgraaf
Period Crimes
jan 2026 120
jul 2025 128
jun 2025 150
mei 2025 124
mrt 2025 114
mrt 2026 106
nov 2024 115
nov 2025 103
okt 2024 107
okt 2025 108
sep 2024 117
sep 2025 104

These figures give an indicative picture of safety trends in the living environment of Landgraaf.

Frequently asked questions about living in Landgraaf

Short answers based on current local statistics, handy for a quick comparison of the living environment.

Hoeveel inwoners heeft Landgraaf?

Landgraaf telt in 2026 ongeveer 36.844 inwoners.

Wat is de gemiddelde WOZ-waarde in Landgraaf?

De gemiddelde WOZ-waarde in Landgraaf is in 2025 circa € 265.000.

Wat is het gemiddelde inkomen per inwoner in Landgraaf?

Het gemiddelde inkomen per inwoner in Landgraaf ligt rond € 31.800 per jaar.

Hoe veilig is wonen in Landgraaf?

Voor het huidige jaar gaat het om ongeveer 1.375 geregistreerde misdrijven. Gebruik deze cijfers als indicatie en vergelijk trends per periode.

Welke woningtypen komen het meest voor in Landgraaf?

In Landgraaf komt vooral "Tussenwoningen" veel voor, met ongeveer 5.704 woningen.