- Sold
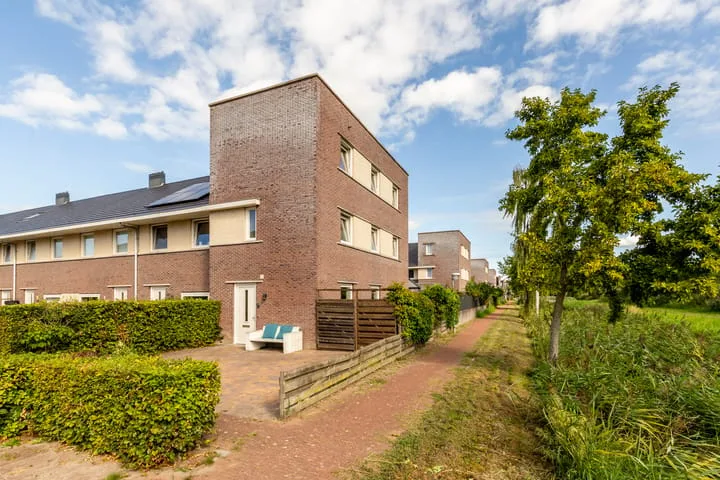
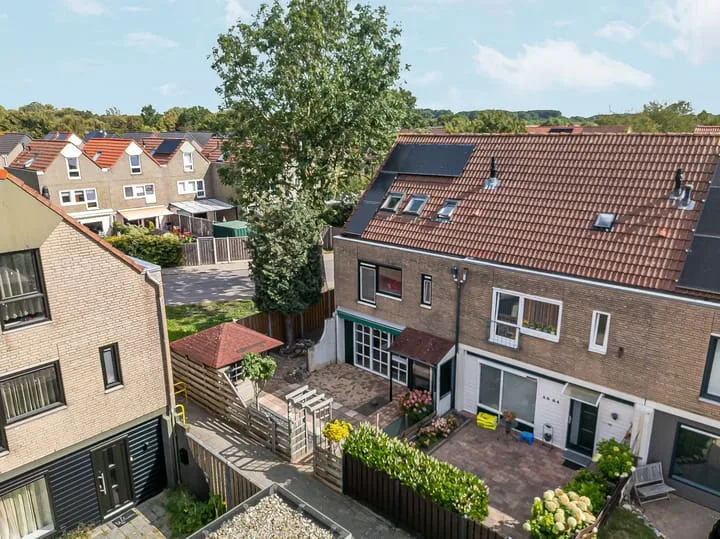
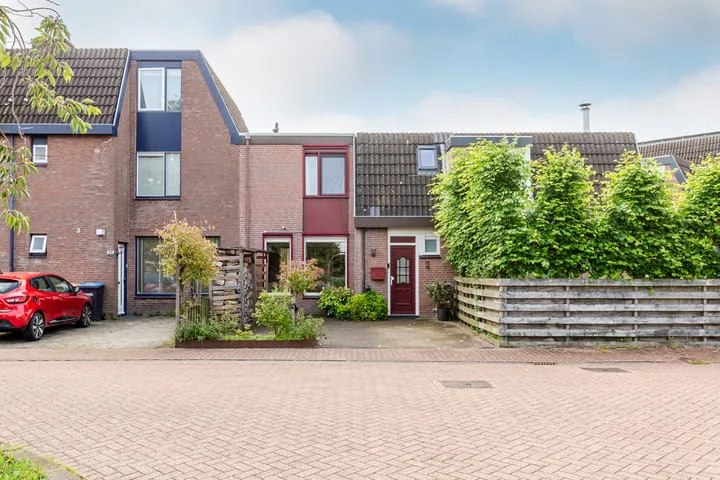
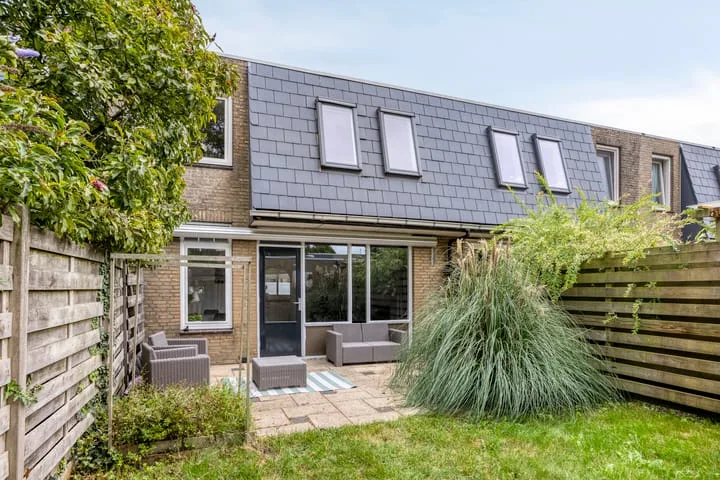
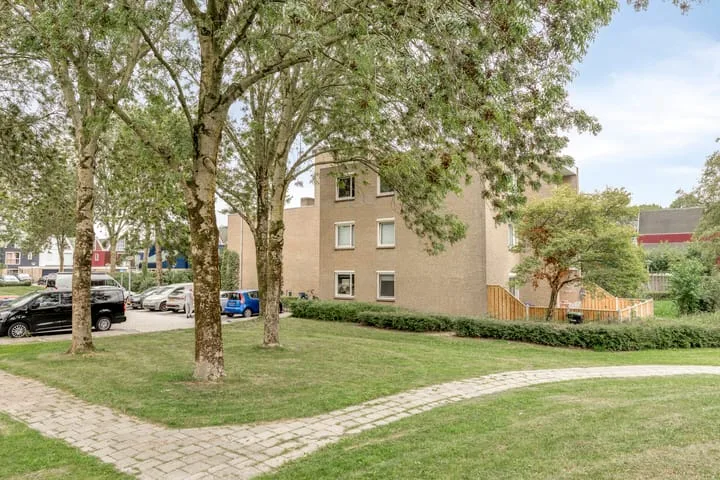
Penningkruidstraat 18
8245JG Lelystad
€ 565.000 k.k.
€ 3.923/m²
- Living area
- 144 m²
- Land area
- 266 m²
- Bedrooms
- 3
View 870 sold houses in Lelystad
Type to search. Use arrow down and arrow up to navigate through results and press Enter to open.
Hidden search suggestions.
Compare sold homes in Lelystad or view the current offering in this location directly.
On this page you will find recently sold homes in Lelystad. Use this overview to better estimate selling prices, popular neighborhoods, and the local housing supply before you choose a real estate agent. Also view the current housing supply with 1.218 houses in Lelystad.
8245JG Lelystad
€ 565.000 k.k.
€ 3.923/m²
8232KK Lelystad
€ 385.000 k.k.
€ 3.208/m²
8224GR Lelystad
€ 389.500 k.k.
€ 2.843/m²
8232RC Lelystad
€ 400.000 k.k.
€ 2.962/m²
8242GA Lelystad
€ 325.000 k.k.
€ 2.826/m²
8225DN Lelystad
€ 310.000 k.k.
€ 2.870/m²
8242WG Lelystad
€ 395.000 k.k.
€ 2.992/m²
8212EJ Lelystad
€ 425.000 k.k.
€ 3.035/m²
8219AT Lelystad
€ 670.000 k.k.
€ 4.135/m²
8242JK Lelystad
€ 475.000 k.k.
€ 3.209/m²
8243ER Lelystad
€ 325.000 k.k.
€ 3.494/m²
8232LP Lelystad
€ 325.000 k.k.
€ 3.651/m²
8243CH Lelystad
€ 375.000 k.k.
€ 3.000/m²
8226RR Lelystad
€ 635.000 k.k.
€ 3.256/m²
8245LA Lelystad
€ 600.000 k.k.
€ 4.137/m²
8223DE Lelystad
€ 350.000 k.k.
€ 3.097/m²
8224GD Lelystad
€ 399.000 k.k.
€ 2.607/m²
8224GX Lelystad
€ 275.000 k.k.
€ 3.928/m²
8243HS Lelystad
€ 250.000 k.k.
€ 4.310/m²
8243EA Lelystad
€ 750.000 k.k.
€ 3.440/m²
8242KB Lelystad
€ 425.000
€ 3.935/m²
8245CM Lelystad
€ 375.000 k.k.
€ 3.989/m²
8245EM Lelystad
€ 465.000 k.k.
€ 4.603/m²
8243KZ Lelystad
€ 425.000 k.k.
€ 3.427/m²
8224CG Lelystad
€ 325.000 k.k.
€ 3.125/m²
8245BS Lelystad
€ 525.000 k.k.
€ 3.365/m²
8225DE Lelystad
€ 350.000 k.k.
€ 3.211/m²
8226DG Lelystad
€ 450.000 k.k.
€ 3.600/m²
Get free quotes from realtors with local market knowledge in Lelystad.
Selling a home in Lelystad? Compare real estate agents who know the local housing market. Also check out all real estate agents in Lelystad or the top 10 real estate agents in Lelystad for extra context for your choice.
By comparing brokers and requesting quotes
Short answers about housing prices, sold homes and comparing real estate agents in Lelystad.
The costs of a real estate agent in Lelystad vary per office, property type and sales approach. Therefore, compare multiple quotes and also look at the real estate agents in Lelystad to better compare rates, presentation and local experience.
On this page we currently show 870 sold houses in Lelystad from our selection. This helps you to better assess recent transactions and the local housing market.
Houses sold in Lelystad give insight into asking prices, house types and neighborhoods where recent transactions have taken place. Compare this also with the current housing stock in Lelystad to better understand the market.
You can use sold homes as a first market indication, but a local real estate agent can better take into account finishing, location, maintenance and current demand in Lelystad.
Compare realtors in Lelystad on local sales experience, reviews, expected yield, commission and marketing approach. The top 10 realtors in Lelystad helps to quickly discover strong offices.
View current location data on residents, WOZ development, housing stock, energy consumption, business activity and safety in Lelystad. In 2026 were there 85.758 residents. The average WOZ value in 2025 is EUR 350.000.
These figures help to better assess and compare the housing stock in Lelystad with recent sold homes. Orient yourself then on suitable top real estate agents in Lelystad for sales advice in this region.
Residents
85.758
Last year: 2026
Average WOZ
EUR 350.000
Last year: 2025
Average income per person.
EUR 31.800
Source: AllNumbers
Crimes (current year)
3.662
Total registered
| Year | Residents |
|---|---|
| 2022 | 81.214 |
| 2023 | 83.033 |
| 2024 | 84.080 |
| 2025 | 84.713 |
| 2026 | 85.758 |
| Year | Average WOZ |
|---|---|
| 2021 | EUR 228.000 |
| 2022 | EUR 259.000 |
| 2023 | EUR 326.000 |
| 2024 | EUR 342.000 |
| 2025 | EUR 350.000 |
Hoger
25
Praktisch
30
Middelbaar
44
Europa
8.972
Nederland
50.785
Buiten Europa
24.956
Label C
13.774
Label A
11.377
Label B
8.074
Label D
1.321
Label A+++
1.073
Label A+
927
Label A++
831
Label E
161
Label A++++
98
Label F
55
Label G
25
Label A+++++
21
| Year | Gas (m3) | Electricity (kWh) |
|---|---|---|
| 2020 | 950 | 2.940 |
| 2021 | 1.080 | 2.990 |
| 2022 | 840 | 2.840 |
| 2023 | 710 | 2.690 |
| 2024 | 700 | 2.770 |
Hoekwoning
Gas: 790 • Electricity: 2.720
Huurwoning
Gas: 670 • Electricity: 2.150
Koopwoning
Gas: 740 • Electricity: 3.030
Appartement
Gas: 500 • Electricity: 1.900
Tussenwoning
Gas: 720 • Electricity: 2.600
Vrijstaande woning
Gas: 990 • Electricity: 4.240
Twee-onder-één-kap woning
Gas: 630 • Electricity: 3.460
Total number of company establishments: 10.950
| Period | Crimes |
|---|---|
| jan 2025 | 278 |
| jan 2026 | 260 |
| jul 2025 | 323 |
| jun 2025 | 322 |
| mei 2025 | 301 |
| mrt 2025 | 270 |
| nov 2024 | 332 |
| nov 2025 | 312 |
| okt 2024 | 293 |
| okt 2025 | 298 |
| sep 2024 | 358 |
| sep 2025 | 334 |
These figures give an indicative picture of safety trends in the living environment of Lelystad.
Short answers based on current local statistics, handy for a quick comparison of the living environment.
Lelystad telt in 2026 ongeveer 85.758 inwoners.
De gemiddelde WOZ-waarde in Lelystad is in 2025 circa € 350.000.
Het gemiddelde inkomen per inwoner in Lelystad ligt rond € 31.800 per jaar.
Voor het huidige jaar gaat het om ongeveer 3.662 geregistreerde misdrijven. Gebruik deze cijfers als indicatie en vergelijk trends per periode.
In Lelystad komt vooral "Tussenwoningen" veel voor, met ongeveer 17.317 woningen.