- Sold
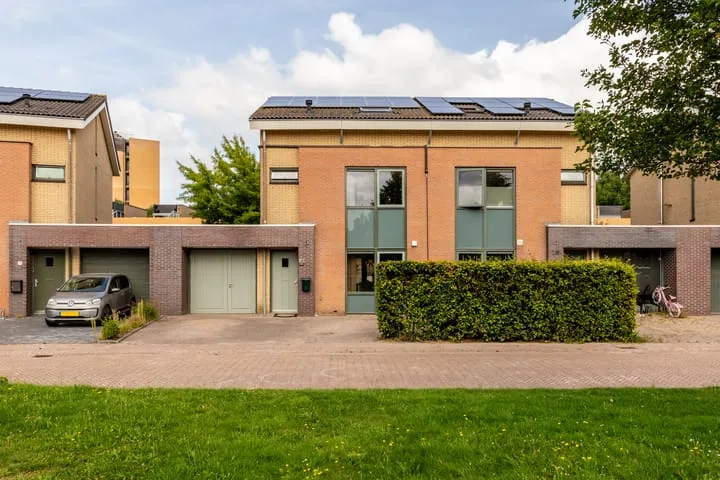
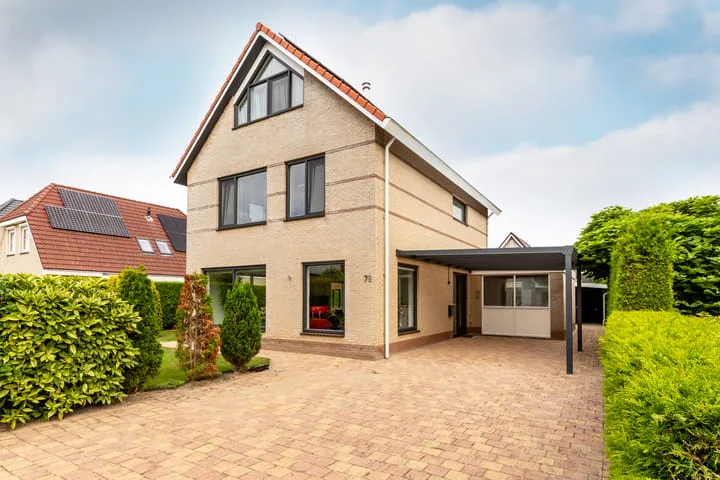
Bongerd 4
8212BA Lelystad
€ 415.000 k.k.
€ 2.842/m²
B
Save as favorite
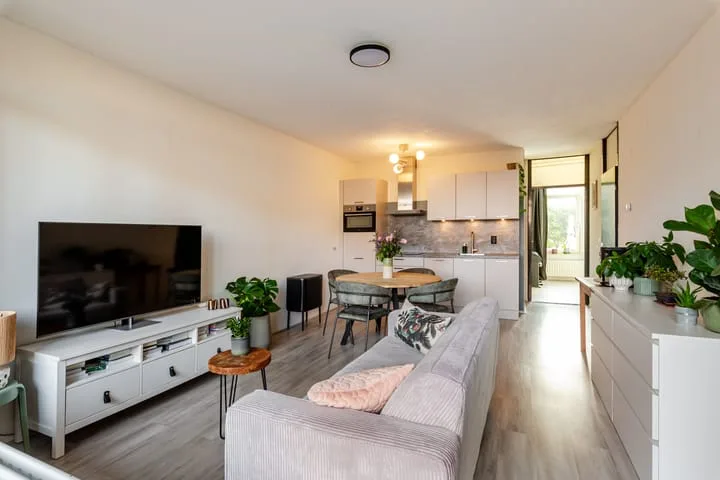
- Living area
- 146 m²
- Land area
- 186 m²
- Bedrooms
- 4