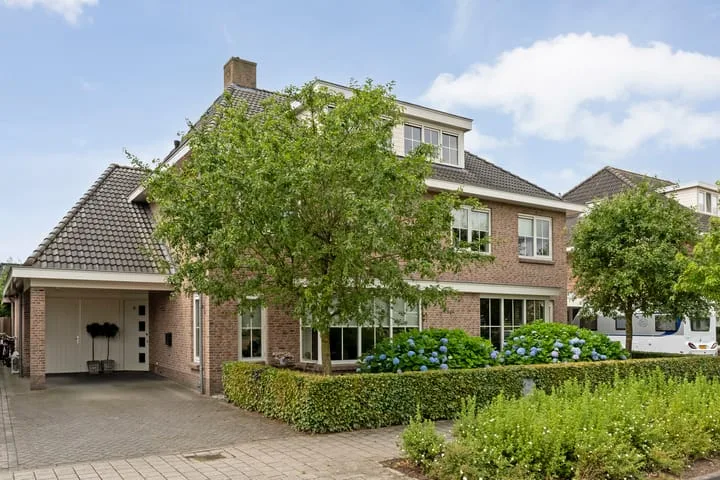
Houses sold in Lemelerveld

View 28 sold houses in Lemelerveld

Connected to: Vastgoed Nederland NVM Makelaars

On this page you will find recently sold homes in Lemelerveld. Use this overview to better estimate selling prices, popular neighborhoods, and the local housing supply before you choose a real estate agent. Also view the current housing supply with 45 houses in Lemelerveld.

Selection

Search and filter homes

Set your preferences and discover homes that suit you.

Total supply 243.603
Filters

Set price, area and other characteristics. Adjust a filter or click on Show homes. Location changes directly above.

Reset filters

You search for

  • Place Lemelerveld
  • Status Sold

Sell your house in Lemelerveld? Compare real estate agents

Bekijk recente verkopen en ontvang gratis offertes van lokale makelaars. Vergelijk meer dan 16 makelaars in Lemelerveld.

Free request a quote

  • Quotes in Lemelerveld
  • Non-binding
  • Personal
  • Compare free rates

Selling your own home in Lemelerveld? Compare real estate agents in Lemelerveld or view the best real estate agents in Lemelerveld as a reference for your choice.

Compare multiple quotes

Real estate agents make sharper offers when they know you're comparing — ask for quotes for sale or purchase.

Frequently asked questions about sold homes in Lemelerveld

Short answers about housing prices, sold homes and comparing real estate agents in Lemelerveld.

Residential and neighborhood statistics in Lemelerveld

View current location data on residents, WOZ development, housing stock, energy consumption, business activity and safety in Lemelerveld. In 2025 were there 4.925 residents. The average WOZ value in 2025 is EUR 420.000.

These figures help to better assess and compare the housing stock in Lemelerveld with recent sold homes. Orient yourself then on suitable top real estate agents in Lemelerveld for sales advice in this region.

Residents

4.925

Last year: 2025

Average WOZ

EUR 420.000

Last year: 2025

Average income per person.

EUR 32.400

Source: AllNumbers

Crimes (current year)

41

Total registered

Demographics and WOZ development

Inhabitants per year

Inhabitants per year in Lemelerveld
Year Residents
2021 4.740
2022 4.770
2023 4.825
2024 4.795
2025 4.925

Annual WOZ value

WOZ value per year in Lemelerveld
Year Average WOZ
2021 EUR 306.000
2022 EUR 329.000
2023 EUR 371.000
2024 EUR 400.000
2025 EUR 420.000

Composition of residents

Age build-up

65+: 1.065 0-15: 760 15-25: 565 25-45: 1.145 45-65: 1.380

Education level

Hoger

820

Praktisch

990

Middelbaar

1.840

Origin of residents (2025)

Europa

140

Nederland

4.525

Buiten Europa

255

Housing stock and construction periods

Types of homes

Hoekwoningen 286
Appartementen 271
Tussenwoningen 354
Vrijstaande woningen 704
Twee-onder-één-kap woningen 468

Construction period of buildings

Voor 1700 0
1700 tot 1900 35
1900 tot 1925 76
1925 tot 1950 153
1950 tot 1970 323
1970 tot 1980 357
1980 tot 1990 301
1990 tot 2000 238
2000 tot 2010 276
2010 tot 2020 199
2020 en later 134

Energy and sustainability

Energy label distribution

Label A

607

Label C

436

Label B

394

Label G

196

Label D

179

Label F

88

Label E

48

Label A+++

38

Label A+

34

Label A++

23

Label A++++

10

Label A+++++

4

Average energy consumption per year

Average energy consumption per year in Lemelerveld
Year Gas (m3) Electricity (kWh)
2020 1.440 3.210
2021 1.550 3.340
2022 1.200 3.130
2023 980 3.000
2024 920 3.100

Consumption per house type

Hoekwoning

Gas: 850 • Electricity: 2.490

Huurwoning

Gas: 780 • Electricity: 2.090

Koopwoning

Gas: 1.040 • Electricity: 3.280

Appartement

Gas: 710 • Electricity: 2.030

Tussenwoning

Gas: 760 • Electricity: 2.370

Vrijstaande woning

Gas: 1.250 • Electricity: 3.700

Twee-onder-één-kap woning

Gas: 960 • Electricity: 3.230

Business activity in Lemelerveld (2025)

Handel en HORECA 120
Nijverheid en energie 85
Zakelijke dienstverlening 120
Overheid, onderwijs en zorg 60
Landbouw, bosbouw en visserij 75
Vervoer, informatie en communicatie 25
Financiele diensten en onroerendgoed 20
Cultuur, recreatie en overige diensten 60

Total number of company establishments: 570

Recent crime statistics

Recent crime statistics in Lemelerveld
Period Crimes
jan 2025 6
jan 2026 3
jul 2025 4
jun 2025 4
mei 2025 0
mrt 2025 4
nov 2024 3
nov 2025 4
okt 2024 7
okt 2025 1
sep 2024 3
sep 2025 7

These figures give an indicative picture of safety trends in the living environment of Lemelerveld.

Frequently asked questions about living in Lemelerveld

Short answers based on current local statistics, handy for a quick comparison of the living environment.

Hoeveel inwoners heeft Lemelerveld?

Lemelerveld telt in 2025 ongeveer 4.925 inwoners.

Wat is de gemiddelde WOZ-waarde in Lemelerveld?

De gemiddelde WOZ-waarde in Lemelerveld is in 2025 circa € 420.000.

Wat is het gemiddelde inkomen per inwoner in Lemelerveld?

Het gemiddelde inkomen per inwoner in Lemelerveld ligt rond € 32.400 per jaar.

Hoe veilig is wonen in Lemelerveld?

Voor het huidige jaar gaat het om ongeveer 41 geregistreerde misdrijven. Gebruik deze cijfers als indicatie en vergelijk trends per periode.

Welke woningtypen komen het meest voor in Lemelerveld?

In Lemelerveld komt vooral "Vrijstaande woningen" veel voor, met ongeveer 704 woningen.

Receive free, non-binding quotes

Compare multiple real estate agents and choose the best match.