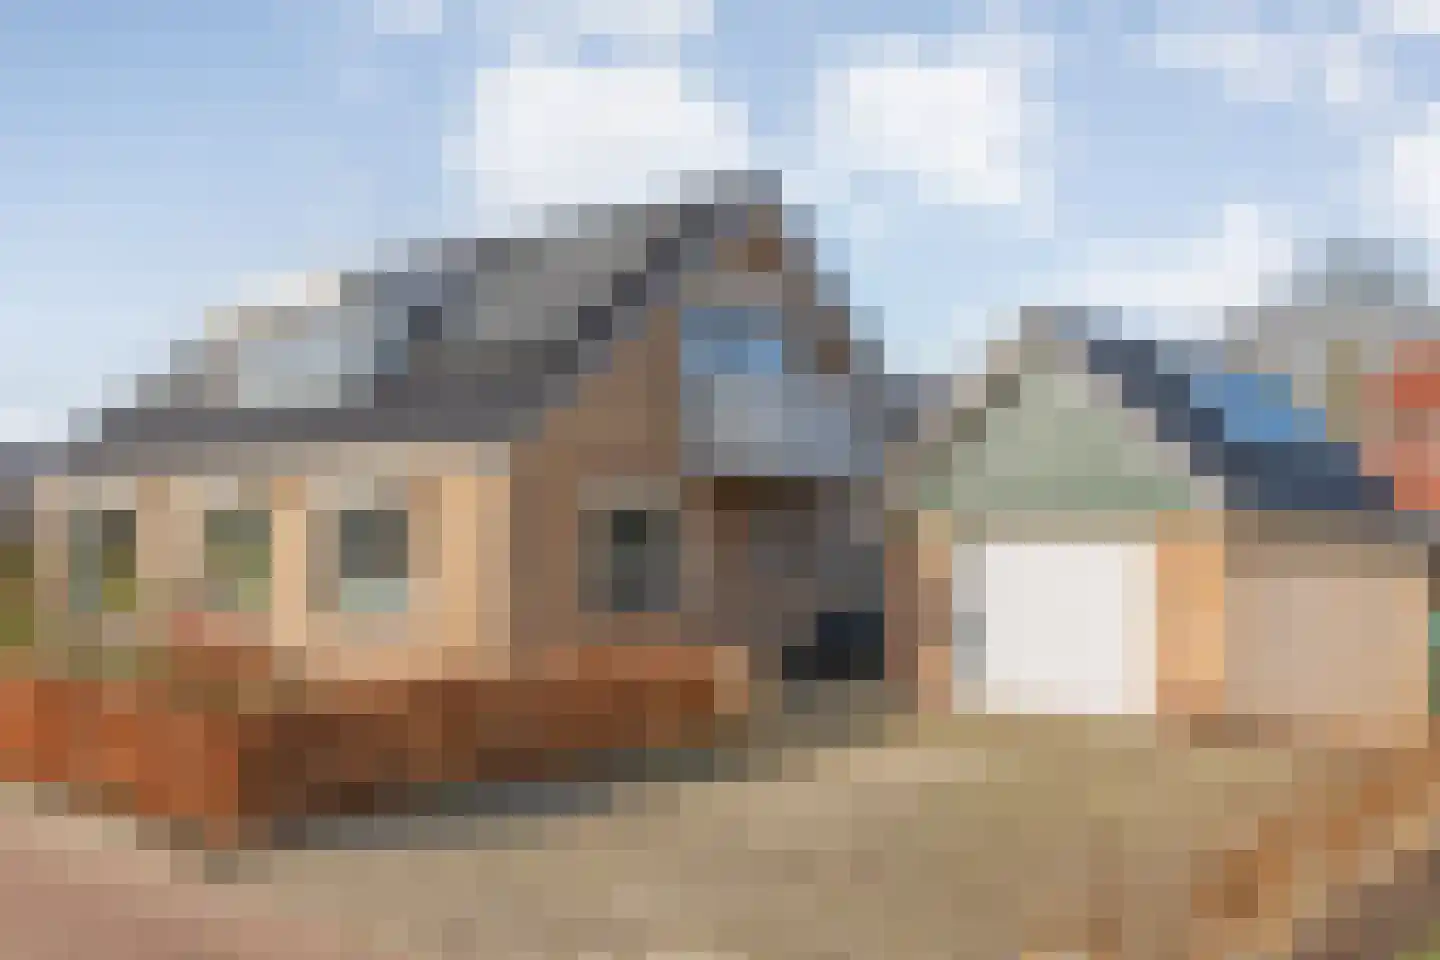
- Available
Van Eklaan 5
7766BC Nieuw-Schoonebeek
€ 289.500 k.k.
€ 2.954/m²
- Living area
- 98 m²
- Land area
- 354 m²
- Bedrooms
- 3
Searching in 10 houses in Nieuw-Schoonebeek
Type to search. Use arrow down and arrow up to navigate through results and press Enter to open.
Hidden search suggestions.
View current properties in Nieuw-Schoonebeek or search targeted on street, postal code and property characteristics.
View the current housing stock in Nieuw-Schoonebeek and quickly filter by price, living area, rooms and more. There are currently 10 houses in this place within our selection. View also 6 sold houses in Nieuw-Schoonebeek for extra insight into the local housing market.
7766BC Nieuw-Schoonebeek
€ 289.500 k.k.
€ 2.954/m²
7766BG Nieuw-Schoonebeek
€ 399.000 k.k.
€ 2.660/m²
7766AM Nieuw-Schoonebeek
€ 369.500 k.k.
€ 768/m²
7766BN Nieuw-Schoonebeek
€ 350.000 k.k.
7766BG Nieuw-Schoonebeek
€ 395.000 k.k.
€ 3.405/m²
7766BT Nieuw-Schoonebeek
€ 795.000 k.k.
€ 3.803/m²
7766BD Nieuw-Schoonebeek
€ 275.000 k.k.
€ 2.925/m²
7766AK Nieuw-Schoonebeek
€ 450.000 k.k.
€ 1.424/m²
7766BB Nieuw-Schoonebeek
€ 275.000 k.k.
€ 2.669/m²
7766AK Nieuw-Schoonebeek
€ 465.000 k.k.
€ 2.384/m²
Get free quotes from real estate agents with local market knowledge. Compare more than 15 real estate agents in Nieuw-Schoonebeek.
Selling a home in Nieuw-Schoonebeek? Compare all real estate agents in Nieuw-Schoonebeek or view the top 10 real estate agents in Nieuw-Schoonebeek for extra context for your choice.
Real estate agents make sharper offers when they know you're comparing — ask for quotes for sale or purchase.
Practical answers about housing supply, sales and comparing real estate agents in Nieuw-Schoonebeek.
The costs of a real estate agent in Nieuw-Schoonebeek depend on commission, setup costs, property presentation and the chosen service. Compare the 15 real estate agents in Nieuw-Schoonebeek via the real estate agent page and request multiple quotes to compare rates and approach well.
Within our selection, we are currently showing 10 houses in Nieuw-Schoonebeek. View also the sold houses in Nieuw-Schoonebeek to compare the current offering with recent transactions.
Take into account not only price and living area but also maintenance, energy label, location, outdoor space and sales status. This way you compare houses in Nieuw-Schoonebeek on more than just the asking price.
A local real estate agent knows the neighborhoods, recent transactions and demand in Nieuw-Schoonebeek. By comparing 15 real estate agents in the region you get a better insight into prices, sales strategy and expected yield; the top 10 in Nieuw-Schoonebeek provides a useful starting point.
Yes, when making a sales plan, a valuation in Nieuw-Schoonebeek is wise. You gain insight into a realistic asking price and can then compare offers from real estate agents specifically.
View current location data on residents, WOZ development, housing stock, energy consumption, business activity and safety in Nieuw-Schoonebeek. In 2026 were there 1.302 residents. The average WOZ value in 2025 is EUR 319.000.
These figures help to better assess and compare the housing stock in Nieuw-Schoonebeek with recent sold homes. Orient yourself then on suitable top real estate agents in Nieuw-Schoonebeek for sales advice in this region.
Residents
1.302
Last year: 2026
Average WOZ
EUR 319.000
Last year: 2025
Average income per person.
EUR 30.300
Source: AllNumbers
Crimes (current year)
22
Total registered
| Year | Residents |
|---|---|
| 2021 | 1.285 |
| 2022 | 1.310 |
| 2023 | 1.315 |
| 2024 | 1.300 |
| 2025 | 1.310 |
| 2026 | 1.302 |
| Year | Average WOZ |
|---|---|
| 2021 | EUR 221.000 |
| 2022 | EUR 248.000 |
| 2023 | EUR 282.000 |
| 2024 | EUR 298.000 |
| 2025 | EUR 319.000 |
Hoger
200
Praktisch
290
Middelbaar
520
Europa
100
Nederland
1.185
Buiten Europa
20
Label A
120
Label C
107
Label G
94
Label B
88
Label F
71
Label D
46
Label E
22
Label A++
5
Label A+++
5
Label A+
2
Label A++++
2
Label A+++++
0
| Year | Gas (m3) | Electricity (kWh) |
|---|---|---|
| 2020 | 1.780 | 3.480 |
| 2021 | 1.900 | 3.560 |
| 2022 | 1.480 | 3.350 |
| 2023 | 1.230 | 3.330 |
| 2024 | 1.180 | 3.580 |
Hoekwoning
Gas: 1.030 • Electricity: 1.880
Huurwoning
Gas: 870 • Electricity: 2.530
Koopwoning
Gas: 1.320 • Electricity: 3.540
Appartement
Gas: 780 • Electricity: 2.190
Tussenwoning
Gas: 920 • Electricity: 1.940
Vrijstaande woning
Gas: 1.400 • Electricity: 3.820
Twee-onder-één-kap woning
Gas: 1.130 • Electricity: 3.210
Total number of company establishments: 155
| Period | Crimes |
|---|---|
| jan 2026 | 2 |
| jul 2025 | 0 |
| jun 2025 | 0 |
| mei 2025 | 1 |
| mrt 2025 | 3 |
| mrt 2026 | 3 |
| nov 2024 | 0 |
| nov 2025 | 2 |
| okt 2024 | 0 |
| okt 2025 | 2 |
| sep 2024 | 1 |
| sep 2025 | 2 |
These figures give an indicative picture of safety trends in the living environment of Nieuw-Schoonebeek.
Short answers based on current local statistics, handy for a quick comparison of the living environment.
Nieuw-Schoonebeek telt in 2026 ongeveer 1.302 inwoners.
De gemiddelde WOZ-waarde in Nieuw-Schoonebeek is in 2025 circa € 319.000.
Het gemiddelde inkomen per inwoner in Nieuw-Schoonebeek ligt rond € 30.300 per jaar.
Voor het huidige jaar gaat het om ongeveer 22 geregistreerde misdrijven. Gebruik deze cijfers als indicatie en vergelijk trends per periode.
In Nieuw-Schoonebeek komt vooral "Vrijstaande woningen" veel voor, met ongeveer 302 woningen.