Duijndam Makelaardij staat al 24 jaar voor kwaliteit en persoonlijke begeleiding in Klazienaveen en de omgeving. Wij zijn aangesloten bij Vastgoed Nederland, een van de grootste brancheverenigingen in Nederland met duizenden aangesloten kantoren. Of u op zoek bent naar een nieuw huis of uw huidige woning wilt verkopen, wij begeleiden u door het hele proces met expertise en toewijding. Ons kantoor is gevestigd in het centrum van Klaziena...
Current housing stock
-
- Available
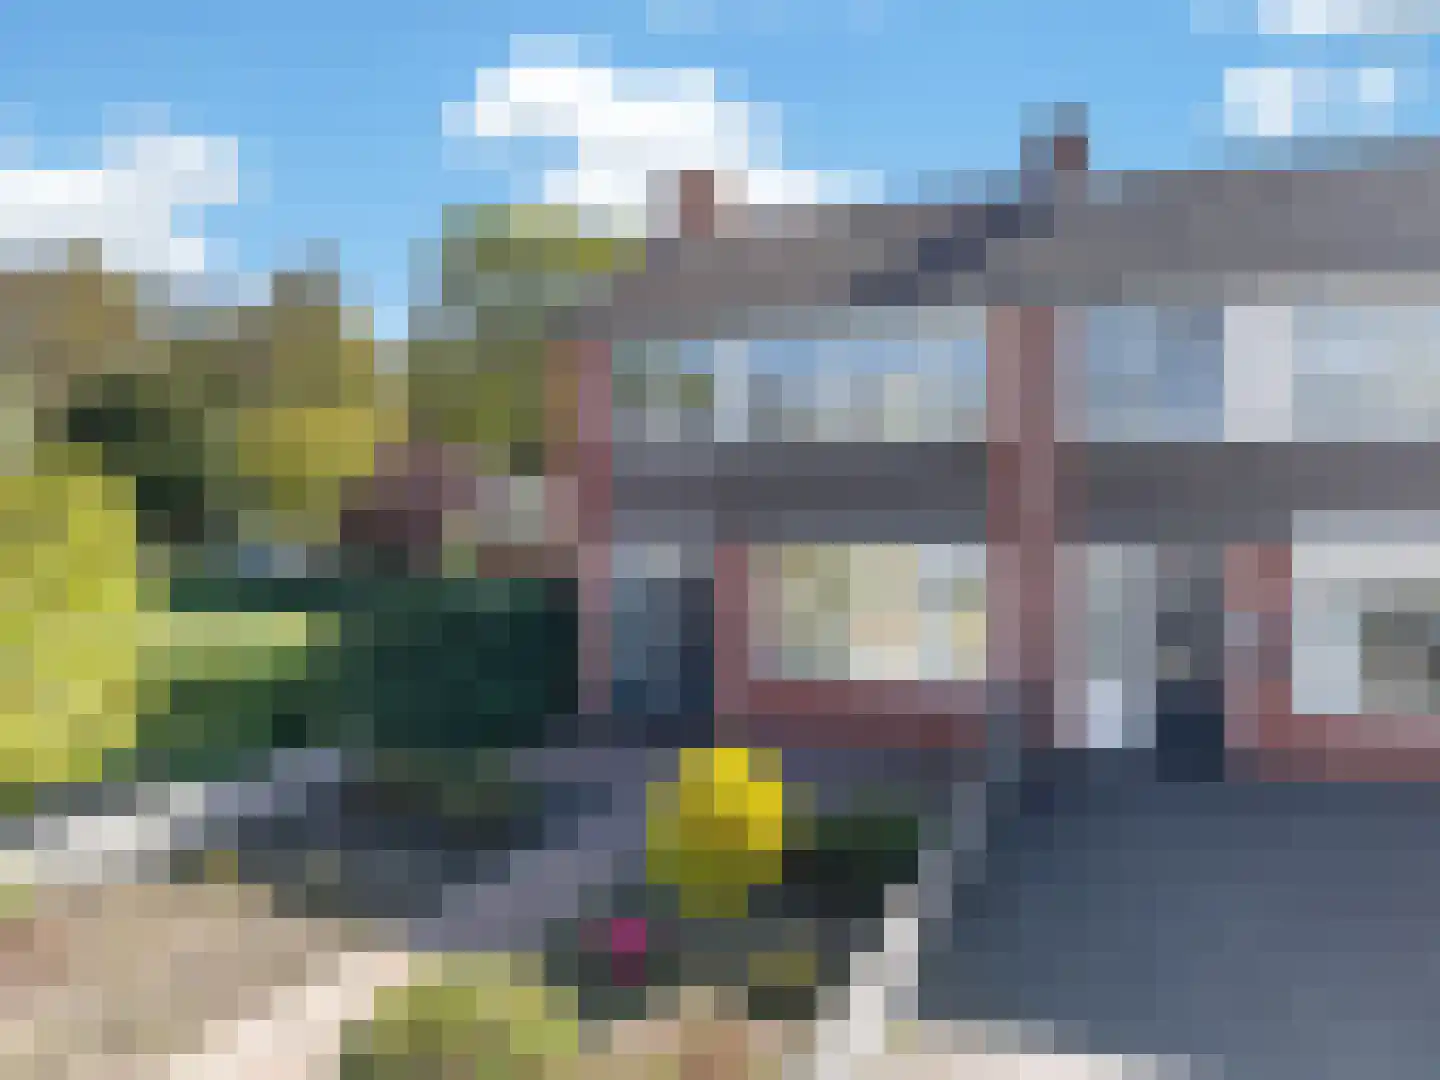
Oerzand 3
7833EM Nieuw-Amsterdam
€ 220.000 k.k.
€ 2.588/m²
CSave as favorite- Living area
- 85 m²
- Land area
- 201 m²
- Bedrooms
- 3
-
- Available
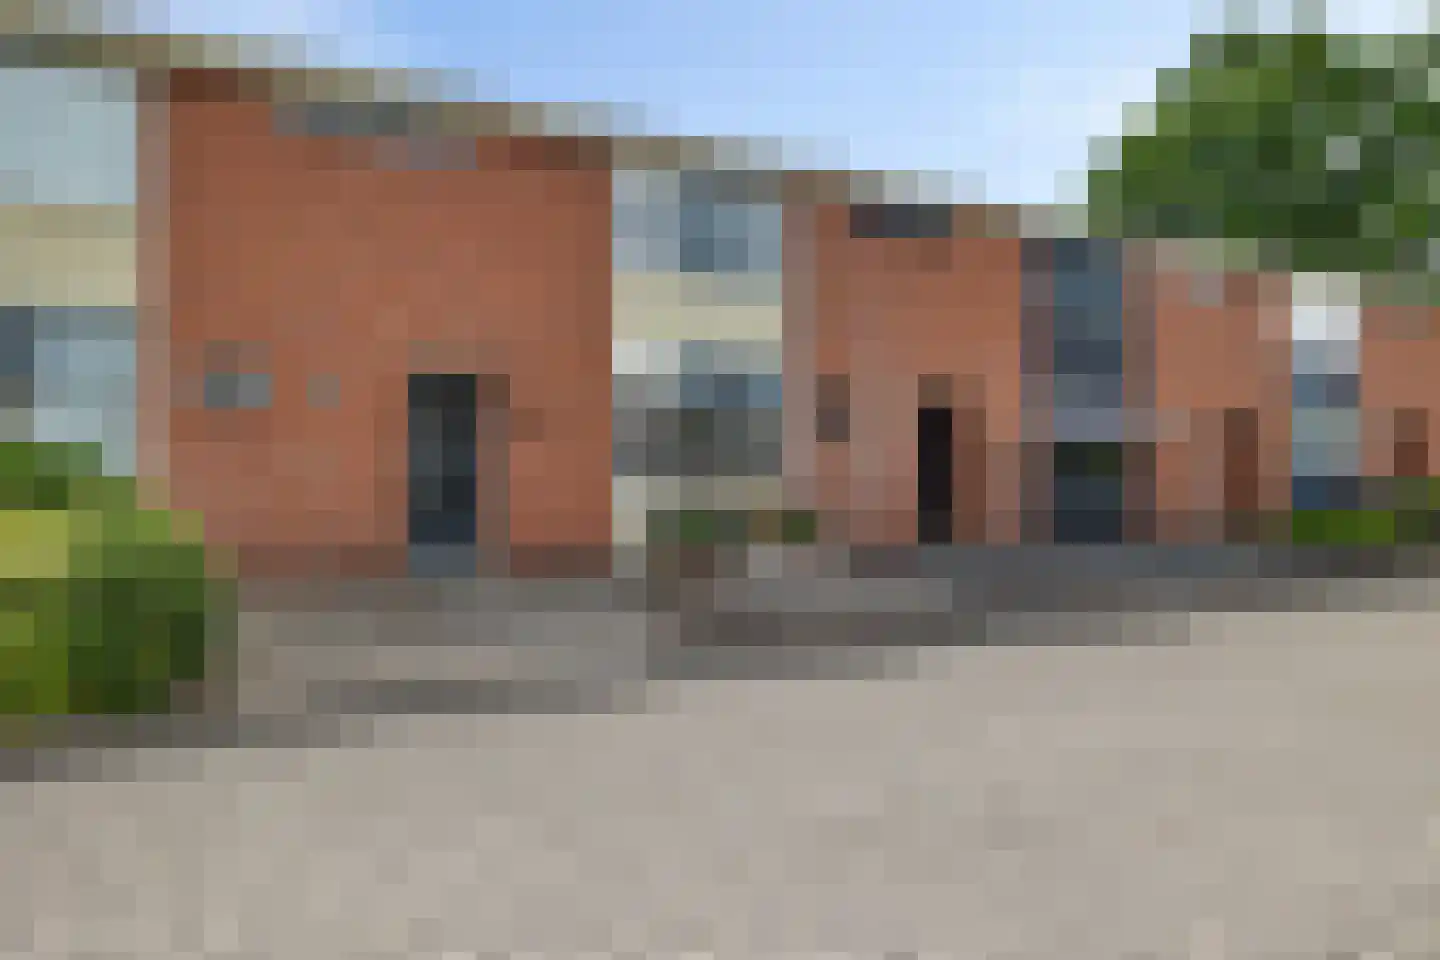
Zuiderdiep 179
7876AJ Valthermond
€ 225.000 k.k.
€ 3.082/m²
CSave as favorite- Living area
- 73 m²
- Land area
- 520 m²
- Bedrooms
- 1
-
- Available
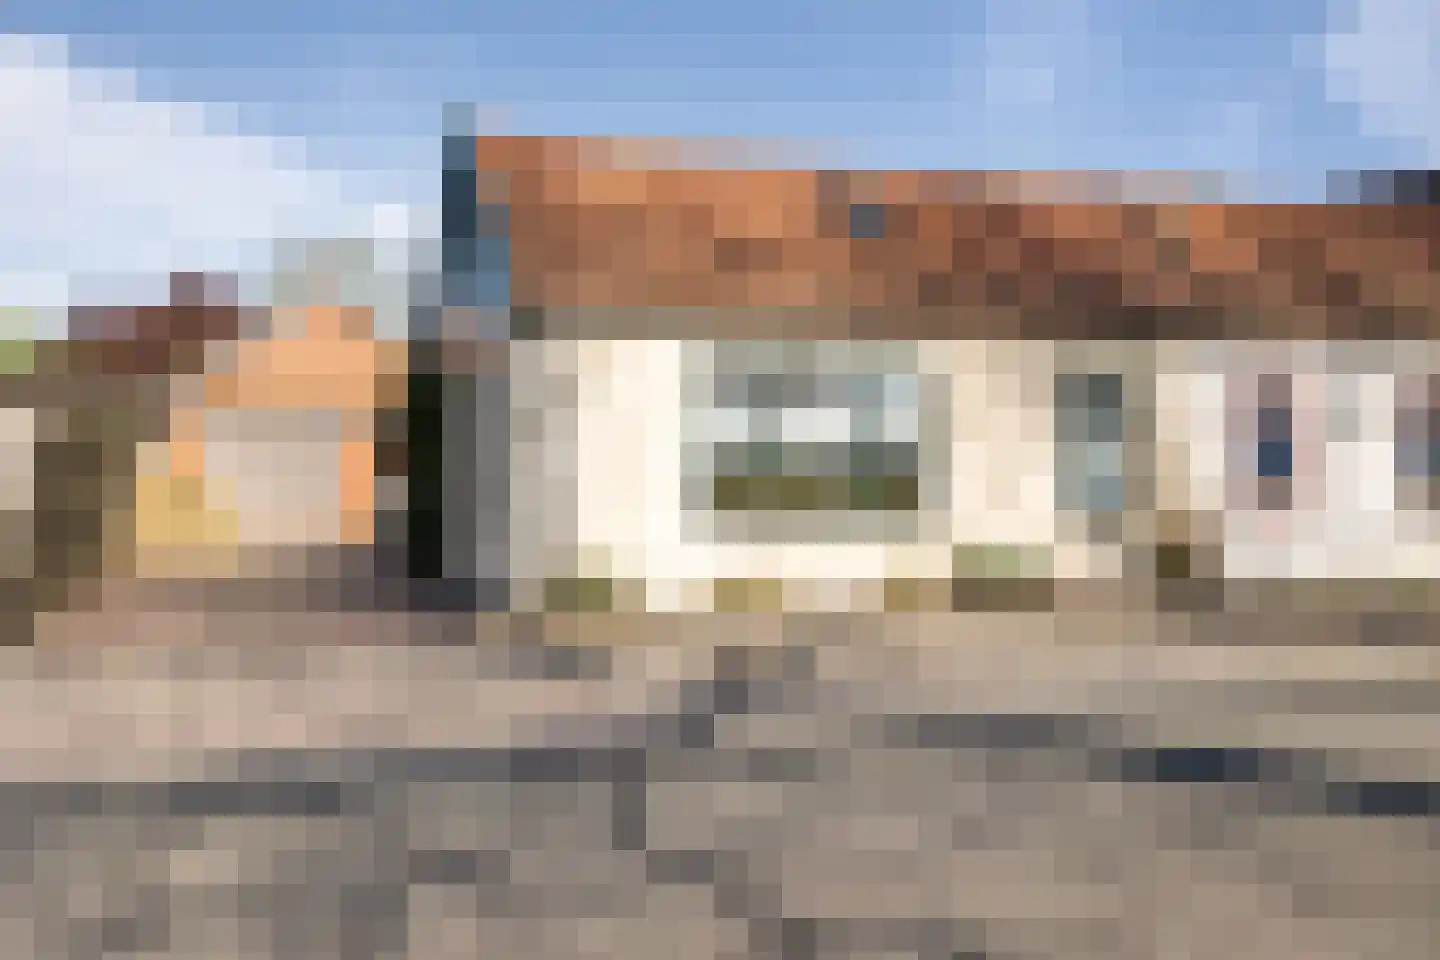
Kerkenweg 42
7765BP Weiteveen
€ 315.000 k.k.
€ 2.890/m²
GSave as favorite- Living area
- 109 m²
- Land area
- 626 m²
- Bedrooms
- 4
-

- Sold
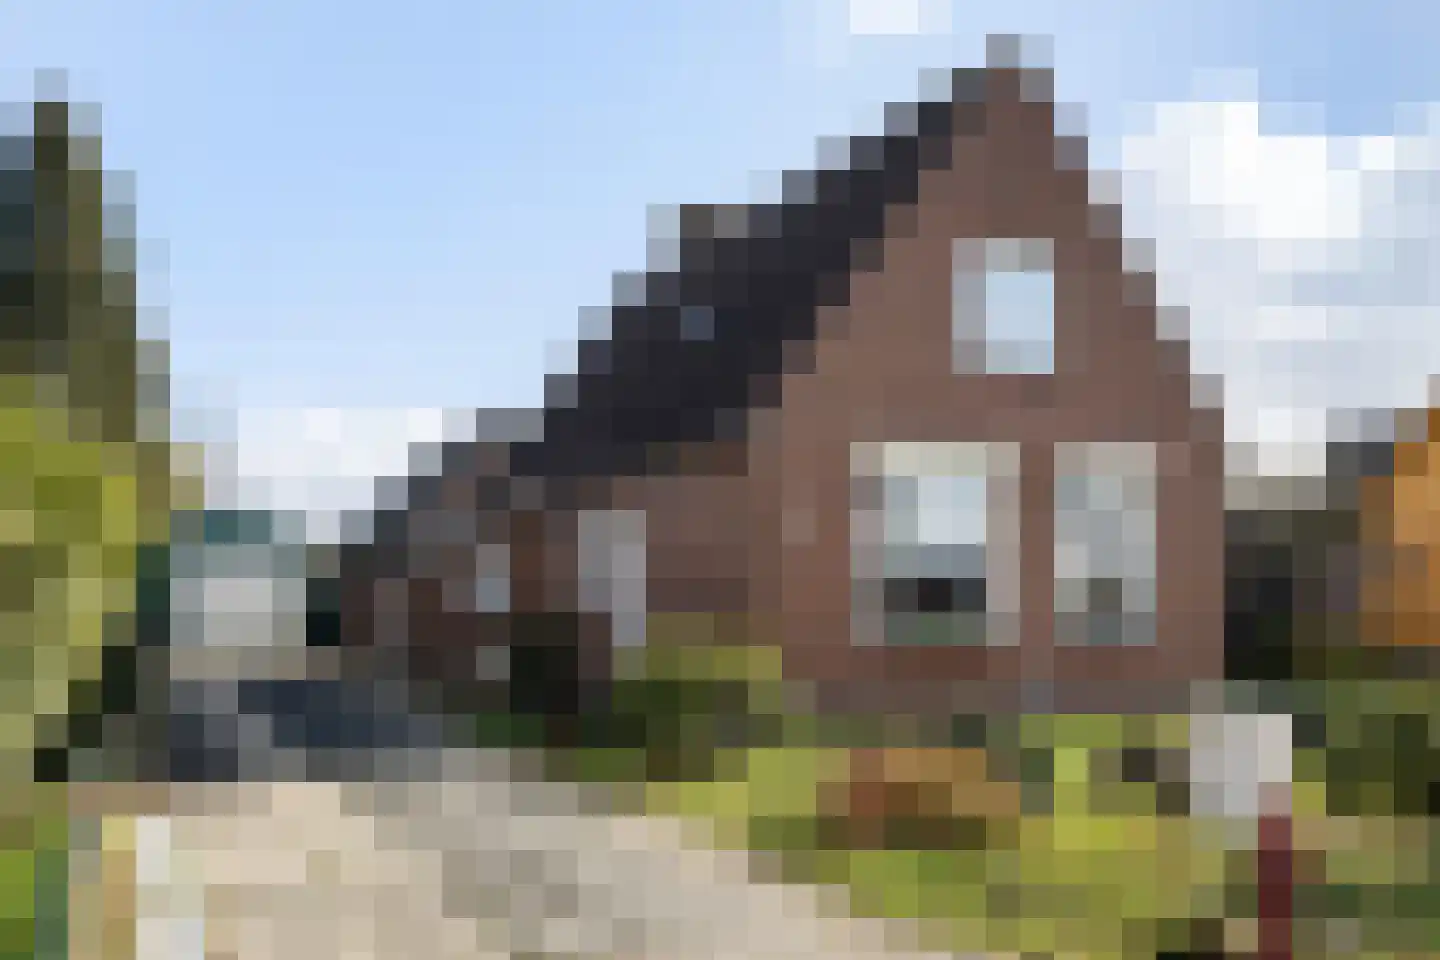
Van Echtenskanaal NZ 115
7891AE Klazienaveen
€ 465.000 k.k.
€ 3.321/m²
CSave as favorite- Living area
- 140 m²
- Land area
- 938 m²
- Bedrooms
- 3
-

- Sold subject to confirmation
De Piepe 18
7891SN Klazienaveen
€ 245.000 k.k.
€ 2.333/m²
BSave as favorite- Living area
- 105 m²
- Land area
- 148 m²
- Bedrooms
- 3
-
- Sold subject to confirmation
Poolcirkel 12
7891BB Klazienaveen
€ 335.000 k.k.
€ 3.073/m²
BSave as favorite- Living area
- 109 m²
- Land area
- 271 m²
- Bedrooms
- 3
Reviews (44)
Review platforms
BronscoresTotal score
44 total reviews

Funda
34 reviews on Funda

10 reviews on Google
-
Van Echtenskanaal NZ 115
10Huis binnen vier weken verkocht. Kon dus niet beter. Korte lijntjes en steeds heel vriendelijk geholpen. Top!
-
De Wieken 26
10Vriendelijke behulpzame mensen. We hebben goed contact tijdens alle stappen van de verkoop van het huis.
-
roef bults
10WIJ WILLEN DUINDAM EEN GROTE PLUIM GEVEN VOOR DE HULP EN BEGELEIDING VAN DE VERKOOP VAN HET HUIS VAN ONZE ZWAGER EEN HEEL GOED KOPPEL
-
Vastenow 211
9Contact met de makelaar was zeer goed. Wij werden van de ontwikkelingen goed op de hoogte gehouden. De onderhandelingen met de uiteindelijke kopers is in onze aanwezigheid op een correcte manier gevoerd en uiteindelijk naar onze volle tevredenheid.
-
Voorstag 12
10Wij hebben een paar jaar geleden ook gebruik gemaakt van de diensten van Dhr. Duijndam van Duijndam Makelaardij te Klazienaveen bij de ver koop en aankoop van een woning. Dit is toen naar volle tevredenheid verlopen. Daarom hebben wij er ditmaal weer gekozen om Duijndam Makelaardij in de arm te nemen. Ook deze keer is de verkoop van onze woning vlot, deskundig en zeer prettig verlopen. Hierbij willen wij Duijndam Makelaardij te Klazienaveen zeker aanbevelen. …
-
Nassaustraat 3 A
9Vakkundige begeleiding. En goed advies. Prettige omgang. En snelle verkoop.. Tevens dicht bij huis. In eigen dorp.
-
Wollegras 5
10Translated by AIA very fine real estate agent. Personal and knowledgeable. Clear in the explanation and transparent. From first to last contact. In short, highly recommended.
-
De Omloop 15
9Translated by AIThe contact went very smoothly. A reasonable price asked for the house. You can always come in for advice.
-
Nadirlaan 3
10Translated by AII am super satisfied with the real estate agent! The contact was very pleasant — professional, friendly and always quick in communication. Everything went smoothly and professionally. Really a recommendation!
-
Het Slag 3
10Translated by AIVery helpful, always ready for you and thinking along. Nice people with knowledge of the local market. Quick responses. Very satisfied and can definitely recommend this real estate agent
-
Boskraai 69
10Translated by AIWe are happy that we had this realtor. Came across as someone who knows his stuff well and conveys it, knows what he is talking about and was well prepared!
-
De Klamp 8
10Translated by AIJust a no-nonsense realtor, clear and reliable. Good support throughout the entire sales process.
-
Rigel 16
10Translated by AIRene Duijndam and his wife Leida are both proficient and skilled in their work as a realtor. Leida is a very friendly and spontaneous woman, and we would definitely recommend Duijndam real estate.
-
Schoolstraat 142
9Translated by AIThe broker is reliable knows what he does good service Neat broker friendly and direct
-
Oosterwijk WZ 49
10Translated by AIThe contact with the real estate agent was amazing, it exceeded our expectations. We are very satisfied. Every question we had was neatly answered. You could always call him or his wife.
-
Westelijke Doorsnee NZ 108
9Translated by AIDuyndam Real Estate are very driven, honest people. Very friendly and helpful. They helped us when the energy label determination was incorrect.
-
Heidestraat 30
9Translated by AIVery good, always reachable, good service. Top realtor, quick sale of our house. Good cooperation.
-
Kanaal B ZZ 115
9Translated by AIKnowledgeable and friendly realtor. Gives a good explanation of the process and communicates clearly and distinctly.
-
De Kap 151
10Translated by AIA very pleasant real estate agent to work with. They really take the time for you and think along well with you. Both when selling my own house, as when buying a new one. Very nice real estate agent with expertise. Highly recommended.
-
Evenaar 22
10Translated by AIVery good advice and feedback. Very satisfied. Definitely recommended for any buyers or sellers.