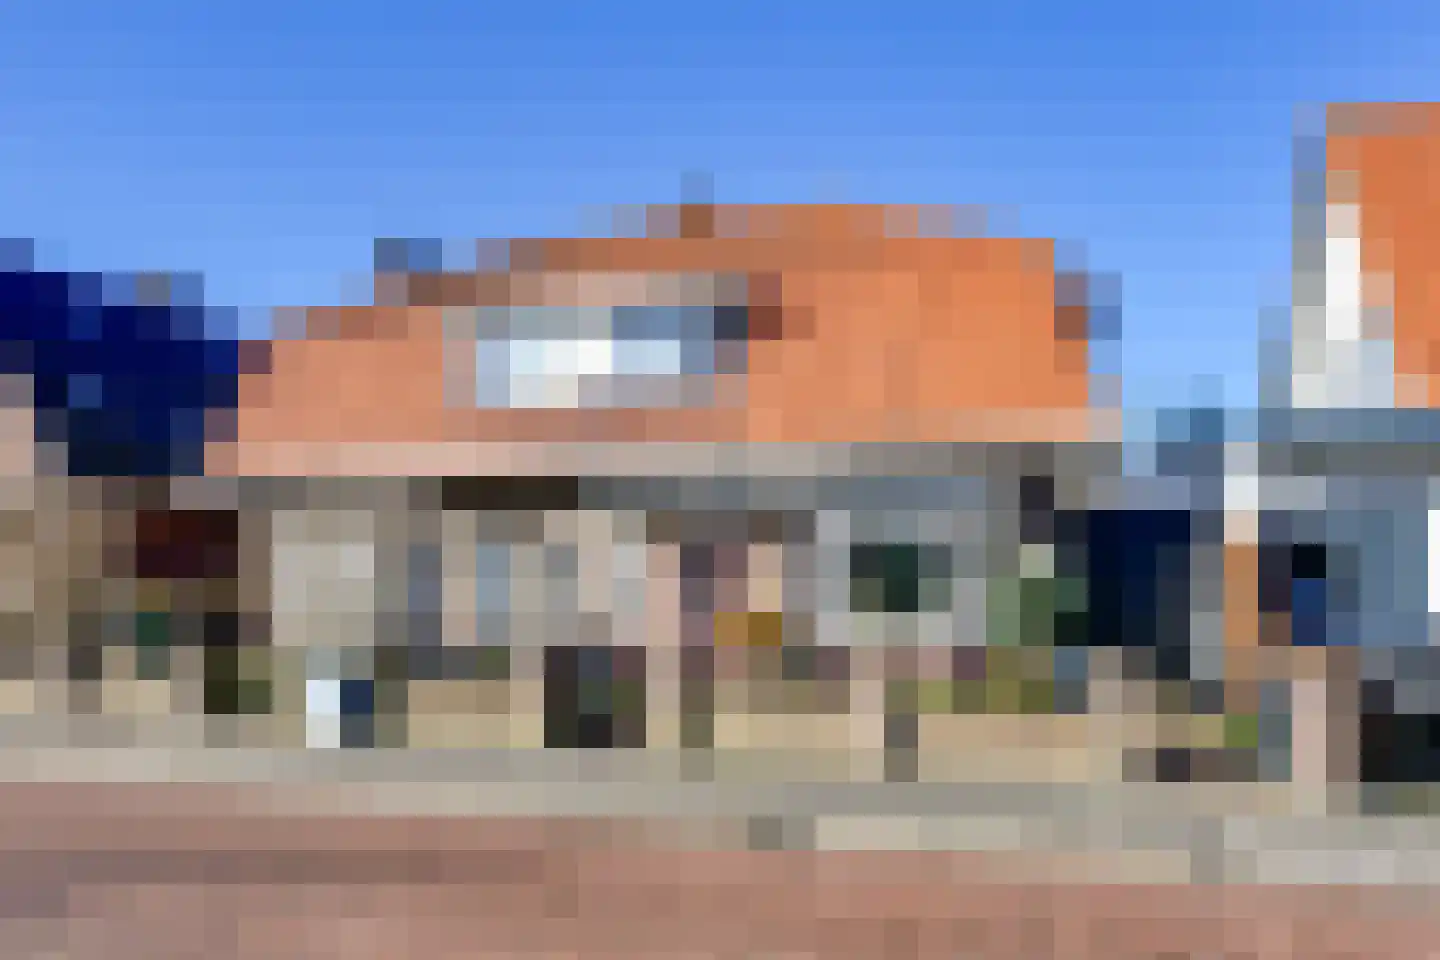
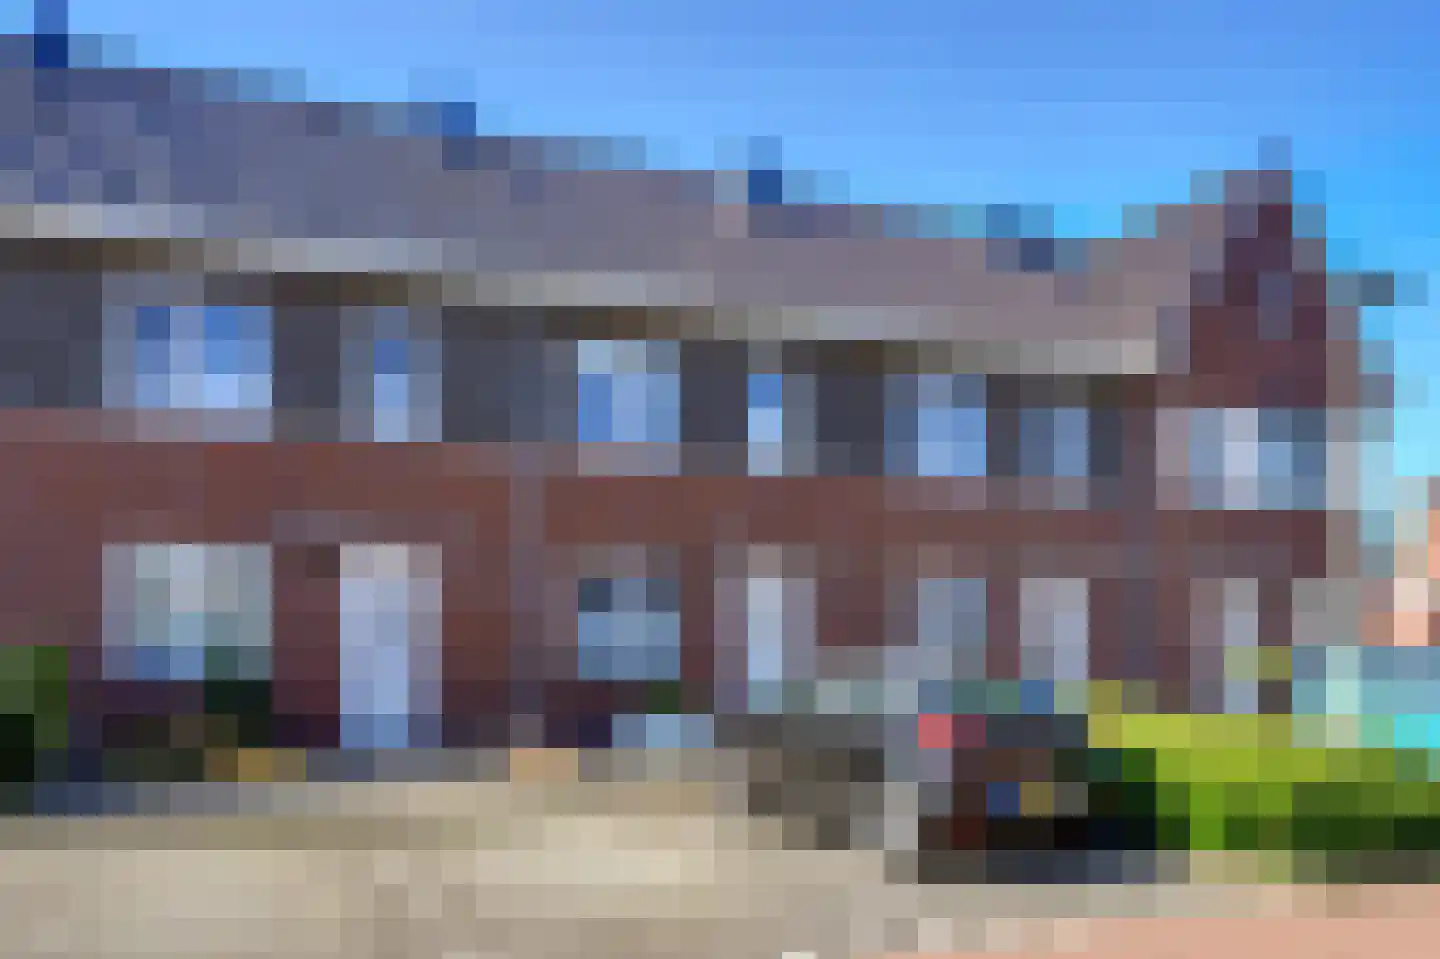
Housing offer in Nieuwendijk

Searching in 40 houses in Nieuwendijk

Connected to: Vastgoed Nederland NVM Makelaars

View the current housing stock in Nieuwendijk and quickly filter by price, living area, rooms and more. There are currently 40 houses in this place within our selection. View also 28 sold houses in Nieuwendijk for extra insight into the local housing market.

Selection

Search and filter homes

Set your preferences and discover homes that suit you.

Total supply 243.652
Filters

Set price, area and other characteristics. Adjust a filter or click on Show homes. Location changes directly above.

Reset filters

You search for

  • Place Nieuwendijk

Selling a home in Nieuwendijk? Compare realtor offers

Get free quotes from real estate agents with local market knowledge. Compare more than 28 real estate agents in Nieuwendijk.

Free request a quote

  • Quotes in Nieuwendijk
  • Non-binding
  • Personal
  • Compare free rates

Selling a home in Nieuwendijk? Compare all real estate agents in Nieuwendijk or view the top 10 real estate agents in Nieuwendijk for extra context for your choice.

Compare multiple quotes

Real estate agents make sharper offers when they know you're comparing — ask for quotes for sale or purchase.

Frequently asked questions about homes in Nieuwendijk

Practical answers about housing supply, sales and comparing real estate agents in Nieuwendijk.

Residential and neighborhood statistics in Nieuwendijk

View current location data on residents, WOZ development, housing stock, energy consumption, business activity and safety in Nieuwendijk. In 2025 were there 3.730 residents. The average WOZ value in 2025 is EUR 377.000.

These figures help to better assess and compare the housing stock in Nieuwendijk with recent sold homes. Orient yourself then on suitable top real estate agents in Nieuwendijk for sales advice in this region.

Residents

3.730

Last year: 2025

Average WOZ

EUR 377.000

Last year: 2025

Average income per person.

EUR 33.700

Source: AllNumbers

Crimes (current year)

175

Total registered

Demographics and WOZ development

Inhabitants per year

Inhabitants per year in Nieuwendijk
Year Residents
2021 3.660
2022 3.665
2023 3.675
2024 3.735
2025 3.730

Annual WOZ value

WOZ value per year in Nieuwendijk
Year Average WOZ
2021 EUR 270.000
2022 EUR 296.000
2023 EUR 350.000
2024 EUR 371.000
2025 EUR 377.000

Composition of residents

Age build-up

65+: 810 0-15: 595 15-25: 380 25-45: 905 45-65: 1.040

Education level

Hoger

640

Praktisch

840

Middelbaar

1.270

Origin of residents (2025)

Europa

120

Nederland

3.380

Buiten Europa

240

Housing stock and construction periods

Types of homes

Hoekwoningen 321
Appartementen 145
Tussenwoningen 411
Vrijstaande woningen 459
Twee-onder-één-kap woningen 335

Construction period of buildings

Voor 1700 1
1700 tot 1900 42
1900 tot 1925 214
1925 tot 1950 121
1950 tot 1970 349
1970 tot 1980 353
1980 tot 1990 161
1990 tot 2000 115
2000 tot 2010 89
2010 tot 2020 169
2020 en later 38

Energy and sustainability

Energy label distribution

Label A

464

Label C

342

Label B

263

Label G

200

Label D

139

Label F

111

Label E

62

Label A+

23

Label A+++

10

Label A++

5

Label A++++

1

Label A+++++

0

Average energy consumption per year

Average energy consumption per year in Nieuwendijk
Year Gas (m3) Electricity (kWh)
2020 1.280 2.990
2021 1.430 3.040
2022 1.090 2.860
2023 910 2.700
2024 910 2.750

Consumption per house type

Hoekwoning

Gas: 890 • Electricity: 2.440

Huurwoning

Gas: 800 • Electricity: 1.840

Koopwoning

Gas: 980 • Electricity: 3.200

Appartement

Gas: 560 • Electricity: 1.690

Tussenwoning

Gas: 740 • Electricity: 2.080

Vrijstaande woning

Gas: 1.200 • Electricity: 3.640

Twee-onder-één-kap woning

Gas: 920 • Electricity: 2.870

Business activity in Nieuwendijk (2025)

Handel en HORECA 75
Nijverheid en energie 95
Zakelijke dienstverlening 105
Overheid, onderwijs en zorg 50
Landbouw, bosbouw en visserij 20
Vervoer, informatie en communicatie 25
Financiele diensten en onroerendgoed 25
Cultuur, recreatie en overige diensten 55

Total number of company establishments: 450

Recent crime statistics

Recent crime statistics in Nieuwendijk
Period Crimes
jan 2026 35
jul 2025 9
jun 2025 12
mei 2025 13
mrt 2025 7
mrt 2026 57
nov 2024 4
nov 2025 29
okt 2024 20
okt 2025 12
sep 2024 7
sep 2025 9

These figures give an indicative picture of safety trends in the living environment of Nieuwendijk.

Frequently asked questions about living in Nieuwendijk

Short answers based on current local statistics, handy for a quick comparison of the living environment.

Hoeveel inwoners heeft Nieuwendijk?

Nieuwendijk telt in 2025 ongeveer 3.730 inwoners.

Wat is de gemiddelde WOZ-waarde in Nieuwendijk?

De gemiddelde WOZ-waarde in Nieuwendijk is in 2025 circa € 377.000.

Wat is het gemiddelde inkomen per inwoner in Nieuwendijk?

Het gemiddelde inkomen per inwoner in Nieuwendijk ligt rond € 33.700 per jaar.

Hoe veilig is wonen in Nieuwendijk?

Voor het huidige jaar gaat het om ongeveer 175 geregistreerde misdrijven. Gebruik deze cijfers als indicatie en vergelijk trends per periode.

Welke woningtypen komen het meest voor in Nieuwendijk?

In Nieuwendijk komt vooral "Vrijstaande woningen" veel voor, met ongeveer 459 woningen.

Receive free, non-binding quotes

Compare multiple real estate agents and choose the best match.