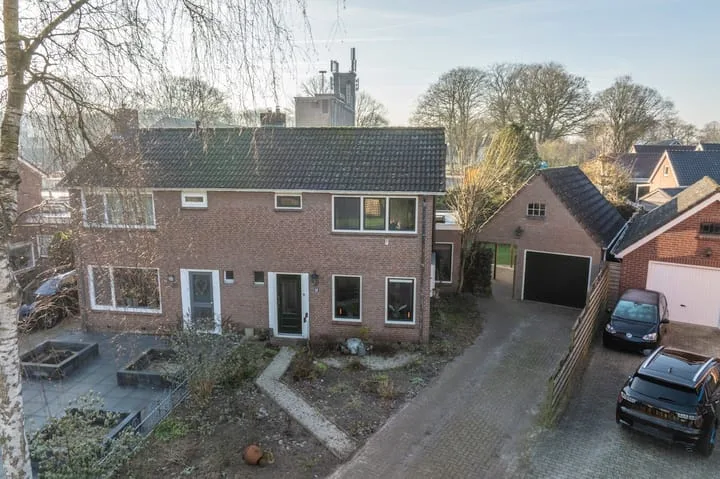
- Available
Hoofdstraat 34
7873TB Odoorn
€ 995.000 k.k.
€ 1.819/m²
- Living area
- 547 m²
- Land area
- 5416 m²
- Bedrooms
- 9
Searching in 23 houses in Odoorn
Type to search. Use arrow down and arrow up to navigate through results and press Enter to open.
Hidden search suggestions.
View current properties in Odoorn or search targeted on street, postal code and property characteristics.
View the current housing stock in Odoorn and quickly filter by price, living area, rooms and more. There are currently 23 houses in this place within our selection. View also 20 sold houses in Odoorn for extra insight into the local housing market.
7873TB Odoorn
€ 995.000 k.k.
€ 1.819/m²
7873AJ Odoorn
€ 499.500 k.k.
7873CM Odoorn
€ 325.000 k.k.
€ 2.902/m²
7873AJ Odoorn
€ 399.000 k.k.
€ 3.381/m²
7873AD Odoorn
€ 389.500 k.k.
€ 3.818/m²
7873CD Odoorn
€ 399.000 k.k.
€ 2.955/m²
7873CA Odoorn
€ 545.000 k.k.
€ 4.467/m²
7873AH Odoorn
€ 375.000 k.k.
€ 3.125/m²
7873AV Odoorn
€ 749.000 k.k.
€ 4.255/m²
7873AH Odoorn
€ 320.000 k.k.
€ 3.516/m²
7873CB Odoorn
€ 525.000 k.k.
€ 3.723/m²
7873CM Odoorn
€ 485.000 k.k.
€ 2.921/m²
7873AK Odoorn
€ 369.000 k.k.
€ 3.448/m²
7873AB Odoorn
€ 525.000 k.k.
€ 3.645/m²
7873CV Odoorn
€ 369.500 k.k.
€ 3.299/m²
7873CV Odoorn
Price upon request
7873DB Odoorn
€ 549.000 k.k.
€ 3.866/m²
7873BP Odoorn
€ 575.000 k.k.
€ 4.227/m²
7873CZ Odoorn
€ 545.000 k.k.
€ 4.360/m²
7873CA Odoorn
€ 625.000 k.k.
€ 0/m²
7873CA Odoorn
€ 545.000 k.k.
€ 3.168/m²
7873BN Odoorn
€ 925.000 k.k.
€ 1.640/m²
7873TC Odoorn
€ 665.000 k.k.
€ 3.243/m²
Get free quotes from real estate agents with local market knowledge. Compare more than 24 real estate agents in Odoorn.
Selling a home in Odoorn? Compare all real estate agents in Odoorn or view the top 10 real estate agents in Odoorn for extra context for your choice.
Real estate agents make sharper offers when they know you're comparing — ask for quotes for sale or purchase.
Practical answers about housing supply, sales and comparing real estate agents in Odoorn.
The costs of a real estate agent in Odoorn depend on commission, setup costs, property presentation and the chosen service. Compare the 24 real estate agents in Odoorn via the real estate agent page and request multiple quotes to compare rates and approach well.
Within our selection, we are currently showing 23 houses in Odoorn. View also the sold houses in Odoorn to compare the current offering with recent transactions.
Take into account not only price and living area but also maintenance, energy label, location, outdoor space and sales status. This way you compare houses in Odoorn on more than just the asking price.
A local real estate agent knows the neighborhoods, recent transactions and demand in Odoorn. By comparing 24 real estate agents in the region you get a better insight into prices, sales strategy and expected yield; the top 10 in Odoorn provides a useful starting point.
Yes, when making a sales plan, a valuation in Odoorn is wise. You gain insight into a realistic asking price and can then compare offers from real estate agents specifically.
View current location data on residents, WOZ development, housing stock, energy consumption, business activity and safety in Odoorn. In 2026 were there 2.018 residents. The average WOZ value in 2025 is EUR 334.000.
These figures help to better assess and compare the housing stock in Odoorn with recent sold homes. Orient yourself then on suitable top real estate agents in Odoorn for sales advice in this region.
Residents
2.018
Last year: 2026
Average WOZ
EUR 334.000
Last year: 2025
Average income per person.
EUR 31.500
Source: AllNumbers
Crimes (current year)
15
Total registered
| Year | Residents |
|---|---|
| 2021 | 1.890 |
| 2022 | 1.900 |
| 2023 | 1.910 |
| 2024 | 1.960 |
| 2025 | 1.990 |
| 2026 | 2.018 |
| Year | Average WOZ |
|---|---|
| 2021 | EUR 250.000 |
| 2022 | EUR 277.000 |
| 2023 | EUR 322.000 |
| 2024 | EUR 330.000 |
| 2025 | EUR 334.000 |
Hoger
400
Praktisch
280
Middelbaar
670
Europa
75
Nederland
1.800
Buiten Europa
105
Label C
250
Label A
153
Label B
143
Label D
121
Label G
72
Label F
61
Label E
17
Label A+
16
Label A++++
13
Label A++
5
Label A+++
4
Label A+++++
0
| Year | Gas (m3) | Electricity (kWh) |
|---|---|---|
| 2020 | 1.610 | 2.980 |
| 2021 | 1.800 | 2.970 |
| 2022 | 1.420 | 2.820 |
| 2023 | 1.150 | 2.630 |
| 2024 | 1.080 | 2.680 |
Hoekwoning
Gas: 1.000 • Electricity: 2.020
Huurwoning
Gas: 910 • Electricity: 1.730
Koopwoning
Gas: 1.260 • Electricity: 3.030
Appartement
Gas: 780 • Electricity: 1.390
Tussenwoning
Gas: 1.020 • Electricity: 2.110
Vrijstaande woning
Gas: 1.370 • Electricity: 3.430
Twee-onder-één-kap woning
Gas: 1.120 • Electricity: 2.420
Total number of company establishments: 195
| Period | Crimes |
|---|---|
| jan 2026 | 1 |
| jul 2025 | 1 |
| jun 2025 | 1 |
| mei 2025 | 2 |
| mrt 2025 | 0 |
| mrt 2026 | 0 |
| nov 2024 | 1 |
| nov 2025 | 2 |
| okt 2024 | 1 |
| okt 2025 | 2 |
| sep 2024 | 1 |
| sep 2025 | 1 |
These figures give an indicative picture of safety trends in the living environment of Odoorn.
Short answers based on current local statistics, handy for a quick comparison of the living environment.
Odoorn telt in 2026 ongeveer 2.018 inwoners.
De gemiddelde WOZ-waarde in Odoorn is in 2025 circa € 334.000.
Het gemiddelde inkomen per inwoner in Odoorn ligt rond € 31.500 per jaar.
Voor het huidige jaar gaat het om ongeveer 15 geregistreerde misdrijven. Gebruik deze cijfers als indicatie en vergelijk trends per periode.
In Odoorn komt vooral "Vrijstaande woningen" veel voor, met ongeveer 368 woningen.