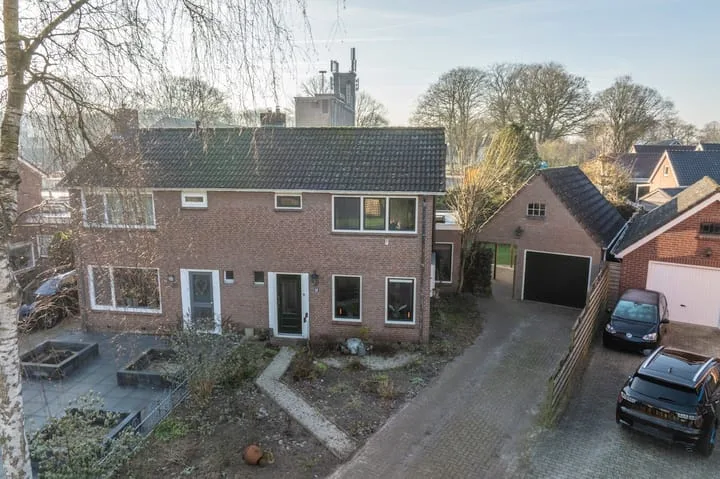
- Sold
Boshoflaan 10
7873AD Odoorn
€ 389.500 k.k.
€ 3.818/m²
- Living area
- 102 m²
- Land area
- 612 m²
- Bedrooms
- 3
View 22 sold houses in Odoorn
Type to search. Use arrow down and arrow up to navigate through results and press Enter to open.
Hidden search suggestions.
Compare sold homes in Odoorn or view the current offering in this location directly.
On this page you will find recently sold homes in Odoorn. Use this overview to better estimate selling prices, popular neighborhoods, and the local housing supply before you choose a real estate agent. Also view the current housing supply with 25 houses in Odoorn.
7873AD Odoorn
€ 389.500 k.k.
€ 3.818/m²
7873CD Odoorn
€ 399.000 k.k.
€ 2.955/m²
7873CA Odoorn
€ 545.000 k.k.
€ 4.467/m²
7873AH Odoorn
€ 375.000 k.k.
€ 3.125/m²
7873AV Odoorn
€ 749.000 k.k.
€ 4.255/m²
7873AH Odoorn
€ 320.000 k.k.
€ 3.516/m²
7873CB Odoorn
€ 525.000 k.k.
€ 3.723/m²
7873CM Odoorn
€ 485.000 k.k.
€ 2.921/m²
7873AK Odoorn
€ 369.000 k.k.
€ 3.448/m²
7873AB Odoorn
€ 525.000 k.k.
€ 3.645/m²
7873CV Odoorn
€ 369.500 k.k.
€ 3.299/m²
7873CV Odoorn
Price upon request
7873DB Odoorn
€ 549.000 k.k.
€ 3.866/m²
7873BP Odoorn
€ 575.000 k.k.
€ 4.227/m²
7873CZ Odoorn
€ 545.000 k.k.
€ 4.360/m²
7873CA Odoorn
€ 625.000 k.k.
€ 0/m²
7873CA Odoorn
€ 545.000 k.k.
€ 3.168/m²
7873BN Odoorn
€ 925.000 k.k.
€ 1.640/m²
7873TC Odoorn
€ 665.000 k.k.
€ 3.243/m²
7873CX Odoorn
€ 485.000 k.k.
€ 3.299/m²
7873CM Odoorn
€ 387.500 k.k.
€ 3.003/m²
7873AV Odoorn
€ 585.000 k.k.
€ 3.588/m²
Bekijk recente verkopen en ontvang gratis offertes van lokale makelaars. Vergelijk meer dan 24 makelaars in Odoorn.
Zelf je woning verkopen in Odoorn? Vergelijk verkoopmakelaars in Odoorn of bekijk de beste verkoopmakelaars in Odoorn als referentie bij jouw keuze.
Makelaars maken scherpere voorstellen als ze weten dat je vergelijkt — vraag offertes aan voor verkoop of aankoop.
Short answers about housing prices, sold homes and comparing real estate agents in Odoorn.
De kosten van een makelaar in Odoorn verschillen per kantoor, woningtype en verkoopaanpak. In Odoorn kun je 24 real estate agents vergelijken; bekijk daarom ook de makelaars in Odoorn om tarieven, presentatie en lokale ervaring beter naast elkaar te zetten.
On this page we currently show 22 sold houses in Odoorn from our selection. This helps you to better assess recent transactions and the local housing market.
Houses sold in Odoorn give insight into asking prices, house types and neighborhoods where recent transactions have taken place. Compare this also with the current housing stock in Odoorn to better understand the market.
You can use sold homes as a first market indication, but a local real estate agent can better take into account finishing, location, maintenance and current demand in Odoorn.
Vergelijk de 24 real estate agents in Odoorn op lokale verkoopervaring, reviews, verwachte opbrengst, courtage en marketingaanpak. Bekijk verkoopmakelaars in Odoorn of de top 10 makelaars in Odoorn om snel sterke kantoren te ontdekken.
View current location data on residents, WOZ development, housing stock, energy consumption, business activity and safety in Odoorn. In 2026 were there 2.018 residents. The average WOZ value in 2025 is EUR 334.000.
These figures help to better assess and compare the housing stock in Odoorn with recent sold homes. Orient yourself then on suitable top real estate agents in Odoorn for sales advice in this region.
Residents
2.018
Last year: 2026
Average WOZ
EUR 334.000
Last year: 2025
Average income per person.
EUR 31.500
Source: AllNumbers
Crimes (current year)
15
Total registered
| Year | Residents |
|---|---|
| 2021 | 1.890 |
| 2022 | 1.900 |
| 2023 | 1.910 |
| 2024 | 1.960 |
| 2025 | 1.990 |
| 2026 | 2.018 |
| Year | Average WOZ |
|---|---|
| 2021 | EUR 250.000 |
| 2022 | EUR 277.000 |
| 2023 | EUR 322.000 |
| 2024 | EUR 330.000 |
| 2025 | EUR 334.000 |
Hoger
400
Praktisch
280
Middelbaar
670
Europa
75
Nederland
1.800
Buiten Europa
105
Label C
250
Label A
153
Label B
143
Label D
121
Label G
72
Label F
61
Label E
17
Label A+
16
Label A++++
13
Label A++
5
Label A+++
4
Label A+++++
0
| Year | Gas (m3) | Electricity (kWh) |
|---|---|---|
| 2020 | 1.610 | 2.980 |
| 2021 | 1.800 | 2.970 |
| 2022 | 1.420 | 2.820 |
| 2023 | 1.150 | 2.630 |
| 2024 | 1.080 | 2.680 |
Hoekwoning
Gas: 1.000 • Electricity: 2.020
Huurwoning
Gas: 910 • Electricity: 1.730
Koopwoning
Gas: 1.260 • Electricity: 3.030
Appartement
Gas: 780 • Electricity: 1.390
Tussenwoning
Gas: 1.020 • Electricity: 2.110
Vrijstaande woning
Gas: 1.370 • Electricity: 3.430
Twee-onder-één-kap woning
Gas: 1.120 • Electricity: 2.420
Total number of company establishments: 195
| Period | Crimes |
|---|---|
| jan 2026 | 1 |
| jul 2025 | 1 |
| jun 2025 | 1 |
| mei 2025 | 2 |
| mrt 2025 | 0 |
| mrt 2026 | 0 |
| nov 2024 | 1 |
| nov 2025 | 2 |
| okt 2024 | 1 |
| okt 2025 | 2 |
| sep 2024 | 1 |
| sep 2025 | 1 |
These figures give an indicative picture of safety trends in the living environment of Odoorn.
Short answers based on current local statistics, handy for a quick comparison of the living environment.
Odoorn telt in 2026 ongeveer 2.018 inwoners.
De gemiddelde WOZ-waarde in Odoorn is in 2025 circa € 334.000.
Het gemiddelde inkomen per inwoner in Odoorn ligt rond € 31.500 per jaar.
Voor het huidige jaar gaat het om ongeveer 15 geregistreerde misdrijven. Gebruik deze cijfers als indicatie en vergelijk trends per periode.
In Odoorn komt vooral "Vrijstaande woningen" veel voor, met ongeveer 368 woningen.