- Available
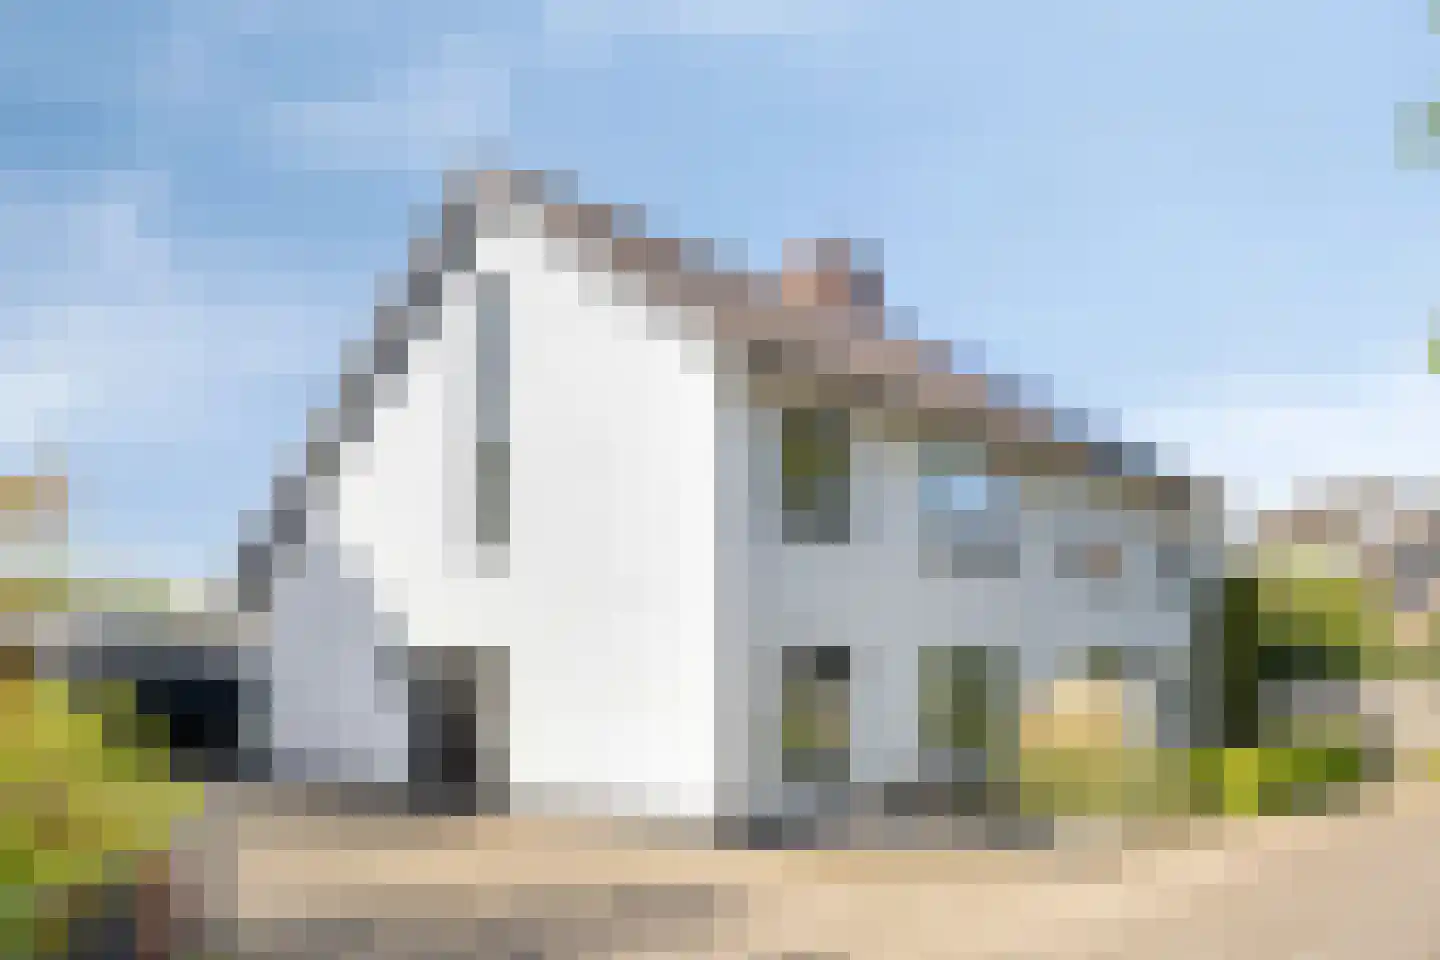
Burg. Verwielstraat 25
5061JA Oisterwijk
€ 1.290.000 k.k.
€ 6.202/m²
- Living area
- 208 m²
- Land area
- 190 m²
- Bedrooms
- 5
Searching in 249 houses in Oisterwijk
Type to search. Use arrow down and arrow up to navigate through results and press Enter to open.
Hidden search suggestions.
View current properties in Oisterwijk or search targeted on street, postal code and property characteristics.
View the current housing stock in Oisterwijk and quickly filter by price, living area, rooms and more. There are currently 249 houses in this place within our selection. View also 161 sold houses in Oisterwijk for extra insight into the local housing market.
5061JA Oisterwijk
€ 1.290.000 k.k.
€ 6.202/m²
5062SE Oisterwijk
€ 2.935.000 k.k.
€ 6.596/m²
5062AA Oisterwijk
€ 2.250.000 k.k.
€ 6.818/m²
5062JV Oisterwijk
€ 2.875.000 k.k.
€ 6.319/m²
5062DC Oisterwijk
€ 1.300.000 k.k.
€ 5.462/m²
5061HW Oisterwijk
€ 1.750.000 k.k.
€ 5.435/m²
5062CD Oisterwijk
€ 2.850.000 k.k.
€ 7.422/m²
5062JX Oisterwijk
€ 2.695.000 k.k.
€ 5.638/m²
5062GB Oisterwijk
€ 979.000 k.k.
€ 6.527/m²
5061GM Oisterwijk
€ 349.000 k.k.
€ 4.986/m²
5061AP Oisterwijk
€ 369.000 k.k.
€ 3.804/m²
5062EM Oisterwijk
€ 425.000 k.k.
€ 4.775/m²
5061AR Oisterwijk
€ 445.000 k.k.
€ 4.363/m²
5062SB Oisterwijk
€ 895.000 k.k.
€ 4.891/m²
5061LB Oisterwijk
€ 515.000 k.k.
€ 4.725/m²
5061ZB Oisterwijk
€ 435.000 k.k.
€ 3.398/m²
5062CJ Oisterwijk
€ 895.000 k.k.
5062GD Oisterwijk
€ 895.000 k.k.
5061PV Oisterwijk
€ 469.000 k.k.
5062NA Oisterwijk
€ 1.095.000 k.k.
5061BD Oisterwijk
€ 495.000 k.k.
€ 4.459/m²
5063CS Oisterwijk
€ 729.000 k.k.
€ 4.673/m²
5061AX Oisterwijk
€ 629.000 k.k.
€ 4.493/m²
5061AT Oisterwijk
€ 675.000 k.k.
€ 4.655/m²
5062LR Oisterwijk
€ 465.000 k.k.
€ 3.720/m²
5061EG Oisterwijk
€ 450.000 k.k.
€ 5.488/m²
5062AW Oisterwijk
€ 1.165.000 k.k.
€ 5.248/m²
5061AL Oisterwijk
€ 395.000 k.k.
€ 3.465/m²
Get free quotes from real estate agents with local market knowledge. Compare more than 90 real estate agents in Oisterwijk.
Selling a home in Oisterwijk? View the sales-oriented guide sell a house in Oisterwijk, compare all real estate agents in Oisterwijk or view the top 10 real estate agents in Oisterwijk for extra context to your choice.
Real estate agents make sharper offers when they know you're comparing — ask for quotes for sale or purchase.
Practical answers about housing supply, sales and comparing real estate agents in Oisterwijk.
The costs of a real estate agent in Oisterwijk depend on commission, setup costs, property presentation and the chosen service. Compare the 90 real estate agents in Oisterwijk via the real estate agent page and request multiple quotes to compare rates and approach well.
Within our selection, we are currently showing 249 houses in Oisterwijk. View also the sold houses in Oisterwijk to compare the current offering with recent transactions.
Take into account not only price and living area but also maintenance, energy label, location, outdoor space and sales status. This way you compare houses in Oisterwijk on more than just the asking price.
A local real estate agent knows the neighborhoods, recent transactions and demand in Oisterwijk. By comparing 90 real estate agents in the region you get a better insight into prices, sales strategy and expected yield; the top 10 in Oisterwijk provides a useful starting point.
Yes, when making a sales plan, a valuation in Oisterwijk is wise. You gain insight into a realistic asking price and can then compare offers from real estate agents specifically.
View current location data on residents, WOZ development, housing stock, energy consumption, business activity and safety in Oisterwijk. In 2025 were there 20.625 residents. The average WOZ value in 2025 is EUR 512.468.
These figures help to better assess and compare the housing stock in Oisterwijk with recent sold homes. Orient yourself then on suitable top real estate agents in Oisterwijk for sales advice in this region.
Residents
20.625
Last year: 2025
Average WOZ
EUR 512.468
Last year: 2025
Average income per person.
EUR 18.591
Source: AllNumbers
Crimes (current year)
765
Total registered
| Year | Residents |
|---|---|
| 2021 | 20.164 |
| 2022 | 20.101 |
| 2023 | 20.425 |
| 2024 | 20.475 |
| 2025 | 20.625 |
| Year | Average WOZ |
|---|---|
| 2021 | EUR 369.020 |
| 2022 | EUR 412.966 |
| 2023 | EUR 469.073 |
| 2024 | EUR 489.434 |
| 2025 | EUR 512.468 |
Hoger
5.000
Praktisch
3.390
Middelbaar
6.150
Europa
1.495
Nederland
16.910
Buiten Europa
2.220
Label C
2.785
Label A
2.544
Label B
1.362
Label D
1.075
Label G
601
Label F
582
Label E
346
Label A+
175
Label A+++
94
Label A++
79
Label A++++
33
Label A+++++
2
| Year | Gas (m3) | Electricity (kWh) |
|---|---|---|
| 2020 | 1.292 | 3.188 |
| 2021 | 1.465 | 3.243 |
| 2022 | 1.139 | 3.049 |
| 2023 | 972 | 2.865 |
| 2024 | 938 | 2.927 |
Hoekwoning
Gas: 930 • Electricity: 2.667
Huurwoning
Gas: 800 • Electricity: 2.226
Koopwoning
Gas: 1.055 • Electricity: 3.173
Appartement
Gas: 623 • Electricity: 1.803
Tussenwoning
Gas: 843 • Electricity: 2.595
Vrijstaande woning
Gas: 1.442 • Electricity: 3.993
Twee-onder-één-kap woning
Gas: 1.114 • Electricity: 3.157
Total number of company establishments: 3.475
| Period | Crimes |
|---|---|
| jan 2026 | 41 |
| jul 2025 | 68 |
| jun 2025 | 61 |
| mei 2025 | 99 |
| mrt 2025 | 71 |
| mrt 2026 | 73 |
| nov 2024 | 76 |
| nov 2025 | 43 |
| okt 2024 | 71 |
| okt 2025 | 64 |
| sep 2024 | 76 |
| sep 2025 | 55 |
These figures give an indicative picture of safety trends in the living environment of Oisterwijk.
Short answers based on current local statistics, handy for a quick comparison of the living environment.
Oisterwijk telt in 2025 ongeveer 20.625 inwoners.
De gemiddelde WOZ-waarde in Oisterwijk is in 2025 circa € 512.468.
Het gemiddelde inkomen per inwoner in Oisterwijk ligt rond € 18.591 per jaar.
Voor het huidige jaar gaat het om ongeveer 765 geregistreerde misdrijven. Gebruik deze cijfers als indicatie en vergelijk trends per periode.
In Oisterwijk komt vooral "Tussenwoningen" veel voor, met ongeveer 2.969 woningen.