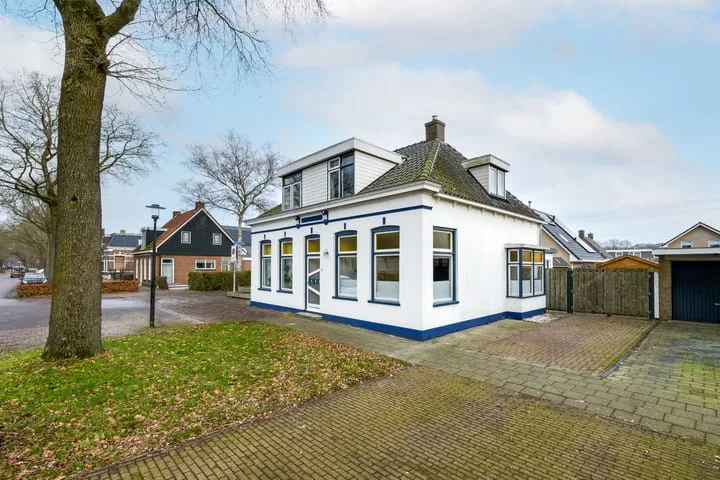
Houses sold in Oudeschoot

View 10 sold houses in Oudeschoot

Connected to: Vastgoed Nederland NVM Makelaars

On this page you will find recently sold homes in Oudeschoot. Use this overview to better estimate selling prices, popular neighborhoods, and the local housing supply before you choose a real estate agent. Also view the current housing supply with 14 houses in Oudeschoot.

Selection

Search and filter homes

Set your preferences and discover homes that suit you.

Total supply 242.483
Filters

Set price, area and other characteristics. Adjust a filter or click on Show homes. Location changes directly above.

Reset filters

You search for

  • Place Oudeschoot
  • Status Sold

Huis verkopen in Oudeschoot? Vergelijk verkoopmakelaars

Bekijk recente verkopen en ontvang gratis offertes van lokale makelaars. Vergelijk meer dan 26 makelaars in Oudeschoot.

Free request a quote

  • Quotes in Oudeschoot
  • Non-binding
  • Personal
  • Gratis tarieven vergelijken

Zelf je woning verkopen in Oudeschoot? Vergelijk verkoopmakelaars in Oudeschoot of bekijk de beste verkoopmakelaars in Oudeschoot als referentie bij jouw keuze.

Vergelijk meerdere offertes

Makelaars maken scherpere voorstellen als ze weten dat je vergelijkt — vraag offertes aan voor verkoop of aankoop.

Frequently asked questions about sold homes in Oudeschoot

Short answers about housing prices, sold homes and comparing real estate agents in Oudeschoot.

Residential and neighborhood statistics in Oudeschoot

View current location data on residents, WOZ development, housing stock, energy consumption, business activity and safety in Oudeschoot. In 2025 were there 1.212 residents. The average WOZ value in 2025 is EUR 281.000.

These figures help to better assess and compare the housing stock in Oudeschoot with recent sold homes. Orient yourself then on suitable top real estate agents in Oudeschoot for sales advice in this region.

Residents

1.212

Last year: 2025

Average WOZ

EUR 281.000

Last year: 2025

Average income per person.

EUR 25.400

Source: AllNumbers

Crimes (current year)

46

Total registered

Demographics and WOZ development

Inhabitants per year

Inhabitants per year in Oudeschoot
Year Residents
2021 1.237
2022 1.225
2023 1.258
2024 1.220
2025 1.212

Annual WOZ value

WOZ value per year in Oudeschoot
Year Average WOZ
2021 EUR 206.000
2022 EUR 225.000
2023 EUR 264.000
2024 EUR 275.000
2025 EUR 281.000

Composition of residents

Age build-up

65+: 256 0-15: 198 15-25: 132 25-45: 284 45-65: 338

Education level

Hoger

165

Praktisch

355

Middelbaar

371

Origin of residents (2025)

Europa

74

Nederland

1.018

Buiten Europa

115

Housing stock and construction periods

Types of homes

Hoekwoningen 112
Appartementen 15
Tussenwoningen 280
Vrijstaande woningen 172
Twee-onder-één-kap woningen 63

Construction period of buildings

Voor 1700 0
1700 tot 1900 42
1900 tot 1925 75
1925 tot 1950 39
1950 tot 1970 473
1970 tot 1980 30
1980 tot 1990 7
1990 tot 2000 23
2000 tot 2010 27
2010 tot 2020 3
2020 en later 15

Energy and sustainability

Energy label distribution

Label A

182

Label C

124

Label G

100

Label E

64

Label D

55

Label F

55

Label B

51

Label A+++

11

Label A++++

4

Label A+

2

Label A++

0

Label A+++++

0

Average energy consumption per year

Average energy consumption per year in Oudeschoot
Year Gas (m3) Electricity (kWh)
2020 1.190 2.750
2021 1.360 2.780
2022 1.060 2.640
2023 890 2.570
2024 870 2.590

Consumption per house type

Hoekwoning

Gas: 770 • Electricity: 2.340

Huurwoning

Gas: 730 • Electricity: 2.180

Koopwoning

Gas: 1.040 • Electricity: 2.940

Appartement

Gas: 900 • Electricity: 2.300

Tussenwoning

Gas: 700 • Electricity: 2.130

Vrijstaande woning

Gas: 1.220 • Electricity: 3.360

Twee-onder-één-kap woning

Gas: 1.030 • Electricity: 2.850

Business activity in Oudeschoot (2025)

Handel en HORECA 49
Nijverheid en energie 33
Zakelijke dienstverlening 29
Overheid, onderwijs en zorg 21
Landbouw, bosbouw en visserij 4
Vervoer, informatie en communicatie 8
Financiele diensten en onroerendgoed 4
Cultuur, recreatie en overige diensten 16

Total number of company establishments: 165

Recent crime statistics

Recent crime statistics in Oudeschoot
Period Crimes
jan 2025 4
jan 2026 4
jul 2025 6
jun 2025 4
mei 2025 5
mrt 2025 3
nov 2024 1
nov 2025 3
okt 2024 1
okt 2025 6
sep 2024 2
sep 2025 3

These figures give an indicative picture of safety trends in the living environment of Oudeschoot.

Frequently asked questions about living in Oudeschoot

Short answers based on current local statistics, handy for a quick comparison of the living environment.

Hoeveel inwoners heeft Oudeschoot?

Oudeschoot telt in 2025 ongeveer 1.212 inwoners.

Wat is de gemiddelde WOZ-waarde in Oudeschoot?

De gemiddelde WOZ-waarde in Oudeschoot is in 2025 circa € 281.000.

Wat is het gemiddelde inkomen per inwoner in Oudeschoot?

Het gemiddelde inkomen per inwoner in Oudeschoot ligt rond € 25.400 per jaar.

Hoe veilig is wonen in Oudeschoot?

Voor het huidige jaar gaat het om ongeveer 46 geregistreerde misdrijven. Gebruik deze cijfers als indicatie en vergelijk trends per periode.

Welke woningtypen komen het meest voor in Oudeschoot?

In Oudeschoot komt vooral "Tussenwoningen" veel voor, met ongeveer 280 woningen.

Gratis vrijblijvende offertes ontvangen

Vergelijk meerdere makelaars en kies de beste match.