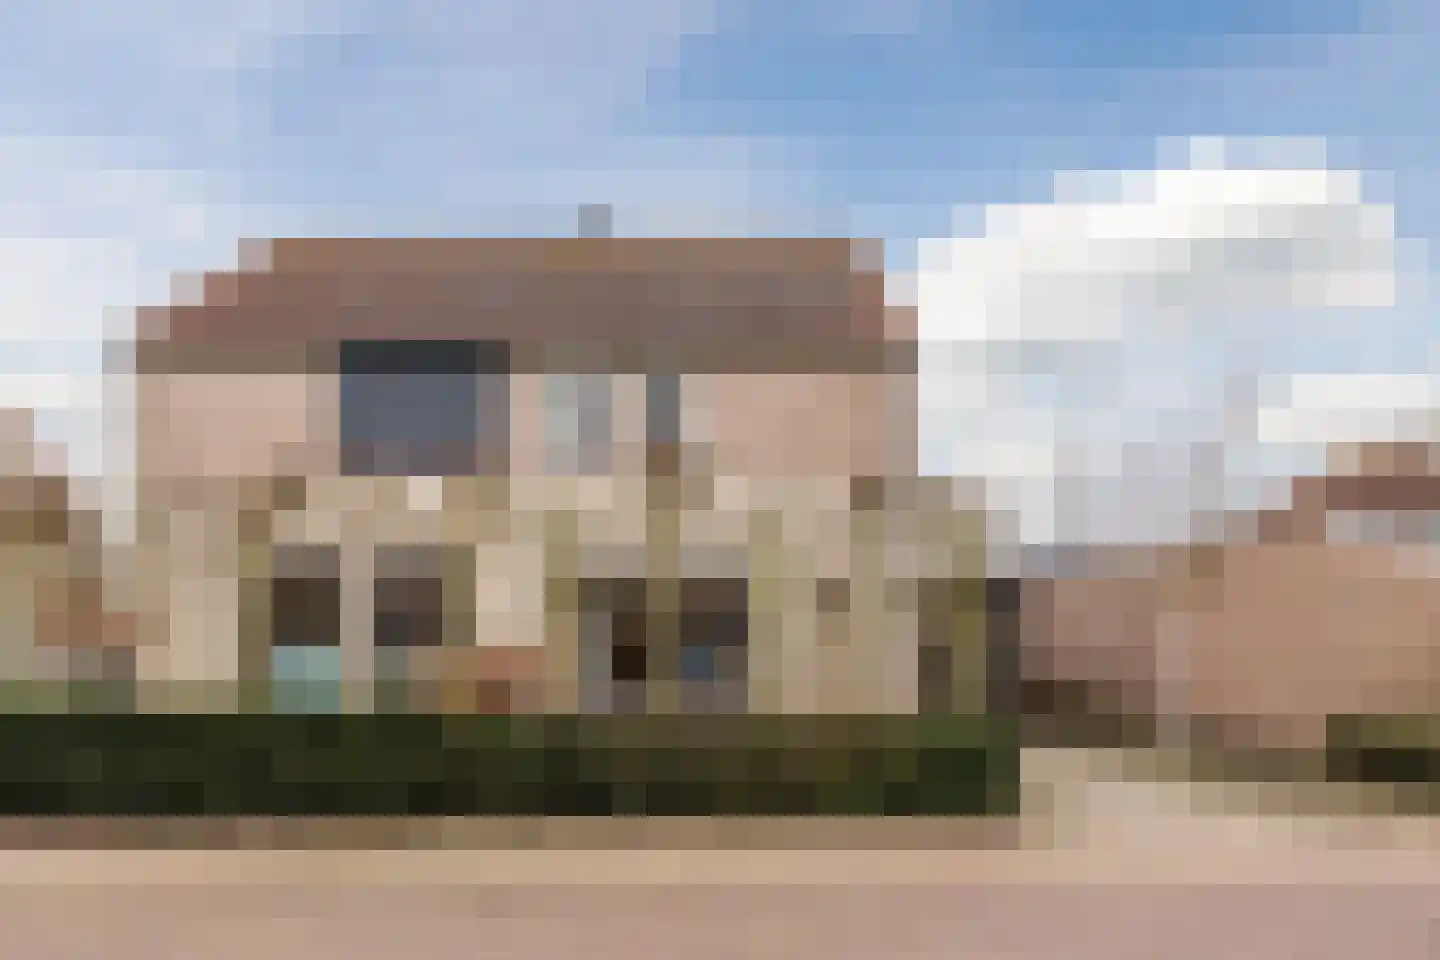
Houses sold in Rilland

View 20 sold houses in Rilland

Connected to: Vastgoed Nederland NVM Makelaars

On this page you will find recently sold homes in Rilland. Use this overview to better estimate selling prices, popular neighborhoods, and the local housing supply before you choose a real estate agent. Also view the current housing supply with 28 houses in Rilland.

Selection

Search and filter homes

Set your preferences and discover homes that suit you.

Total supply 241.453
Filters

Set price, area and other characteristics. Adjust a filter or click on Show homes. Location changes directly above.

Reset filters

You search for

  • Place Rilland
  • Status Sold

Huis verkopen in Rilland? Vergelijk verkoopmakelaars

Bekijk recente verkopen en ontvang gratis offertes van lokale verkoopmakelaars in Rilland.

Free request a quote

  • Quotes in Rilland
  • Non-binding
  • Personal
  • Gratis tarieven vergelijken

Zelf je woning verkopen in Rilland? Vergelijk verkoopmakelaars in Rilland of bekijk de beste verkoopmakelaars in Rilland als referentie bij jouw keuze.

Vergelijk meerdere offertes

Makelaars maken scherpere voorstellen als ze weten dat je vergelijkt — vraag offertes aan voor verkoop of aankoop.

Frequently asked questions about sold homes in Rilland

Short answers about housing prices, sold homes and comparing real estate agents in Rilland.

Residential and neighborhood statistics in Rilland

View current location data on residents, WOZ development, housing stock, energy consumption, business activity and safety in Rilland. In 2025 were there 3.030 residents. The average WOZ value in 2025 is EUR 295.000.

These figures help to better assess and compare the housing stock in Rilland with recent sold homes. Orient yourself then on suitable top real estate agents in Rilland for sales advice in this region.

Residents

3.030

Last year: 2025

Average WOZ

EUR 295.000

Last year: 2025

Average income per person.

EUR 31.000

Source: AllNumbers

Crimes (current year)

147

Total registered

Demographics and WOZ development

Inhabitants per year

Inhabitants per year in Rilland
Year Residents
2021 3.015
2022 3.000
2023 2.990
2024 2.990
2025 3.030

Annual WOZ value

WOZ value per year in Rilland
Year Average WOZ
2021 EUR 212.000
2022 EUR 222.000
2023 EUR 257.000
2024 EUR 282.000
2025 EUR 295.000

Composition of residents

Age build-up

65+: 595 0-15: 440 15-25: 335 25-45: 810 45-65: 845

Education level

Hoger

550

Praktisch

620

Middelbaar

1.110

Origin of residents (2025)

Europa

625

Nederland

2.095

Buiten Europa

315

Housing stock and construction periods

Types of homes

Hoekwoningen 243
Appartementen 131
Tussenwoningen 321
Vrijstaande woningen 399
Twee-onder-één-kap woningen 234

Construction period of buildings

Voor 1700 0
1700 tot 1900 49
1900 tot 1925 157
1925 tot 1950 204
1950 tot 1970 379
1970 tot 1980 188
1980 tot 1990 113
1990 tot 2000 194
2000 tot 2010 110
2010 tot 2020 50
2020 en later 110

Energy and sustainability

Energy label distribution

Label C

309

Label B

237

Label G

208

Label A

166

Label F

117

Label D

116

Label E

107

Label A++++

76

Label A+

9

Label A++

2

Label A+++

0

Label A+++++

0

Average energy consumption per year

Average energy consumption per year in Rilland
Year Gas (m3) Electricity (kWh)
2020 1.180 2.700
2021 1.350 2.940
2022 1.050 2.780
2023 890 2.710
2024 890 2.780

Consumption per house type

Hoekwoning

Gas: 840 • Electricity: 2.420

Huurwoning

Gas: 790 • Electricity: 2.050

Koopwoning

Gas: 940 • Electricity: 3.010

Appartement

Gas: 650 • Electricity: 1.960

Tussenwoning

Gas: 770 • Electricity: 2.180

Vrijstaande woning

Gas: 1.090 • Electricity: 3.540

Twee-onder-één-kap woning

Gas: 910 • Electricity: 2.630

Business activity in Rilland (2025)

Handel en HORECA 80
Nijverheid en energie 95
Zakelijke dienstverlening 55
Overheid, onderwijs en zorg 55
Landbouw, bosbouw en visserij 45
Vervoer, informatie en communicatie 30
Financiele diensten en onroerendgoed 10
Cultuur, recreatie en overige diensten 25

Total number of company establishments: 390

Recent crime statistics

Recent crime statistics in Rilland
Period Crimes
jan 2026 15
jul 2025 24
jun 2025 14
mei 2025 17
mrt 2025 7
mrt 2026 16
nov 2024 11
nov 2025 7
okt 2024 8
okt 2025 10
sep 2024 7
sep 2025 14

These figures give an indicative picture of safety trends in the living environment of Rilland.

Frequently asked questions about living in Rilland

Short answers based on current local statistics, handy for a quick comparison of the living environment.

Hoeveel inwoners heeft Rilland?

Rilland telt in 2025 ongeveer 3.030 inwoners.

Wat is de gemiddelde WOZ-waarde in Rilland?

De gemiddelde WOZ-waarde in Rilland is in 2025 circa € 295.000.

Wat is het gemiddelde inkomen per inwoner in Rilland?

Het gemiddelde inkomen per inwoner in Rilland ligt rond € 31.000 per jaar.

Hoe veilig is wonen in Rilland?

Voor het huidige jaar gaat het om ongeveer 147 geregistreerde misdrijven. Gebruik deze cijfers als indicatie en vergelijk trends per periode.

Welke woningtypen komen het meest voor in Rilland?

In Rilland komt vooral "Vrijstaande woningen" veel voor, met ongeveer 399 woningen.

Gratis vrijblijvende offertes ontvangen

Vergelijk meerdere makelaars en kies de beste match.