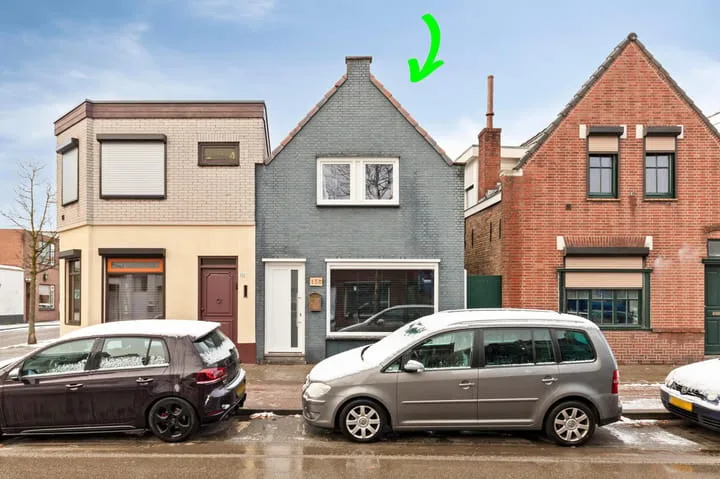
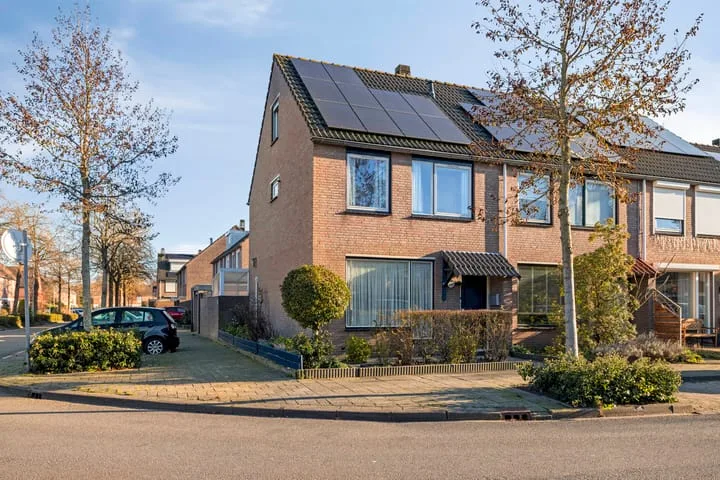
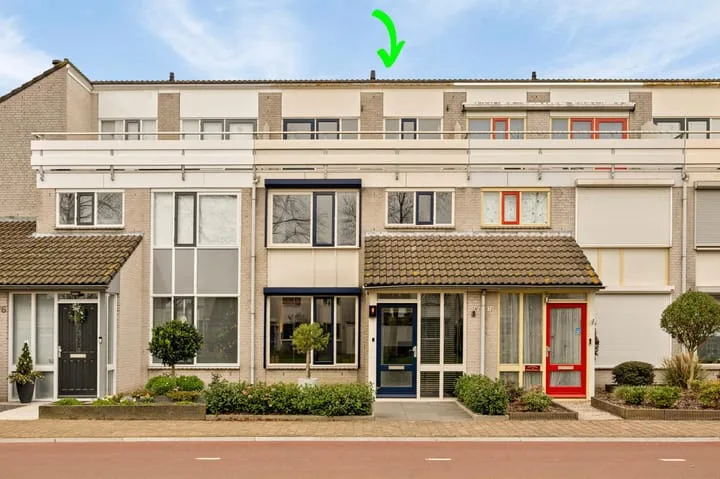
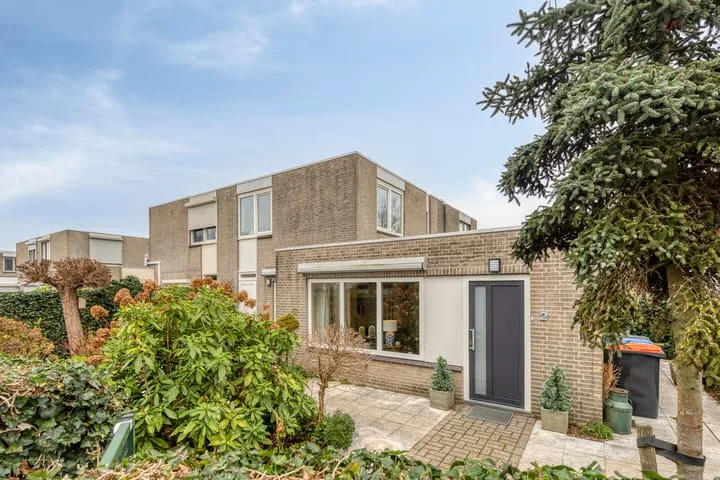
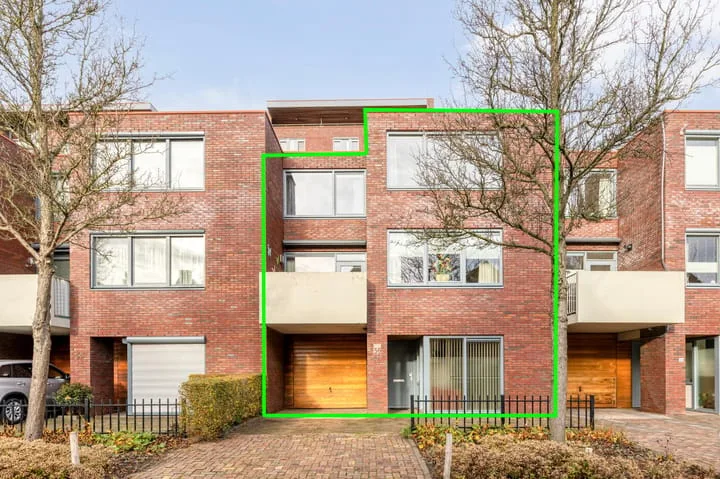
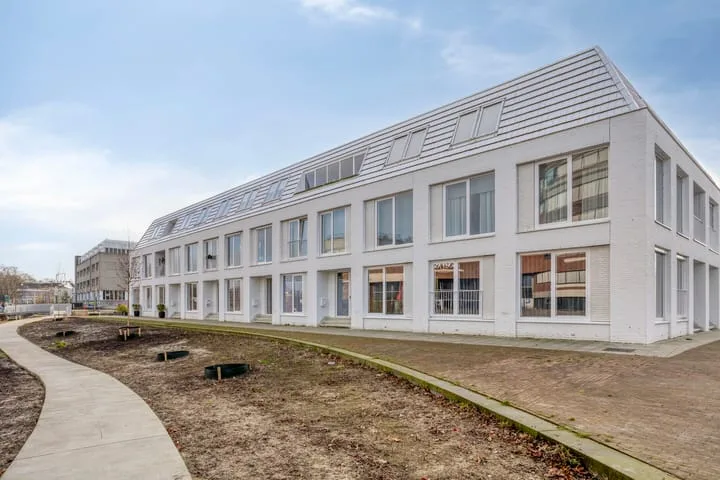
- Sold
Molenstraat 59
4701JN Roosendaal
€ 219.500 k.k.
€ 3.484/m²
- Living area
- 63 m²
- Land area
- —
- Bedrooms
- 1
View 558 sold houses in Roosendaal
Type to search. Use arrow down and arrow up to navigate through results and press Enter to open.
Hidden search suggestions.
Compare sold homes in Roosendaal or view the current offering in this location directly.
On this page you will find recently sold homes in Roosendaal. Use this overview to better estimate selling prices, popular neighborhoods, and the local housing supply before you choose a real estate agent. Also view the current housing supply with 782 houses in Roosendaal.
4701JN Roosendaal
€ 219.500 k.k.
€ 3.484/m²
4701EZ Roosendaal
€ 299.000 k.k.
€ 3.476/m²
4701GP Roosendaal
€ 269.500 k.k.
€ 4.900/m²
4708KT Roosendaal
€ 439.500 k.k.
€ 3.460/m²
4707CT Roosendaal
€ 475.000 k.k.
€ 3.740/m²
4707NM Roosendaal
Price upon request
4701HG Roosendaal
€ 299.000 k.k.
€ 3.250/m²
4706AK Roosendaal
€ 325.000 k.k.
€ 3.571/m²
4708NP Roosendaal
€ 475.000 k.k.
€ 3.145/m²
4701GE Roosendaal
€ 259.000 k.k.
€ 4.316/m²
4701CB Roosendaal
€ 455.000 k.k.
€ 3.527/m²
4708BC Roosendaal
€ 469.000 k.k.
€ 3.908/m²
4707SK Roosendaal
€ 359.000 k.k.
€ 3.293/m²
4703LE Roosendaal
€ 325.000 k.k.
€ 3.915/m²
4708LP Roosendaal
€ 359.000 k.k.
€ 3.205/m²
4708EX Roosendaal
€ 350.000 k.k.
€ 3.571/m²
4707LR Roosendaal
€ 300.000 k.k.
€ 2.857/m²
4708HA Roosendaal
€ 360.000 k.k.
€ 4.137/m²
4703MZ Roosendaal
€ 757.000
€ 4.452/m²
4703MA Roosendaal
€ 615.000
€ 4.659/m²
4701CG Roosendaal
€ 450.000 k.k.
€ 3.040/m²
4703JW Roosendaal
€ 285.000 k.k.
€ 2.908/m²
4707WZ Roosendaal
€ 375.000 k.k.
€ 3.125/m²
4702EC Roosendaal
€ 390.000 k.k.
€ 3.000/m²
4703KK Roosendaal
€ 325.000 k.k.
€ 3.611/m²
4703HA Roosendaal
€ 195.000 k.k.
€ 5.000/m²
4701AX Roosendaal
€ 249.000 k.k.
€ 3.772/m²
4708MN Roosendaal
€ 365.000 k.k.
€ 3.650/m²
Bekijk recente verkopen en ontvang gratis offertes van lokale verkoopmakelaars in Roosendaal.
Recent verkocht in Roosendaal? Lees de verkoopgerichte gids huis verkopen in Roosendaal, vergelijk verkoopmakelaars in Roosendaal of bekijk de beste verkoopmakelaars in Roosendaal voor referentie bij jouw keuze.
Makelaars maken scherpere voorstellen als ze weten dat je vergelijkt — vraag offertes aan voor verkoop of aankoop.
Short answers about housing prices, sold homes and comparing real estate agents in Roosendaal.
The costs of a real estate agent in Roosendaal vary per office, property type and sales approach. Therefore, compare multiple quotes and also look at the real estate agents in Roosendaal to better compare rates, presentation and local experience.
On this page we currently show 558 sold houses in Roosendaal from our selection. This helps you to better assess recent transactions and the local housing market.
Houses sold in Roosendaal give insight into asking prices, house types and neighborhoods where recent transactions have taken place. Compare this also with the current housing stock in Roosendaal to better understand the market.
Je kunt verkochte woningen gebruiken als eerste marktindicatie, maar een lokale makelaar kan beter rekening houden met afwerking, ligging, onderhoud en actuele vraag in Roosendaal. Plan de volgende stap via de gids huis verkopen in Roosendaal.
Vergelijk makelaars in Roosendaal op lokale verkoopervaring, reviews, verwachte opbrengst, courtage en marketingaanpak. Bekijk verkoopmakelaars in Roosendaal of de top 10 makelaars in Roosendaal om snel sterke kantoren te ontdekken.
View current location data on residents, WOZ development, housing stock, energy consumption, business activity and safety in Roosendaal. In 2025 were there 67.370 residents. The average WOZ value in 2025 is EUR 308.856.
These figures help to better assess and compare the housing stock in Roosendaal with recent sold homes. Orient yourself then on suitable top real estate agents in Roosendaal for sales advice in this region.
Residents
67.370
Last year: 2025
Average WOZ
EUR 308.856
Last year: 2025
Average income per person.
EUR 32.319
Source: AllNumbers
Crimes (current year)
3.924
Total registered
| Year | Residents |
|---|---|
| 2021 | 67.025 |
| 2022 | 67.000 |
| 2023 | 67.320 |
| 2024 | 67.235 |
| 2025 | 67.370 |
| Year | Average WOZ |
|---|---|
| 2021 | EUR 229.405 |
| 2022 | EUR 247.844 |
| 2023 | EUR 278.679 |
| 2024 | EUR 285.790 |
| 2025 | EUR 308.856 |
Hoger
13.720
Praktisch
15.300
Middelbaar
21.230
Europa
8.305
Nederland
45.380
Buiten Europa
13.685
Label C
9.297
Label A
6.760
Label B
5.831
Label D
3.028
Label G
2.019
Label E
2.016
Label F
1.491
Label A+
1.007
Label A++
484
Label A+++
378
Label A++++
183
Label A+++++
10
| Year | Gas (m3) | Electricity (kWh) |
|---|---|---|
| 2020 | 1.149 | 2.756 |
| 2021 | 1.287 | 2.777 |
| 2022 | 1.007 | 2.619 |
| 2023 | 870 | 2.482 |
| 2024 | 854 | 2.532 |
Hoekwoning
Gas: 999 • Electricity: 2.661
Huurwoning
Gas: 724 • Electricity: 1.964
Koopwoning
Gas: 973 • Electricity: 2.814
Appartement
Gas: 496 • Electricity: 1.732
Tussenwoning
Gas: 868 • Electricity: 2.461
Vrijstaande woning
Gas: 1.412 • Electricity: 3.648
Twee-onder-één-kap woning
Gas: 1.146 • Electricity: 2.964
Total number of company establishments: 8.175
| Period | Crimes |
|---|---|
| jan 2026 | 300 |
| jul 2025 | 315 |
| jun 2025 | 312 |
| mei 2025 | 297 |
| mrt 2025 | 342 |
| mrt 2026 | 339 |
| nov 2024 | 335 |
| nov 2025 | 394 |
| okt 2024 | 336 |
| okt 2025 | 364 |
| sep 2024 | 306 |
| sep 2025 | 279 |
These figures give an indicative picture of safety trends in the living environment of Roosendaal.
Short answers based on current local statistics, handy for a quick comparison of the living environment.
Roosendaal telt in 2025 ongeveer 67.370 inwoners.
De gemiddelde WOZ-waarde in Roosendaal is in 2025 circa € 308.856.
Het gemiddelde inkomen per inwoner in Roosendaal ligt rond € 32.319 per jaar.
Voor het huidige jaar gaat het om ongeveer 3.924 geregistreerde misdrijven. Gebruik deze cijfers als indicatie en vergelijk trends per periode.
In Roosendaal komt vooral "Tussenwoningen" veel voor, met ongeveer 12.036 woningen.