- Available
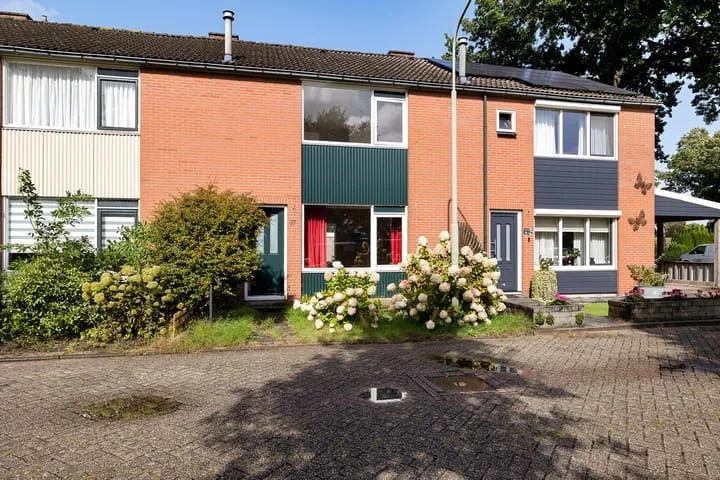
Roswinkelerstraat 141
7895AS Roswinkel
€ 450.000 k.k.
€ 2.273/m²
- Living area
- 198 m²
- Land area
- 1322 m²
- Bedrooms
- 8
Searching in 10 houses in Roswinkel
Type to search. Use arrow down and arrow up to navigate through results and press Enter to open.
Hidden search suggestions.
View current properties in Roswinkel or search targeted on street, postal code and property characteristics.
View the current housing stock in Roswinkel and quickly filter by price, living area, rooms and more. There are currently 10 houses in this place within our selection. View also 5 sold houses in Roswinkel for extra insight into the local housing market.
7895AS Roswinkel
€ 450.000 k.k.
€ 2.273/m²
7895AL Roswinkel
€ 335.000 k.k.
€ 2.055/m²
7895AN Roswinkel
€ 1.095.000 k.k.
€ 2.852/m²
7895AT Roswinkel
€ 1.395.000 k.k.
€ 3.770/m²
7895AM Roswinkel
€ 385.000 k.k.
€ 1.954/m²
7895TH Roswinkel
€ 589.000 k.k.
€ 4.530/m²
7895AD Roswinkel
€ 225.000 k.k.
€ 2.393/m²
7895AR Roswinkel
€ 525.000 k.k.
€ 3.088/m²
7895TV Roswinkel
€ 449.000 k.k.
€ 0/m²
7895TR Roswinkel
€ 419.500 k.k.
€ 4.033/m²
Get free quotes from real estate agents with local market knowledge. Compare more than 26 real estate agents in Roswinkel.
Selling a home in Roswinkel? Compare all real estate agents in Roswinkel or view the top 10 real estate agents in Roswinkel for extra context for your choice.
Real estate agents make sharper offers when they know you're comparing — ask for quotes for sale or purchase.
Practical answers about housing supply, sales and comparing real estate agents in Roswinkel.
The costs of a real estate agent in Roswinkel depend on commission, setup costs, property presentation and the chosen service. Compare the 26 real estate agents in Roswinkel via the real estate agent page and request multiple quotes to compare rates and approach well.
Within our selection, we are currently showing 10 houses in Roswinkel. View also the sold houses in Roswinkel to compare the current offering with recent transactions.
Take into account not only price and living area but also maintenance, energy label, location, outdoor space and sales status. This way you compare houses in Roswinkel on more than just the asking price.
A local real estate agent knows the neighborhoods, recent transactions and demand in Roswinkel. By comparing 26 real estate agents in the region you get a better insight into prices, sales strategy and expected yield; the top 10 in Roswinkel provides a useful starting point.
Yes, when making a sales plan, a valuation in Roswinkel is wise. You gain insight into a realistic asking price and can then compare offers from real estate agents specifically.
View current location data on residents, WOZ development, housing stock, energy consumption, business activity and safety in Roswinkel. In 2026 were there 847 residents. The average WOZ value in 2025 is EUR 318.000.
These figures help to better assess and compare the housing stock in Roswinkel with recent sold homes. Orient yourself then on suitable top real estate agents in Roswinkel for sales advice in this region.
Residents
847
Last year: 2026
Average WOZ
EUR 318.000
Last year: 2025
Average income per person.
EUR 29.400
Source: AllNumbers
Crimes (current year)
23
Total registered
| Year | Residents |
|---|---|
| 2021 | 820 |
| 2022 | 825 |
| 2023 | 825 |
| 2024 | 860 |
| 2025 | 850 |
| 2026 | 847 |
| Year | Average WOZ |
|---|---|
| 2021 | EUR 220.000 |
| 2022 | EUR 255.000 |
| 2023 | EUR 292.000 |
| 2024 | EUR 302.000 |
| 2025 | EUR 318.000 |
Hoger
100
Praktisch
210
Middelbaar
340
Europa
35
Nederland
785
Buiten Europa
30
Label G
139
Label C
65
Label A
41
Label B
39
Label F
32
Label D
30
Label E
18
Label A+
4
Label A++
1
Label A+++
1
Label A++++
0
Label A+++++
0
| Year | Gas (m3) | Electricity (kWh) |
|---|---|---|
| 2020 | 1.780 | 3.470 |
| 2021 | 2.040 | 3.630 |
| 2022 | 1.550 | 3.560 |
| 2023 | 1.250 | 3.290 |
| 2024 | 1.200 | 3.520 |
Hoekwoning
Gas: 1.140 • Electricity: 2.520
Huurwoning
Gas: 1.160 • Electricity: 2.770
Koopwoning
Gas: 1.260 • Electricity: 3.390
Appartement
Gas: 1.430 • Electricity: 3.240
Tussenwoning
Gas: 840 • Electricity: 2.210
Vrijstaande woning
Gas: 1.300 • Electricity: 3.480
Twee-onder-één-kap woning
Gas: 1.070 • Electricity: 2.860
Total number of company establishments: 125
| Period | Crimes |
|---|---|
| jan 2026 | 0 |
| jul 2025 | 1 |
| jun 2025 | 2 |
| mei 2025 | 5 |
| mrt 2025 | 0 |
| mrt 2026 | 2 |
| nov 2024 | 3 |
| nov 2025 | 2 |
| okt 2024 | 2 |
| okt 2025 | 2 |
| sep 2024 | 1 |
| sep 2025 | 1 |
These figures give an indicative picture of safety trends in the living environment of Roswinkel.
Short answers based on current local statistics, handy for a quick comparison of the living environment.
Roswinkel telt in 2026 ongeveer 847 inwoners.
De gemiddelde WOZ-waarde in Roswinkel is in 2025 circa € 318.000.
Het gemiddelde inkomen per inwoner in Roswinkel ligt rond € 29.400 per jaar.
Voor het huidige jaar gaat het om ongeveer 23 geregistreerde misdrijven. Gebruik deze cijfers als indicatie en vergelijk trends per periode.
In Roswinkel komt vooral "Vrijstaande woningen" veel voor, met ongeveer 278 woningen.