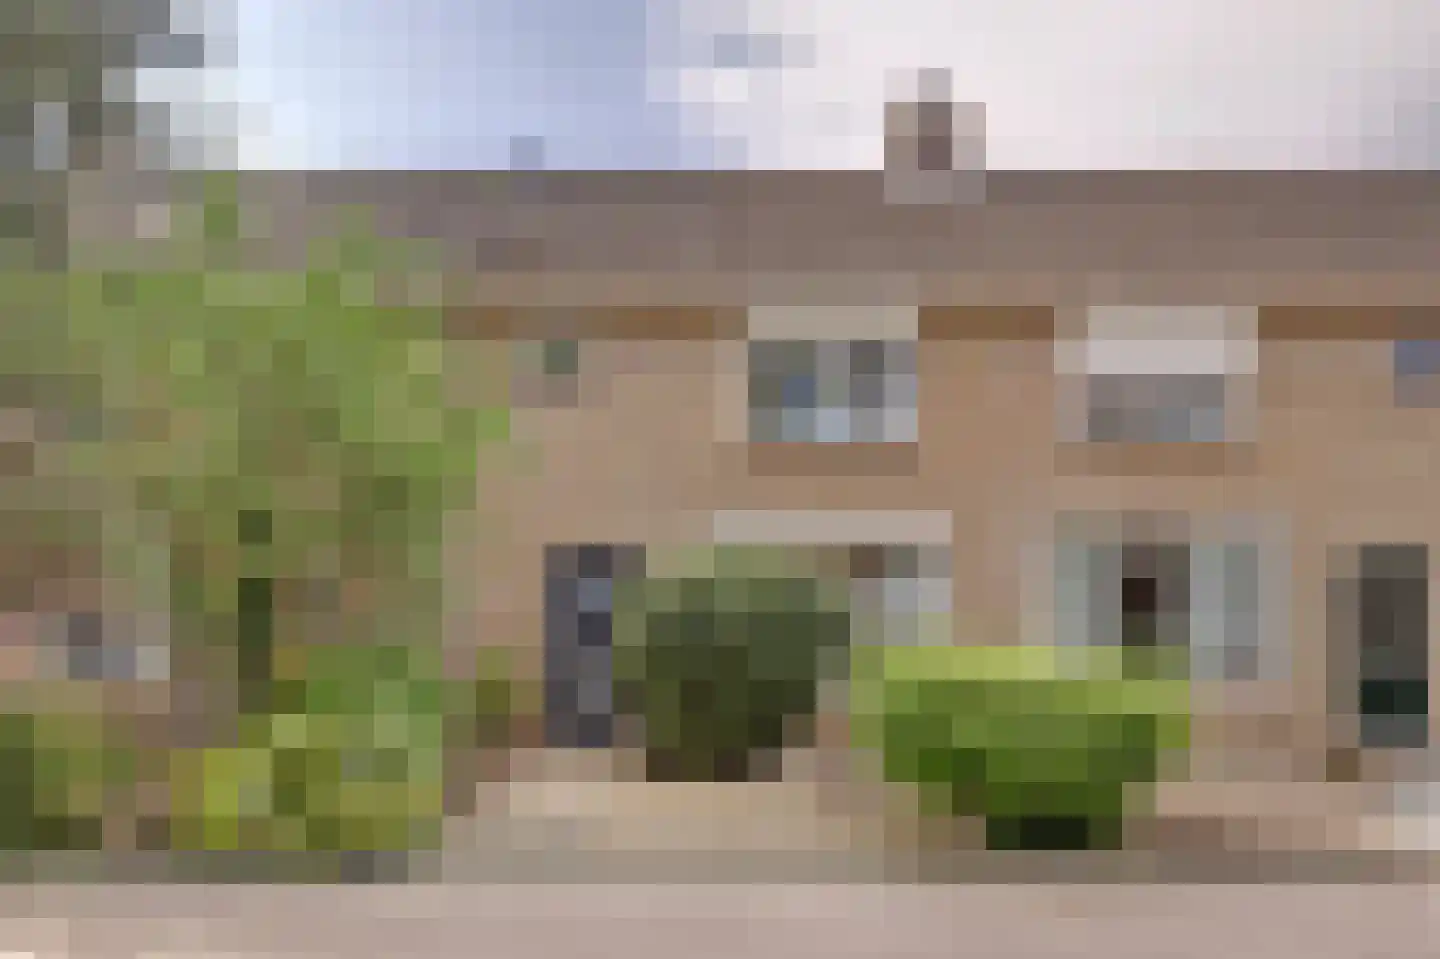
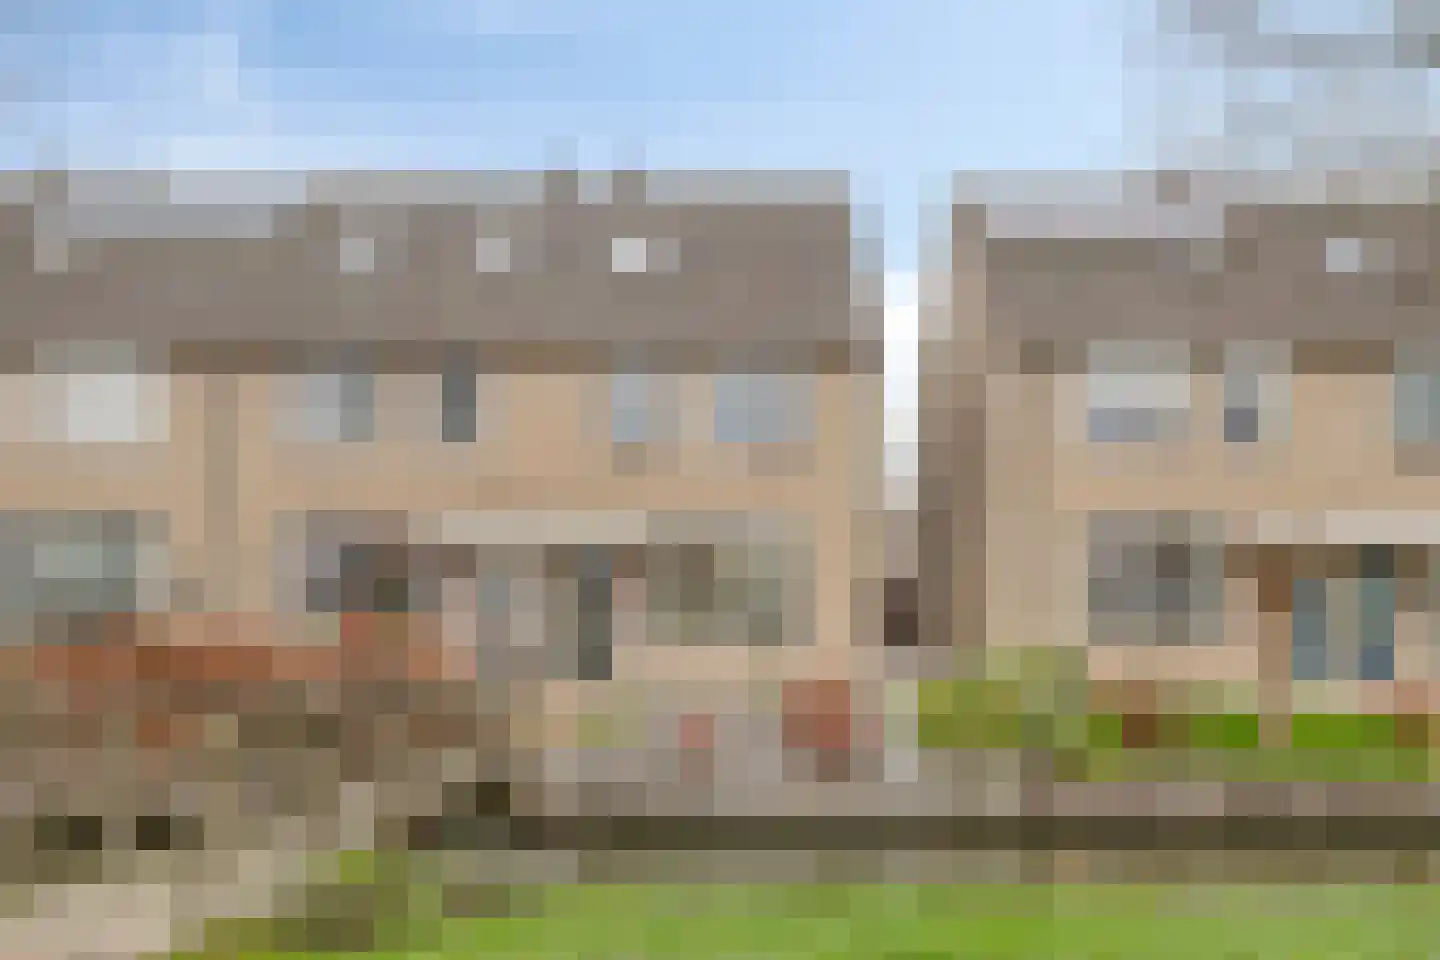
- Available
Kerkboomstraat 2
4209AV Schelluinen
€ 389.000 k.k.
€ 3.740/m²
- Living area
- 104 m²
- Land area
- 155 m²
- Bedrooms
- 5
Searching in 24 houses in Schelluinen
Type to search. Use arrow down and arrow up to navigate through results and press Enter to open.
Hidden search suggestions.
View current properties in Schelluinen or search targeted on street, postal code and property characteristics.
View the current housing stock in Schelluinen and quickly filter by price, living area, rooms and more. There are currently 24 houses in this place within our selection. View also 19 sold houses in Schelluinen for extra insight into the local housing market.
4209AV Schelluinen
€ 389.000 k.k.
€ 3.740/m²
4209AR Schelluinen
€ 365.000 k.k.
€ 3.614/m²
4209SE Schelluinen
€ 925.000 k.k.
€ 4.579/m²
4209AM Schelluinen
€ 385.000 k.k.
€ 3.667/m²
4209SB Schelluinen
€ 585.000 k.k.
€ 2.554/m²
4209AJ Schelluinen
€ 320.000 k.k.
€ 4.384/m²
4209AN Schelluinen
€ 400.000 k.k.
€ 3.773/m²
4209AE Schelluinen
€ 350.000 k.k.
€ 3.763/m²
4209AK Schelluinen
€ 392.500 k.k.
€ 3.886/m²
4209AZ Schelluinen
€ 825.000 k.k.
€ 5.689/m²
4209AH Schelluinen
€ 350.000 k.k.
€ 4.861/m²
4209AG Schelluinen
€ 335.000 k.k.
€ 4.294/m²
4209BP Schelluinen
€ 435.000 k.k.
€ 3.849/m²
4209AV Schelluinen
€ 329.000 k.k.
€ 2.860/m²
4209BP Schelluinen
€ 850.000 k.k.
€ 5.279/m²
4209AH Schelluinen
€ 385.000 k.k.
€ 3.811/m²
4209AV Schelluinen
€ 325.000 k.k.
€ 4.062/m²
4209AB Schelluinen
Price upon request
4209AC Schelluinen
€ 325.000 k.k.
€ 3.125/m²
4209AG Schelluinen
€ 330.000 k.k.
€ 4.520/m²
4209AH Schelluinen
€ 395.000 k.k.
€ 5.337/m²
4209BM Schelluinen
€ 997.000 k.k.
€ 4.816/m²
4209CL Schelluinen
€ 825.000 k.k.
€ 4.824/m²
4209BE Schelluinen
€ 395.000 k.k.
€ 3.559/m²
Get free quotes from real estate agents with local market knowledge. Compare more than 22 real estate agents in Schelluinen.
Selling a home in Schelluinen? Compare all real estate agents in Schelluinen or view the top 10 real estate agents in Schelluinen for extra context for your choice.
Real estate agents make sharper offers when they know you're comparing — ask for quotes for sale or purchase.
Practical answers about housing supply, sales and comparing real estate agents in Schelluinen.
The costs of a real estate agent in Schelluinen depend on commission, setup costs, property presentation and the chosen service. Compare the 22 real estate agents in Schelluinen via the real estate agent page and request multiple quotes to compare rates and approach well.
Within our selection, we are currently showing 24 houses in Schelluinen. View also the sold houses in Schelluinen to compare the current offering with recent transactions.
Take into account not only price and living area but also maintenance, energy label, location, outdoor space and sales status. This way you compare houses in Schelluinen on more than just the asking price.
A local real estate agent knows the neighborhoods, recent transactions and demand in Schelluinen. By comparing 22 real estate agents in the region you get a better insight into prices, sales strategy and expected yield; the top 10 in Schelluinen provides a useful starting point.
Yes, when making a sales plan, a valuation in Schelluinen is wise. You gain insight into a realistic asking price and can then compare offers from real estate agents specifically.
View current location data on residents, WOZ development, housing stock, energy consumption, business activity and safety in Schelluinen. In 2025 were there 1.320 residents. The average WOZ value in 2025 is EUR 452.000.
These figures help to better assess and compare the housing stock in Schelluinen with recent sold homes. Orient yourself then on suitable top real estate agents in Schelluinen for sales advice in this region.
Residents
1.320
Last year: 2025
Average WOZ
EUR 452.000
Last year: 2025
Average income per person.
EUR 34.100
Source: AllNumbers
Crimes (current year)
48
Total registered
| Year | Residents |
|---|---|
| 2021 | 1.305 |
| 2022 | 1.340 |
| 2023 | 1.360 |
| 2024 | 1.355 |
| 2025 | 1.320 |
| Year | Average WOZ |
|---|---|
| 2021 | EUR 334.000 |
| 2022 | EUR 371.000 |
| 2023 | EUR 413.000 |
| 2024 | EUR 444.000 |
| 2025 | EUR 452.000 |
Hoger
230
Praktisch
270
Middelbaar
460
Europa
60
Nederland
1.155
Buiten Europa
105
Label C
173
Label A
162
Label B
93
Label D
64
Label G
43
Label E
29
Label F
19
Label A+
11
Label A+++
4
Label A++
3
Label A+++++
1
Label A++++
0
| Year | Gas (m3) | Electricity (kWh) |
|---|---|---|
| 2020 | 1.360 | 3.270 |
| 2021 | 1.530 | 3.380 |
| 2022 | 1.200 | 3.180 |
| 2023 | 1.000 | 3.090 |
| 2024 | 950 | 3.130 |
Hoekwoning
Gas: 870 • Electricity: 2.560
Huurwoning
Gas: 950 • Electricity: 2.610
Koopwoning
Gas: 1.010 • Electricity: 3.210
Appartement
Gas: 880 • Electricity: 2.990
Tussenwoning
Gas: 800 • Electricity: 2.290
Vrijstaande woning
Gas: 1.370 • Electricity: 4.030
Twee-onder-één-kap woning
Gas: 940 • Electricity: 3.670
Total number of company establishments: 255
| Period | Crimes |
|---|---|
| jan 2026 | 1 |
| jul 2025 | 6 |
| jun 2025 | 2 |
| mei 2025 | 6 |
| mrt 2025 | 7 |
| mrt 2026 | 5 |
| nov 2024 | 4 |
| nov 2025 | 6 |
| okt 2024 | 6 |
| okt 2025 | 3 |
| sep 2024 | 4 |
| sep 2025 | 7 |
These figures give an indicative picture of safety trends in the living environment of Schelluinen.
Short answers based on current local statistics, handy for a quick comparison of the living environment.
Schelluinen telt in 2025 ongeveer 1.320 inwoners.
De gemiddelde WOZ-waarde in Schelluinen is in 2025 circa € 452.000.
Het gemiddelde inkomen per inwoner in Schelluinen ligt rond € 34.100 per jaar.
Voor het huidige jaar gaat het om ongeveer 48 geregistreerde misdrijven. Gebruik deze cijfers als indicatie en vergelijk trends per periode.
In Schelluinen komt vooral "Vrijstaande woningen" veel voor, met ongeveer 159 woningen.