- Available
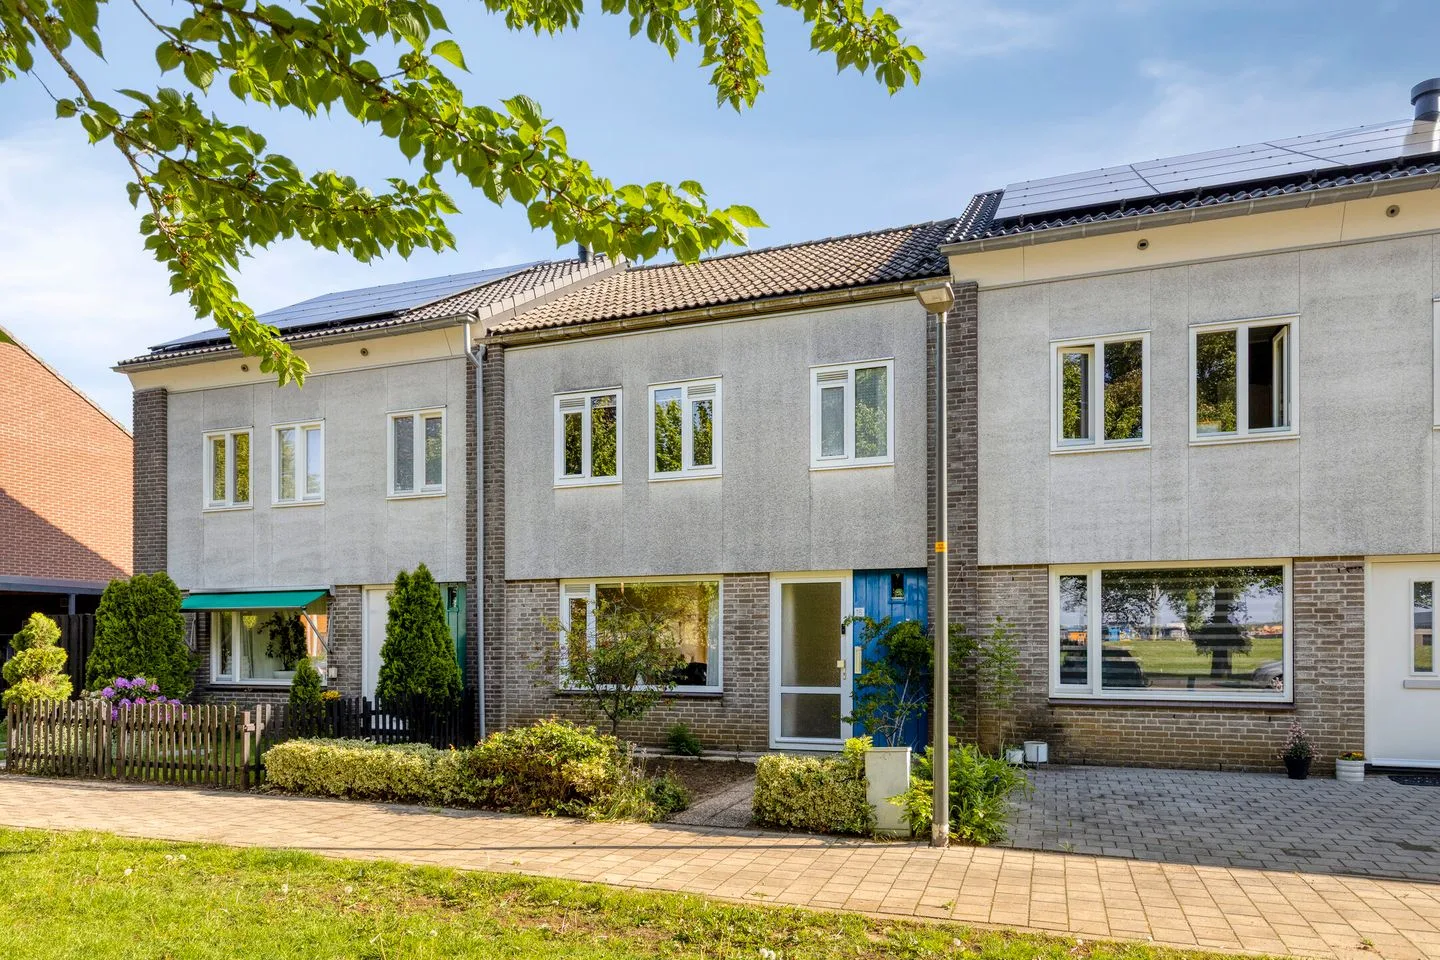
Prins Clausstraat 19
7061XM Terborg
€ 298.000 k.k.
€ 2.893/m²
- Living area
- 103 m²
- Land area
- 166 m²
- Bedrooms
- 4
Searching in 47 houses in Terborg
Type to search. Use arrow down and arrow up to navigate through results and press Enter to open.
Hidden search suggestions.
View current properties in Terborg or search targeted on street, postal code and property characteristics.
View the current housing stock in Terborg and quickly filter by price, living area, rooms and more. There are currently 47 houses in this place within our selection. View also 33 sold houses in Terborg for extra insight into the local housing market.
7061XM Terborg
€ 298.000 k.k.
€ 2.893/m²
7061BM Terborg
€ 279.000 k.k.
€ 2.735/m²
7061XP Terborg
€ 295.000 k.k.
€ 2.418/m²
7061CD Terborg
€ 781 p/m
€ 16/m²
7061WH Terborg
€ 425.000 k.k.
7061CD Terborg
€ 823 p/m
€ 14/m²
7061GC Terborg
€ 1.495.000 k.k.
€ 5.378/m²
7061AC Terborg
€ 275.000 k.k.
€ 2.989/m²
7061CT Terborg
€ 500.000 k.k.
€ 971/m²
7061CT Terborg
€ 745.000 k.k.
€ 2.058/m²
7061CM Terborg
€ 325.000 k.k.
€ 4.221/m²
7061BV Terborg
€ 300.000 k.k.
€ 3.226/m²
7061ZS Terborg
€ 300.000 k.k.
€ 2.778/m²
7061BZ Terborg
€ 279.000 k.k.
€ 2.735/m²
7061AT Terborg
€ 390.000 k.k.
€ 3.333/m²
7061WZ Terborg
€ 185.000 k.k.
€ 2.151/m²
7061BZ Terborg
€ 259.000 k.k.
€ 3.237/m²
7061DG Terborg
€ 375.000 k.k.
€ 3.571/m²
7061DR Terborg
€ 595.000 k.k.
€ 2.806/m²
7061AW Terborg
€ 395.000 k.k.
€ 4.072/m²
7061ZP Terborg
€ 359.000 k.k.
€ 2.659/m²
7061BK Terborg
€ 295.000 k.k.
€ 3.390/m²
7061DV Terborg
€ 295.000 k.k.
€ 2.809/m²
7061DN Terborg
€ 575.000 k.k.
€ 3.885/m²
7061AG Terborg
€ 600.000 k.k.
€ 3.409/m²
7061XM Terborg
€ 298.007 k.k.
€ 2.893/m²
7061CR Terborg
€ 160.000 k.k.
€ 1.403/m²
7061AS Terborg
€ 270.000 k.k.
€ 3.375/m²
Get free quotes from real estate agents with local market knowledge. Compare more than 29 real estate agents in Terborg.
Selling a home in Terborg? Compare all real estate agents in Terborg or view the top 10 real estate agents in Terborg for extra context for your choice.
Real estate agents make sharper offers when they know you're comparing — ask for quotes for sale or purchase.
Practical answers about housing supply, sales and comparing real estate agents in Terborg.
The costs of a real estate agent in Terborg depend on commission, setup costs, property presentation and the chosen service. Compare the 29 real estate agents in Terborg via the real estate agent page and request multiple quotes to compare rates and approach well.
Within our selection, we are currently showing 47 houses in Terborg. View also the sold houses in Terborg to compare the current offering with recent transactions.
Take into account not only price and living area but also maintenance, energy label, location, outdoor space and sales status. This way you compare houses in Terborg on more than just the asking price.
A local real estate agent knows the neighborhoods, recent transactions and demand in Terborg. By comparing 29 real estate agents in the region you get a better insight into prices, sales strategy and expected yield; the top 10 in Terborg provides a useful starting point.
Yes, when making a sales plan, a valuation in Terborg is wise. You gain insight into a realistic asking price and can then compare offers from real estate agents specifically.
View current location data on residents, WOZ development, housing stock, energy consumption, business activity and safety in Terborg. In 2026 were there 4.769 residents. The average WOZ value in 2025 is EUR 302.180.
These figures help to better assess and compare the housing stock in Terborg with recent sold homes. Orient yourself then on suitable top real estate agents in Terborg for sales advice in this region.
Residents
4.769
Last year: 2026
Average WOZ
EUR 302.180
Last year: 2025
Average income per person.
EUR 26.491
Source: AllNumbers
Crimes (current year)
123
Total registered
| Year | Residents |
|---|---|
| 2021 | 4.690 |
| 2022 | 4.695 |
| 2023 | 4.680 |
| 2024 | 4.610 |
| 2025 | 4.660 |
| 2026 | 4.769 |
| Year | Average WOZ |
|---|---|
| 2021 | EUR 209.292 |
| 2022 | EUR 232.941 |
| 2023 | EUR 269.734 |
| 2024 | EUR 288.992 |
| 2025 | EUR 302.180 |
Hoger
610
Praktisch
1.000
Middelbaar
1.630
Europa
360
Nederland
3.490
Buiten Europa
810
Label C
554
Label B
374
Label A
318
Label D
233
Label G
223
Label F
207
Label E
147
Label A++++
98
Label A+
26
Label A+++
21
Label A++
19
Label A+++++
2
| Year | Gas (m3) | Electricity (kWh) |
|---|---|---|
| 2020 | 1.266 | 2.817 |
| 2021 | 1.419 | 2.855 |
| 2022 | 1.121 | 2.670 |
| 2023 | 925 | 2.525 |
| 2024 | 912 | 2.605 |
Hoekwoning
Gas: 850 • Electricity: 2.478
Huurwoning
Gas: 729 • Electricity: 2.102
Koopwoning
Gas: 1.044 • Electricity: 2.769
Appartement
Gas: 581 • Electricity: 1.715
Tussenwoning
Gas: 793 • Electricity: 2.274
Vrijstaande woning
Gas: 1.355 • Electricity: 3.304
Twee-onder-één-kap woning
Gas: 1.039 • Electricity: 2.657
Total number of company establishments: 575
| Period | Crimes |
|---|---|
| jan 2026 | 7 |
| jul 2025 | 8 |
| jun 2025 | 9 |
| mei 2025 | 7 |
| mrt 2025 | 8 |
| mrt 2026 | 18 |
| nov 2024 | 11 |
| nov 2025 | 10 |
| okt 2024 | 17 |
| okt 2025 | 8 |
| sep 2024 | 7 |
| sep 2025 | 11 |
These figures give an indicative picture of safety trends in the living environment of Terborg.
Short answers based on current local statistics, handy for a quick comparison of the living environment.
Terborg telt in 2026 ongeveer 4.769 inwoners.
De gemiddelde WOZ-waarde in Terborg is in 2025 circa € 302.180.
Het gemiddelde inkomen per inwoner in Terborg ligt rond € 26.491 per jaar.
Voor het huidige jaar gaat het om ongeveer 123 geregistreerde misdrijven. Gebruik deze cijfers als indicatie en vergelijk trends per periode.
In Terborg komt vooral "Tussenwoningen" veel voor, met ongeveer 681 woningen.