- Sold
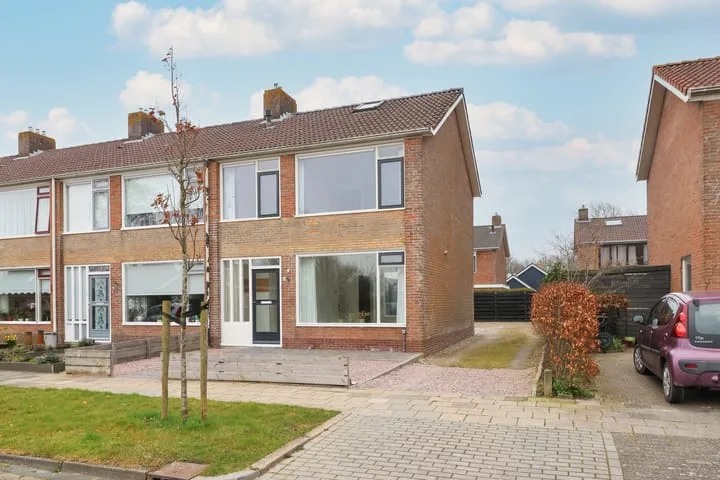
Johan Roordastrjitte 3
8851EB Tzummarum
€ 225.000 k.k.
€ 2.009/m²
- Living area
- 112 m²
- Land area
- 141 m²
- Bedrooms
- 3
View 22 sold houses in Tzummarum
Type to search. Use arrow down and arrow up to navigate through results and press Enter to open.
Hidden search suggestions.
Compare sold homes in Tzummarum or view the current offering in this location directly.
On this page you will find recently sold homes in Tzummarum. Use this overview to better estimate selling prices, popular neighborhoods, and the local housing supply before you choose a real estate agent. Also view the current housing supply with 36 houses in Tzummarum.
8851EB Tzummarum
€ 225.000 k.k.
€ 2.009/m²
8851EB Tzummarum
€ 265.000 k.k.
€ 2.324/m²
8851GV Tzummarum
€ 259.000 k.k.
€ 2.590/m²
8851EG Tzummarum
€ 265.000 k.k.
€ 2.912/m²
8851ER Tzummarum
€ 275.000 k.k.
€ 2.330/m²
8851EP Tzummarum
€ 299.500 k.k.
€ 2.496/m²
8851HT Tzummarum
€ 139.500 k.k.
€ 3.321/m²
8851RB Tzummarum
€ 225.000 k.k.
€ 2.922/m²
8851HV Tzummarum
€ 129.500 k.k.
€ 3.362/m²
8851GP Tzummarum
€ 390.000 k.k.
€ 2.805/m²
8851GA Tzummarum
€ 430.000 k.k.
€ 3.739/m²
8851ER Tzummarum
€ 399.000 k.k.
€ 2.389/m²
8851HV Tzummarum
€ 149.500 k.k.
€ 3.322/m²
8851RB Tzummarum
€ 239.500 k.k.
€ 2.395/m²
8851GA Tzummarum
€ 585.000 k.k.
€ 2.250/m²
8851GP Tzummarum
€ 495.000 k.k.
€ 4.419/m²
8851HT Tzummarum
€ 150.000 k.k.
€ 3.658/m²
8851GR Tzummarum
€ 650.000 k.k.
€ 3.266/m²
8851EP Tzummarum
€ 299.500 k.k.
€ 2.037/m²
8851EA Tzummarum
€ 219.500 k.k.
€ 1.995/m²
8851HA Tzummarum
€ 200.000 k.k.
€ 2.739/m²
8851ED Tzummarum
€ 265.000 k.k.
€ 2.650/m²
Bekijk recente verkopen en ontvang gratis offertes van lokale verkoopmakelaars in Tzummarum.
Zelf je woning verkopen in Tzummarum? Vergelijk verkoopmakelaars in Tzummarum of bekijk de beste verkoopmakelaars in Tzummarum als referentie bij jouw keuze.
Makelaars maken scherpere voorstellen als ze weten dat je vergelijkt — vraag offertes aan voor verkoop of aankoop.
Short answers about housing prices, sold homes and comparing real estate agents in Tzummarum.
The costs of a real estate agent in Tzummarum vary per office, property type and sales approach. Therefore, compare multiple quotes and also look at the real estate agents in Tzummarum to better compare rates, presentation and local experience.
On this page we currently show 22 sold houses in Tzummarum from our selection. This helps you to better assess recent transactions and the local housing market.
Houses sold in Tzummarum give insight into asking prices, house types and neighborhoods where recent transactions have taken place. Compare this also with the current housing stock in Tzummarum to better understand the market.
You can use sold homes as a first market indication, but a local real estate agent can better take into account finishing, location, maintenance and current demand in Tzummarum.
Vergelijk makelaars in Tzummarum op lokale verkoopervaring, reviews, verwachte opbrengst, courtage en marketingaanpak. Bekijk verkoopmakelaars in Tzummarum of de top 10 makelaars in Tzummarum om snel sterke kantoren te ontdekken.
View current location data on residents, WOZ development, housing stock, energy consumption, business activity and safety in Tzummarum. In 2025 were there 1.395 residents. The average WOZ value in 2025 is EUR 261.000.
These figures help to better assess and compare the housing stock in Tzummarum with recent sold homes. Orient yourself then on suitable top real estate agents in Tzummarum for sales advice in this region.
Residents
1.395
Last year: 2025
Average WOZ
EUR 261.000
Last year: 2025
Average income per person.
EUR 28.200
Source: AllNumbers
Crimes (current year)
27
Total registered
| Year | Residents |
|---|---|
| 2021 | 1.370 |
| 2022 | 1.360 |
| 2023 | 1.365 |
| 2024 | 1.400 |
| 2025 | 1.395 |
| Year | Average WOZ |
|---|---|
| 2021 | EUR 168.000 |
| 2022 | EUR 187.000 |
| 2023 | EUR 232.000 |
| 2024 | EUR 250.000 |
| 2025 | EUR 261.000 |
Hoger
160
Praktisch
270
Middelbaar
590
Europa
85
Nederland
1.235
Buiten Europa
75
Label G
184
Label C
168
Label A
151
Label B
137
Label D
53
Label F
32
Label E
18
Label A+++
6
Label A++
4
Label A+
3
Label A++++
0
Label A+++++
0
| Year | Gas (m3) | Electricity (kWh) |
|---|---|---|
| 2020 | 1.370 | 2.640 |
| 2021 | 1.570 | 2.700 |
| 2022 | 1.230 | 2.570 |
| 2023 | 1.070 | 2.630 |
| 2024 | 1.050 | 2.680 |
Hoekwoning
Gas: 1.020 • Electricity: 2.280
Huurwoning
Gas: 990 • Electricity: 1.980
Koopwoning
Gas: 1.110 • Electricity: 2.910
Appartement
Gas: 670 • Electricity: 1.350
Tussenwoning
Gas: 1.020 • Electricity: 2.130
Vrijstaande woning
Gas: 1.220 • Electricity: 3.190
Twee-onder-één-kap woning
Gas: 980 • Electricity: 2.370
Total number of company establishments: 190
| Period | Crimes |
|---|---|
| jan 2025 | 2 |
| jan 2026 | 1 |
| jul 2025 | 2 |
| jun 2025 | 0 |
| mei 2025 | 1 |
| mrt 2025 | 0 |
| nov 2024 | 3 |
| nov 2025 | 0 |
| okt 2024 | 1 |
| okt 2025 | 6 |
| sep 2024 | 0 |
| sep 2025 | 9 |
These figures give an indicative picture of safety trends in the living environment of Tzummarum.
Short answers based on current local statistics, handy for a quick comparison of the living environment.
Tzummarum telt in 2025 ongeveer 1.395 inwoners.
De gemiddelde WOZ-waarde in Tzummarum is in 2025 circa € 261.000.
Het gemiddelde inkomen per inwoner in Tzummarum ligt rond € 28.200 per jaar.
Voor het huidige jaar gaat het om ongeveer 27 geregistreerde misdrijven. Gebruik deze cijfers als indicatie en vergelijk trends per periode.
In Tzummarum komt vooral "Vrijstaande woningen" veel voor, met ongeveer 271 woningen.