- Sold
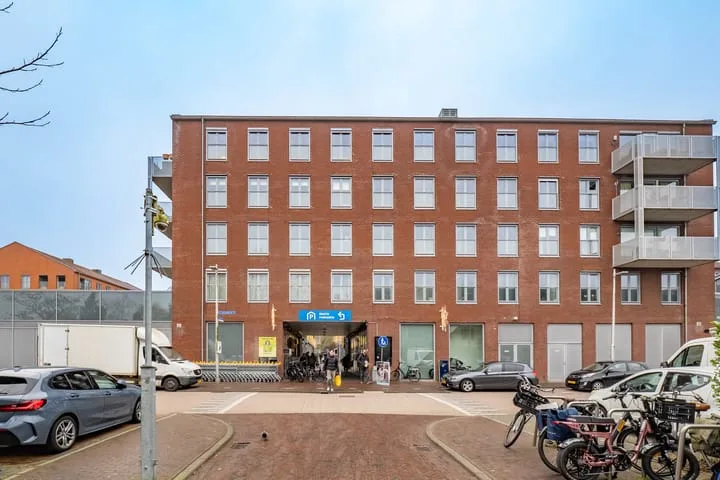
Van der Goesstraat 49
3521TK Utrecht
€ 685.000 k.k.
€ 6.523/m²
- Living area
- 105 m²
- Land area
- 82 m²
- Bedrooms
- 5
View 3.919 sold houses in Utrecht
Type to search. Use arrow down and arrow up to navigate through results and press Enter to open.
Hidden search suggestions.
Compare sold homes in Utrecht or view the current offering in this location directly.
On this page you will find recently sold homes in Utrecht. Use this overview to better estimate selling prices, popular neighborhoods, and the local housing supply before you choose a real estate agent. Also view the current housing supply with 5.077 houses in Utrecht.
3521TK Utrecht
€ 685.000 k.k.
€ 6.523/m²
3555AK Utrecht
€ 319.000 k.k.
€ 4.623/m²
3581RG Utrecht
€ 449.000 k.k.
€ 8.803/m²
3562CH Utrecht
€ 399.000 k.k.
€ 4.156/m²
3511MG Utrecht
€ 675.000 k.k.
€ 7.337/m²
3561LE Utrecht
€ 265.000 k.k.
€ 5.300/m²
3513EW Utrecht
€ 250.000 k.k.
€ 8.620/m²
3554JG Utrecht
€ 695.000 k.k.
€ 5.560/m²
3527KE Utrecht
€ 345.000 k.k.
€ 4.928/m²
3551GE Utrecht
€ 475.000 k.k.
€ 6.506/m²
3544HG Utrecht
€ 675.000 k.k.
€ 5.400/m²
3521XK Utrecht
€ 675.000 k.k.
€ 6.308/m²
3582BJ Utrecht
€ 498.000 k.k.
€ 7.661/m²
3551CS Utrecht
€ 425.000 k.k.
€ 5.379/m²
3523GL Utrecht
€ 400.000 k.k.
€ 5.555/m²
3515EX Utrecht
€ 400.000 k.k.
€ 7.843/m²
3523RM Utrecht
€ 385.000 k.k.
€ 6.209/m²
3571XK Utrecht
€ 359.500 k.k.
€ 5.365/m²
3581LC Utrecht
€ 495.000 k.k.
€ 7.173/m²
3582SE Utrecht
€ 465.000 k.k.
€ 5.344/m²
3572KM Utrecht
€ 450.000 k.k.
€ 5.172/m²
3553AB Utrecht
€ 450.000 k.k.
€ 4.687/m²
3514BH Utrecht
€ 450.000 k.k.
€ 6.923/m²
3524DL Utrecht
€ 325.000 k.k.
€ 5.508/m²
3544EC Utrecht
€ 450.000 k.k.
€ 4.838/m²
3554HD Utrecht
€ 600.000 k.k.
€ 5.660/m²
3544ZA Utrecht
€ 750.000 k.k.
€ 5.033/m²
3572LV Utrecht
€ 300.000 k.k.
€ 9.090/m²
Get free quotes from realtors with local market knowledge in Utrecht.
Selling a home in Utrecht? Compare real estate agents who know the local housing market. Also check out all real estate agents in Utrecht or the top 10 real estate agents in Utrecht for extra context for your choice.
By comparing brokers and requesting quotes
Short answers about housing prices, sold homes and comparing real estate agents in Utrecht.
The costs of a real estate agent in Utrecht vary per office, property type and sales approach. Therefore, compare multiple quotes and also look at the real estate agents in Utrecht to better compare rates, presentation and local experience.
On this page we currently show 3.919 sold houses in Utrecht from our selection. This helps you to better assess recent transactions and the local housing market.
Houses sold in Utrecht give insight into asking prices, house types and neighborhoods where recent transactions have taken place. Compare this also with the current housing stock in Utrecht to better understand the market.
You can use sold homes as a first market indication, but a local real estate agent can better take into account finishing, location, maintenance and current demand in Utrecht.
Compare realtors in Utrecht on local sales experience, reviews, expected yield, commission and marketing approach. The top 10 realtors in Utrecht helps to quickly discover strong offices.
View current location data on residents, WOZ development, housing stock, energy consumption, business activity and safety in Utrecht. In 2025 were there 325.510 residents. The average WOZ value in 2025 is EUR 474.416.
These figures help to better assess and compare the housing stock in Utrecht with recent sold homes. Orient yourself then on suitable top real estate agents in Utrecht for sales advice in this region.
Residents
325.510
Last year: 2025
Average WOZ
EUR 474.416
Last year: 2025
Average income per person.
EUR 38.255
Source: AllNumbers
Crimes (current year)
25.985
Total registered
| Year | Residents |
|---|---|
| 2021 | 308.685 |
| 2022 | 310.610 |
| 2023 | 316.460 |
| 2024 | 323.020 |
| 2025 | 325.510 |
| Year | Average WOZ |
|---|---|
| 2021 | EUR 349.277 |
| 2022 | EUR 381.193 |
| 2023 | EUR 442.579 |
| 2024 | EUR 435.454 |
| 2025 | EUR 474.416 |
Hoger
148.860
Praktisch
45.840
Middelbaar
67.680
Europa
37.515
Nederland
186.915
Buiten Europa
101.045
Label A
47.799
Label C
25.699
Label B
17.523
Label D
13.066
Label F
12.655
Label G
11.728
Label E
11.306
Label A+
9.677
Label A++
5.013
Label A+++
4.232
Label A++++
725
Label A+++++
21
| Year | Gas (m3) | Electricity (kWh) |
|---|---|---|
| 2020 | 664 | 2.253 |
| 2021 | 740 | 2.328 |
| 2022 | 572 | 2.170 |
| 2023 | 484 | 2.028 |
| 2024 | 468 | 2.042 |
Hoekwoning
Gas: 791 • Electricity: 2.601
Huurwoning
Gas: 421 • Electricity: 1.821
Koopwoning
Gas: 587 • Electricity: 2.316
Appartement
Gas: 368 • Electricity: 1.760
Tussenwoning
Gas: 700 • Electricity: 2.361
Vrijstaande woning
Gas: 1.325 • Electricity: 3.953
Twee-onder-één-kap woning
Gas: 898 • Electricity: 3.142
Total number of company establishments: 55.750
| Period | Crimes |
|---|---|
| jan 2025 | 1.938 |
| jan 2026 | 2.042 |
| jul 2025 | 2.284 |
| jun 2025 | 2.296 |
| mei 2025 | 2.085 |
| mrt 2025 | 2.095 |
| nov 2024 | 2.183 |
| nov 2025 | 2.313 |
| okt 2024 | 2.124 |
| okt 2025 | 2.340 |
| sep 2024 | 1.881 |
| sep 2025 | 2.221 |
These figures give an indicative picture of safety trends in the living environment of Utrecht.
Short answers based on current local statistics, handy for a quick comparison of the living environment.
Utrecht telt in 2025 ongeveer 325.510 inwoners.
De gemiddelde WOZ-waarde in Utrecht is in 2025 circa € 474.416.
Het gemiddelde inkomen per inwoner in Utrecht ligt rond € 38.255 per jaar.
Voor het huidige jaar gaat het om ongeveer 25.985 geregistreerde misdrijven. Gebruik deze cijfers als indicatie en vergelijk trends per periode.
In Utrecht komt vooral "Appartementen" veel voor, met ongeveer 108.137 woningen.