- Available
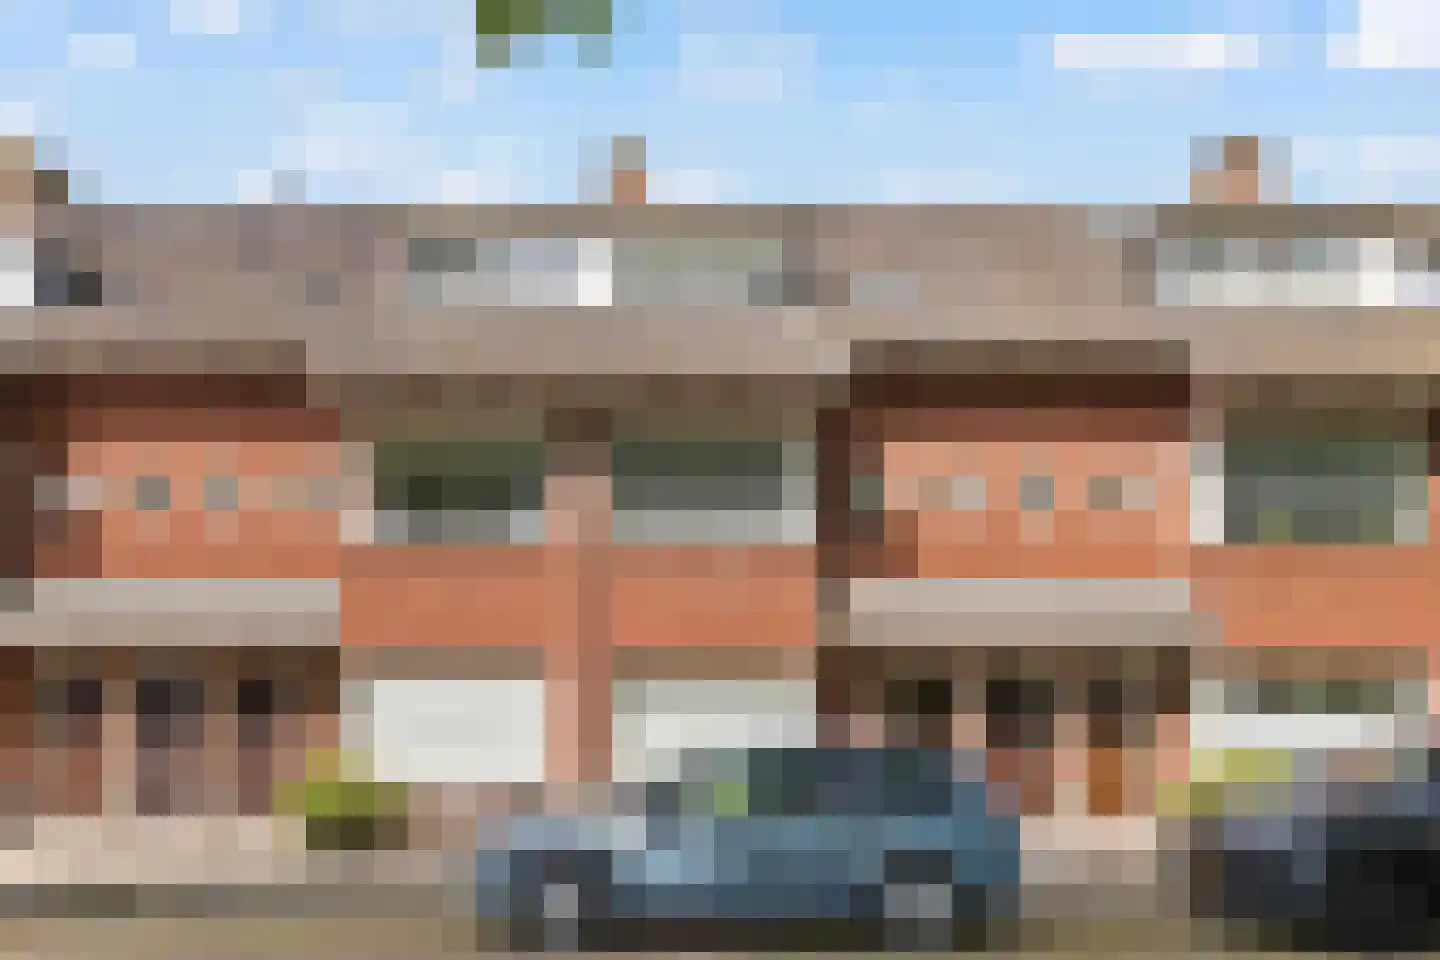
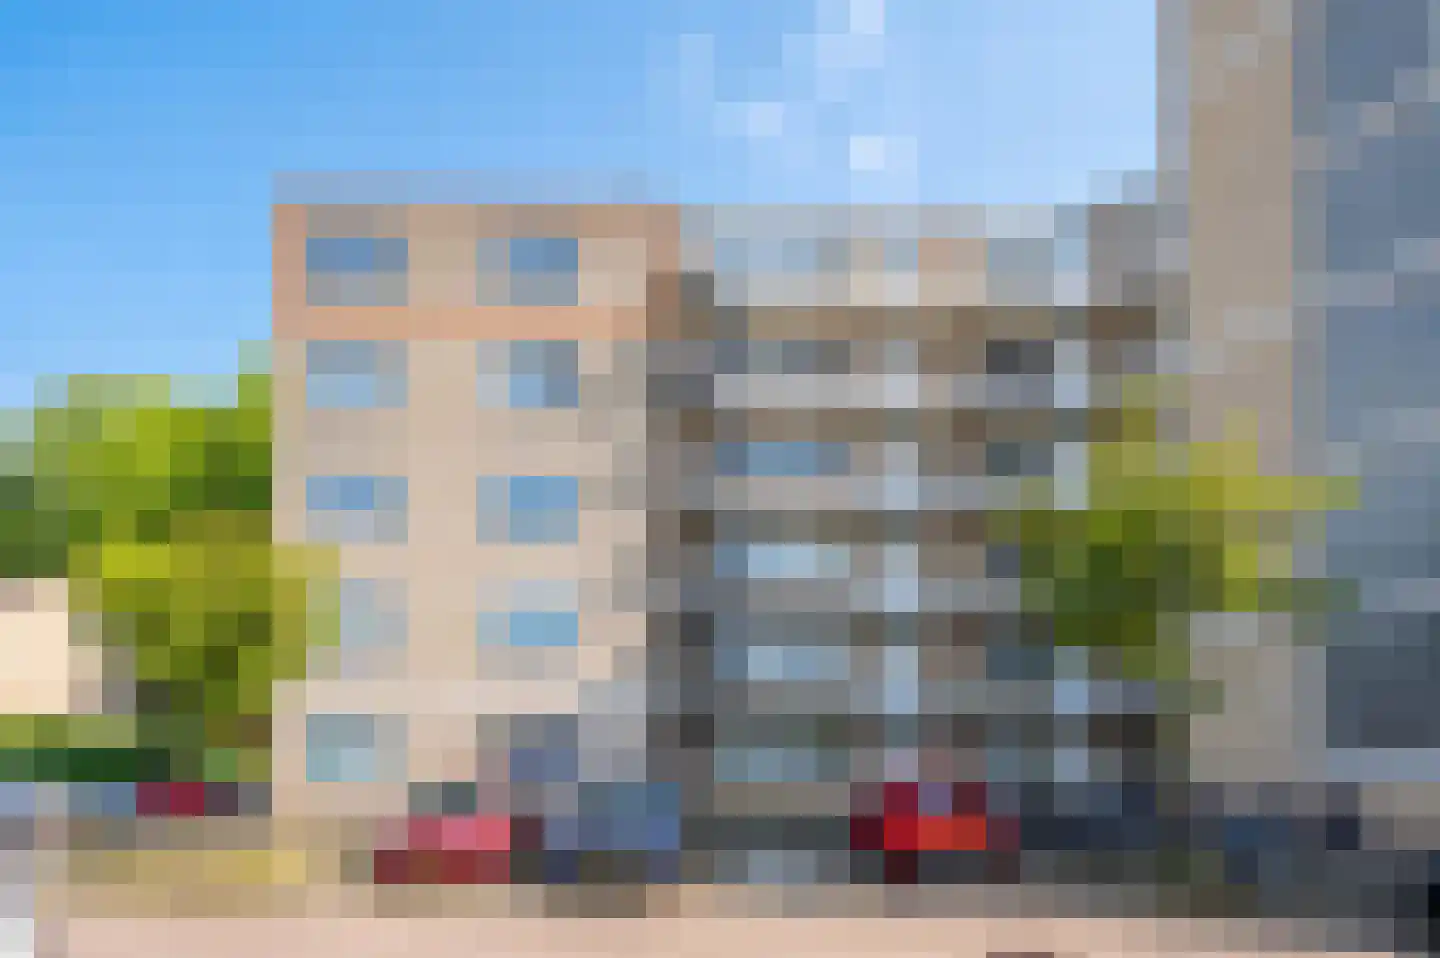
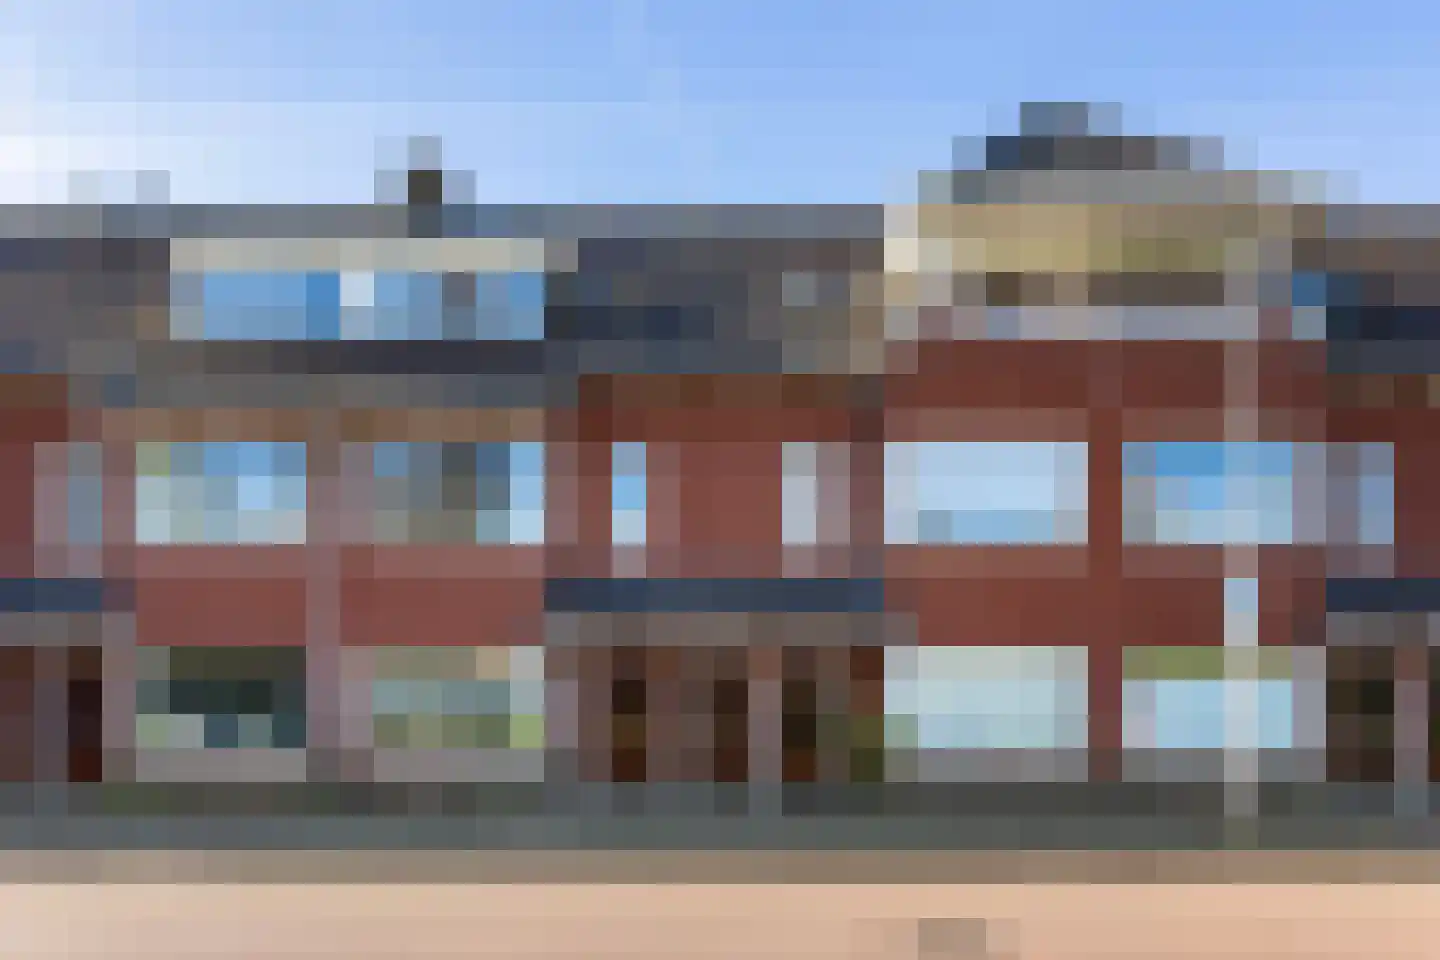
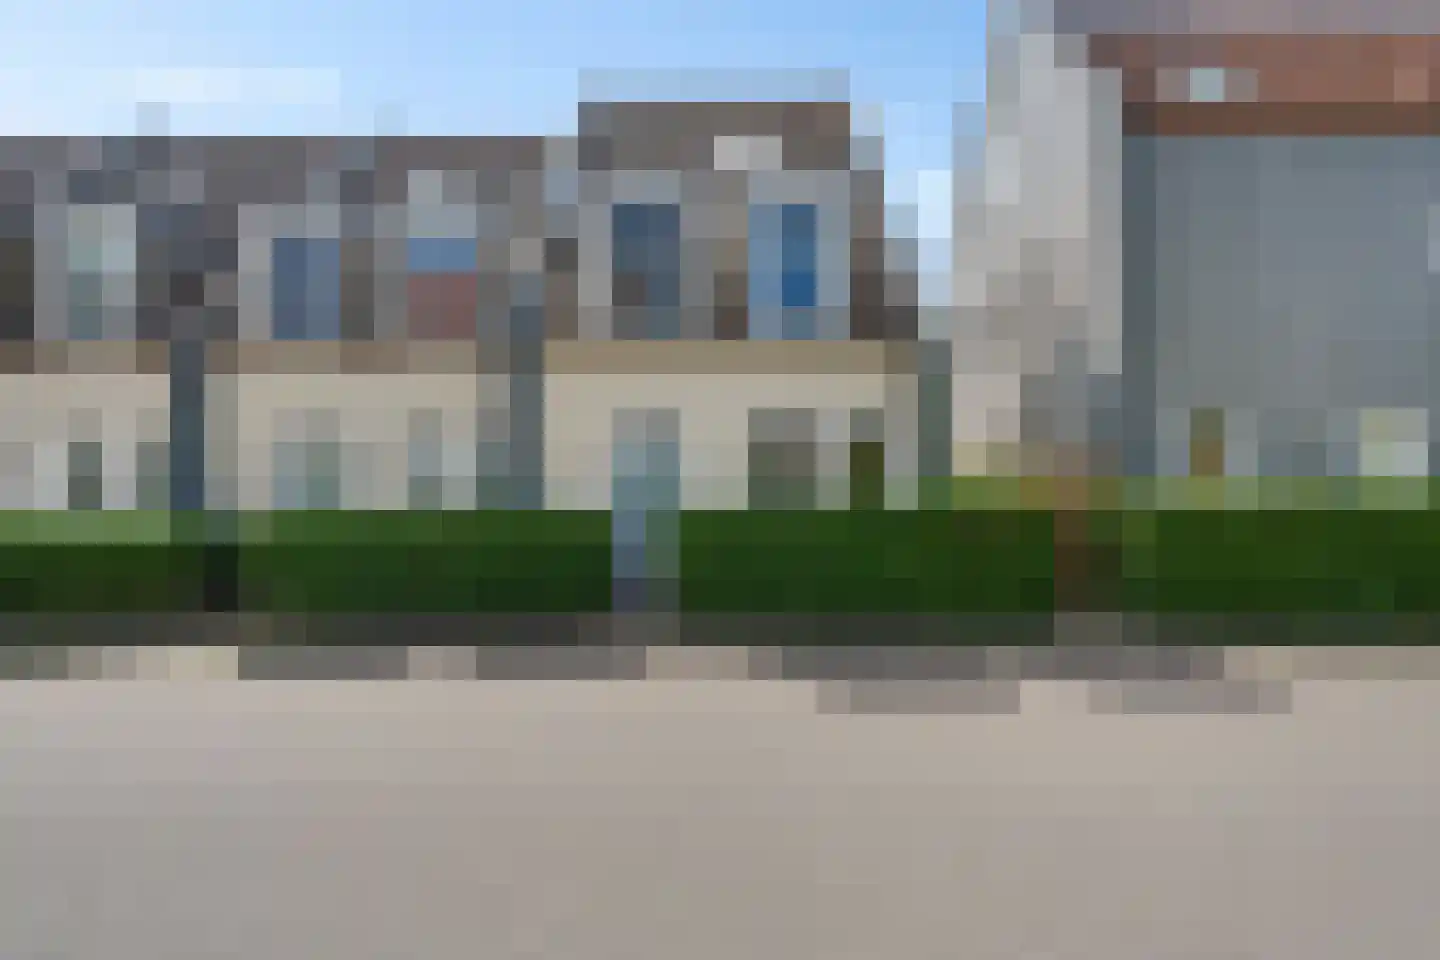
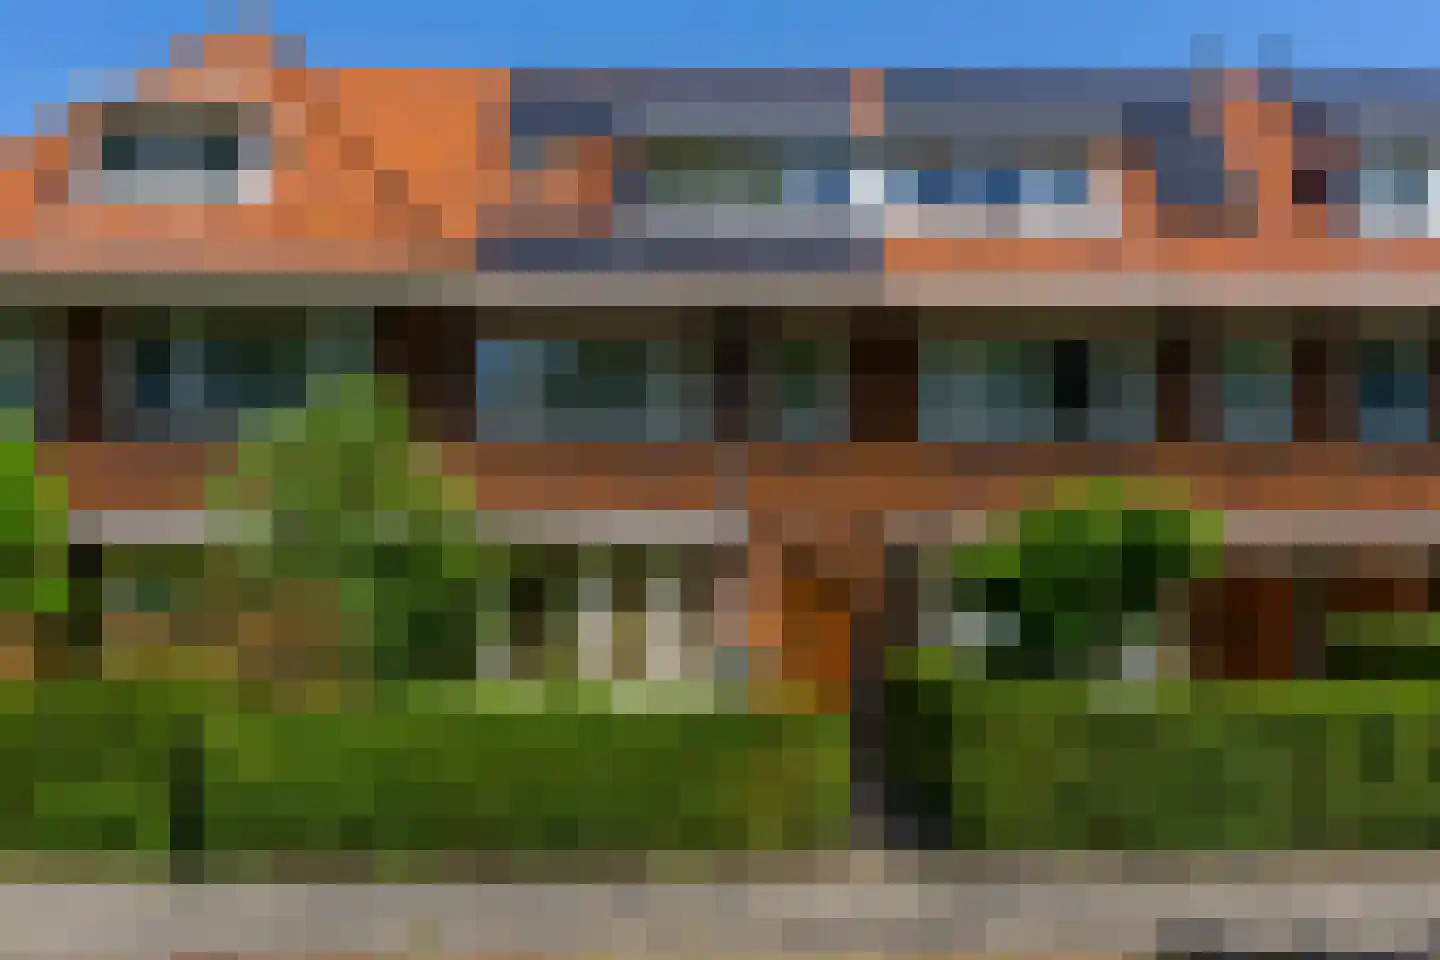
Sigmund Rombergstraat 7
3543GC Utrecht
€ 1.500.000 k.k.
€ 6.098/m²
- Living area
- 246 m²
- Land area
- 571 m²
- Bedrooms
- 6
Searching in 5.084 houses in Utrecht
Type to search. Use arrow down and arrow up to navigate through results and press Enter to open.
Hidden search suggestions.
View current properties in Utrecht or search targeted on street, postal code and property characteristics.
View the current housing stock in Utrecht and quickly filter by price, living area, rooms and more. There are currently 5.084 houses in this place within our selection. View also 3.862 sold houses in Utrecht for extra insight into the local housing market.
3543GC Utrecht
€ 1.500.000 k.k.
€ 6.098/m²
3532BZ Utrecht
€ 525.000 k.k.
€ 6.646/m²
3544CW Utrecht
€ 495.000 k.k.
€ 4.950/m²
3511AE Utrecht
€ 500.000 k.k.
€ 6.250/m²
3543EM Utrecht
€ 545.000 k.k.
€ 5.093/m²
3522KC Utrecht
€ 450.000 k.k.
€ 6.338/m²
3512CN Utrecht
€ 489.000 k.k.
€ 7.762/m²
3571LX Utrecht
€ 675.000 k.k.
€ 5.153/m²
3515XJ Utrecht
€ 425.000 k.k.
€ 8.333/m²
3571XH Utrecht
€ 739.000 k.k.
€ 6.316/m²
3551TB Utrecht
€ 400.000 k.k.
€ 7.273/m²
3527VK Utrecht
€ 425.000 k.k.
€ 5.667/m²
3544KH Utrecht
€ 895.000 k.k.
€ 5.028/m²
3553SP Utrecht
€ 469.000 k.k.
€ 7.106/m²
3573AG Utrecht
€ 1.795 p/m
€ 28/m²
3532BR Utrecht
€ 532.500 k.k.
€ 6.827/m²
3584GS Utrecht
€ 375.000 k.k.
€ 5.952/m²
3531CT Utrecht
€ 350.000 k.k.
€ 6.863/m²
3531CT Utrecht
€ 269.000 k.k.
€ 7.270/m²
3544ZC Utrecht
€ 625.000 k.k.
€ 5.123/m²
3572LL Utrecht
€ 450.000 k.k.
€ 6.522/m²
3521HB Utrecht
€ 2.695.000 k.k.
€ 11.517/m²
3571XC Utrecht
€ 398.000 k.k.
€ 5.528/m²
3533BA Utrecht
€ 345.000 k.k.
€ 6.273/m²
3571PA Utrecht
€ 2.295 p/m
€ 34/m²
3571WB Utrecht
€ 895.000 k.k.
€ 6.630/m²
3551BN Utrecht
€ 550.000 k.k.
€ 5.238/m²
3581MB Utrecht
€ 365.000 k.k.
€ 7.157/m²
Get free quotes from real estate agents with local market knowledge. Compare more than 218 real estate agents in Utrecht.
Selling a home in Utrecht? View the sales-oriented guide sell a house in Utrecht, compare all real estate agents in Utrecht or view the top 10 real estate agents in Utrecht for extra context to your choice.
Real estate agents make sharper offers when they know you're comparing — ask for quotes for sale or purchase.
Practical answers about housing supply, sales and comparing real estate agents in Utrecht.
The costs of a real estate agent in Utrecht depend on commission, setup costs, property presentation and the chosen service. Compare the 218 real estate agents in Utrecht via the real estate agent page and request multiple quotes to compare rates and approach well.
Within our selection, we are currently showing 5.084 houses in Utrecht. View also the sold houses in Utrecht to compare the current offering with recent transactions.
Take into account not only price and living area but also maintenance, energy label, location, outdoor space and sales status. This way you compare houses in Utrecht on more than just the asking price.
A local real estate agent knows the neighborhoods, recent transactions and demand in Utrecht. By comparing 218 real estate agents in the region you get a better insight into prices, sales strategy and expected yield; the top 10 in Utrecht provides a useful starting point.
Yes, when making a sales plan, a valuation in Utrecht is wise. You gain insight into a realistic asking price and can then compare offers from real estate agents specifically.
View current location data on residents, WOZ development, housing stock, energy consumption, business activity and safety in Utrecht. In 2025 were there 325.510 residents. The average WOZ value in 2025 is EUR 474.416.
These figures help to better assess and compare the housing stock in Utrecht with recent sold homes. Orient yourself then on suitable top real estate agents in Utrecht for sales advice in this region.
Residents
325.510
Last year: 2025
Average WOZ
EUR 474.416
Last year: 2025
Average income per person.
EUR 38.255
Source: AllNumbers
Crimes (current year)
25.985
Total registered
| Year | Residents |
|---|---|
| 2021 | 308.685 |
| 2022 | 310.610 |
| 2023 | 316.460 |
| 2024 | 323.020 |
| 2025 | 325.510 |
| Year | Average WOZ |
|---|---|
| 2021 | EUR 349.277 |
| 2022 | EUR 381.193 |
| 2023 | EUR 442.579 |
| 2024 | EUR 435.454 |
| 2025 | EUR 474.416 |
Hoger
148.860
Praktisch
45.840
Middelbaar
67.680
Europa
37.515
Nederland
186.915
Buiten Europa
101.045
Label A
47.799
Label C
25.699
Label B
17.523
Label D
13.066
Label F
12.655
Label G
11.728
Label E
11.306
Label A+
9.677
Label A++
5.013
Label A+++
4.232
Label A++++
725
Label A+++++
21
| Year | Gas (m3) | Electricity (kWh) |
|---|---|---|
| 2020 | 664 | 2.253 |
| 2021 | 740 | 2.328 |
| 2022 | 572 | 2.170 |
| 2023 | 484 | 2.028 |
| 2024 | 468 | 2.042 |
Hoekwoning
Gas: 791 • Electricity: 2.601
Huurwoning
Gas: 421 • Electricity: 1.821
Koopwoning
Gas: 587 • Electricity: 2.316
Appartement
Gas: 368 • Electricity: 1.760
Tussenwoning
Gas: 700 • Electricity: 2.361
Vrijstaande woning
Gas: 1.325 • Electricity: 3.953
Twee-onder-één-kap woning
Gas: 898 • Electricity: 3.142
Total number of company establishments: 55.750
| Period | Crimes |
|---|---|
| jan 2025 | 1.938 |
| jan 2026 | 2.042 |
| jul 2025 | 2.284 |
| jun 2025 | 2.296 |
| mei 2025 | 2.085 |
| mrt 2025 | 2.095 |
| nov 2024 | 2.183 |
| nov 2025 | 2.313 |
| okt 2024 | 2.124 |
| okt 2025 | 2.340 |
| sep 2024 | 1.881 |
| sep 2025 | 2.221 |
These figures give an indicative picture of safety trends in the living environment of Utrecht.
Short answers based on current local statistics, handy for a quick comparison of the living environment.
Utrecht telt in 2025 ongeveer 325.510 inwoners.
De gemiddelde WOZ-waarde in Utrecht is in 2025 circa € 474.416.
Het gemiddelde inkomen per inwoner in Utrecht ligt rond € 38.255 per jaar.
Voor het huidige jaar gaat het om ongeveer 25.985 geregistreerde misdrijven. Gebruik deze cijfers als indicatie en vergelijk trends per periode.
In Utrecht komt vooral "Appartementen" veel voor, met ongeveer 108.137 woningen.