- Under consideration
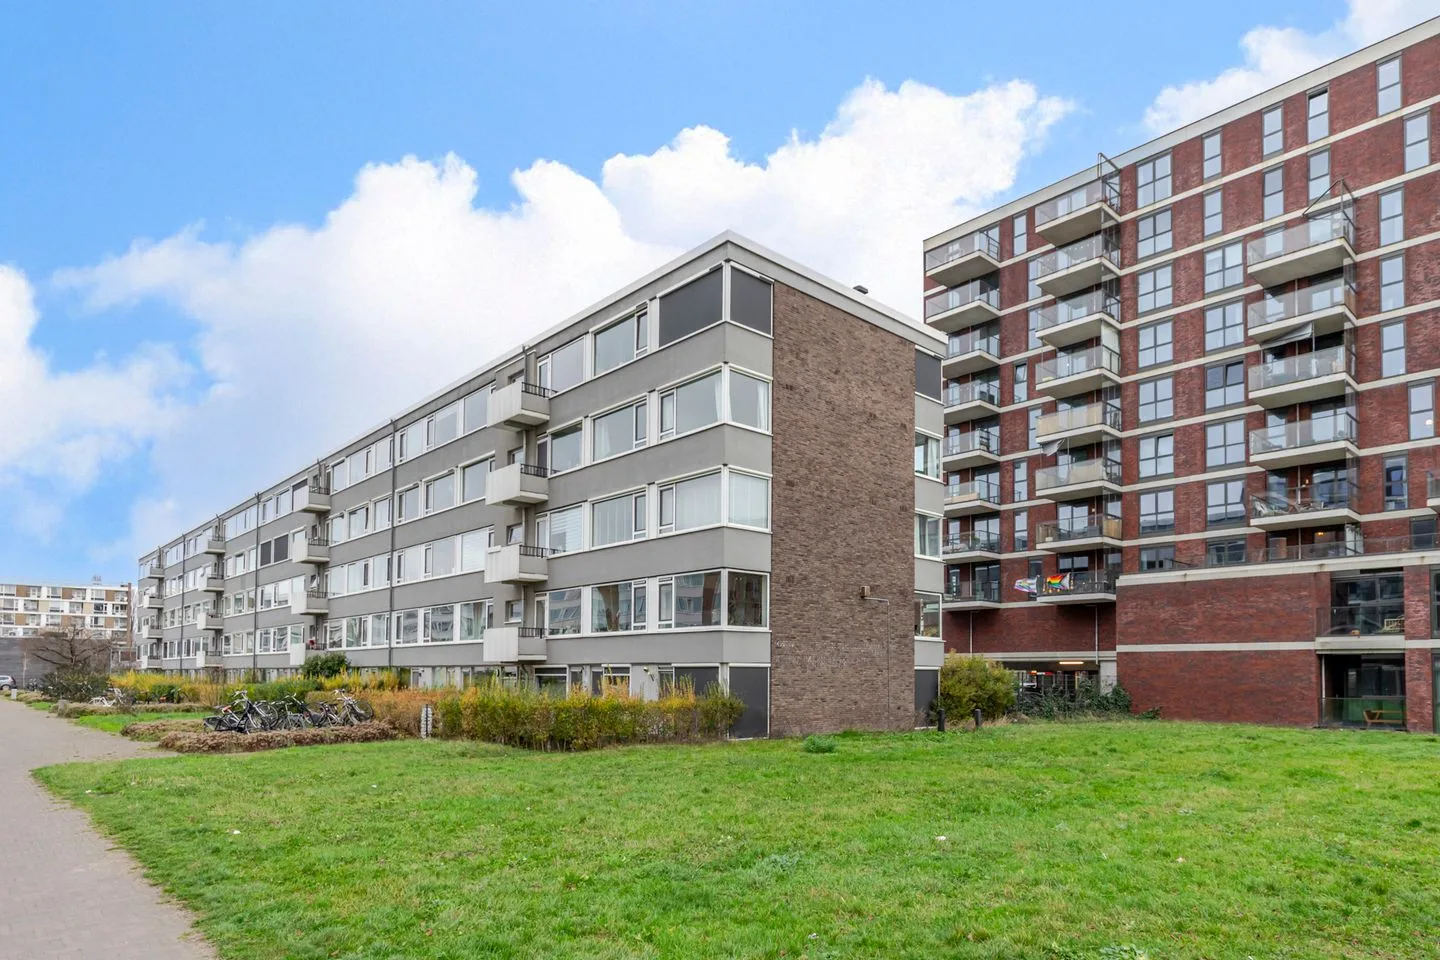
Monnetlaan 110
3527GT Utrecht
€ 350.000 k.k.
€ 4.667/m²
B
Save as favorite
- Living area
- 75 m²
- Land area
- —
- Bedrooms
- 2