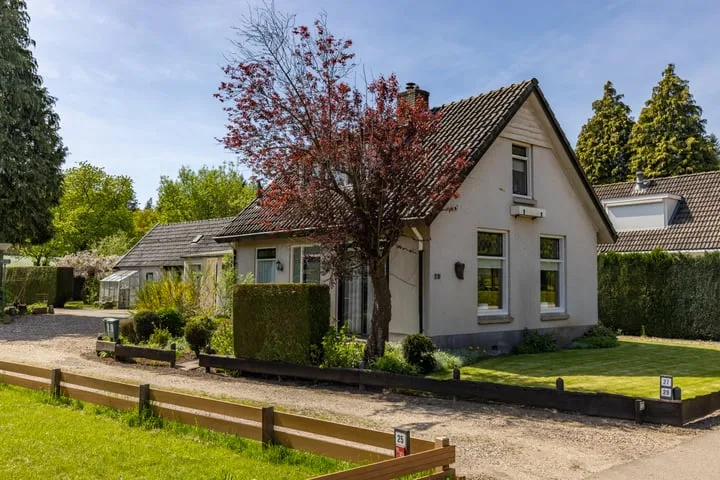
Houses sold in Wenum Wiesel

View 13 sold houses in Wenum Wiesel

Connected to: Vastgoed Nederland NVM Makelaars

On this page you will find recently sold homes in Wenum Wiesel. Use this overview to better estimate selling prices, popular neighborhoods, and the local housing supply before you choose a real estate agent. Also view the current housing supply with 21 houses in Wenum Wiesel.

Selection

Search and filter homes

Set your preferences and discover homes that suit you.

Total supply 241.455
Filters

Set price, area and other characteristics. Adjust a filter or click on Show homes. Location changes directly above.

Reset filters

You search for

  • Place Wenum Wiesel
  • Status Sold

Huis verkopen in Wenum Wiesel? Vergelijk verkoopmakelaars

Bekijk recente verkopen en ontvang gratis offertes van lokale verkoopmakelaars in Wenum Wiesel.

Free request a quote

  • Quotes in Wenum Wiesel
  • Non-binding
  • Personal
  • Gratis tarieven vergelijken

Zelf je woning verkopen in Wenum Wiesel? Vergelijk verkoopmakelaars in Wenum Wiesel of bekijk de beste verkoopmakelaars in Wenum Wiesel als referentie bij jouw keuze.

Vergelijk meerdere offertes

Makelaars maken scherpere voorstellen als ze weten dat je vergelijkt — vraag offertes aan voor verkoop of aankoop.

Frequently asked questions about sold homes in Wenum Wiesel

Short answers about housing prices, sold homes and comparing real estate agents in Wenum Wiesel.

Residential and neighborhood statistics in Wenum Wiesel

View current location data on residents, WOZ development, housing stock, energy consumption, business activity and safety in Wenum Wiesel. In 2026 were there 2.106 residents. The average WOZ value in 2025 is EUR 664.406.

These figures help to better assess and compare the housing stock in Wenum Wiesel with recent sold homes. Orient yourself then on suitable top real estate agents in Wenum Wiesel for sales advice in this region.

Residents

2.106

Last year: 2026

Average WOZ

EUR 664.406

Last year: 2025

Average income per person.

EUR 37.079

Source: AllNumbers

Crimes (current year)

38

Total registered

Demographics and WOZ development

Inhabitants per year

Inhabitants per year in Wenum Wiesel
Year Residents
2021 2.162
2022 2.122
2023 2.110
2024 2.120
2025 2.100
2026 2.106

Annual WOZ value

WOZ value per year in Wenum Wiesel
Year Average WOZ
2021 EUR 526.755
2022 EUR 561.584
2023 EUR 668.088
2024 EUR 680.568
2025 EUR 664.406

Composition of residents

Age build-up

65+: 535 0-15: 220 15-25: 255 25-45: 330 45-65: 735

Education level

Hoger

580

Praktisch

430

Middelbaar

620

Origin of residents (2025)

Europa

90

Nederland

1.895

Buiten Europa

120

Housing stock and construction periods

Types of homes

Hoekwoningen 6
Appartementen 39
Tussenwoningen 4
Vrijstaande woningen 652
Twee-onder-één-kap woningen 116

Construction period of buildings

Voor 1700 0
1700 tot 1900 64
1900 tot 1925 192
1925 tot 1950 233
1950 tot 1970 91
1970 tot 1980 36
1980 tot 1990 29
1990 tot 2000 58
2000 tot 2010 95
2010 tot 2020 54
2020 en later 29

Energy and sustainability

Energy label distribution

Label G

308

Label A

173

Label B

93

Label C

78

Label F

75

Label D

64

Label E

33

Label A+++

5

Label A+

4

Label A++

4

Label A++++

4

Label A+++++

0

Average energy consumption per year

Average energy consumption per year in Wenum Wiesel
Year Gas (m3) Electricity (kWh)
2020 2.030 4.121
2021 2.223 4.252
2022 1.756 4.032
2023 1.381 3.834
2024 1.321 4.083

Consumption per house type

Hoekwoning

Gas: 166 • Electricity: 721

Huurwoning

Gas: 1.160 • Electricity: 2.976

Koopwoning

Gas: 1.413 • Electricity: 3.956

Appartement

Gas: 159 • Electricity: 467

Tussenwoning

Gas: 897 • Electricity: 1.964

Vrijstaande woning

Gas: 1.478 • Electricity: 4.059

Twee-onder-één-kap woning

Gas: 1.146 • Electricity: 3.215

Business activity in Wenum Wiesel (2025)

Handel en HORECA 110
Nijverheid en energie 55
Zakelijke dienstverlening 115
Overheid, onderwijs en zorg 65
Landbouw, bosbouw en visserij 20
Vervoer, informatie en communicatie 25
Financiele diensten en onroerendgoed 50
Cultuur, recreatie en overige diensten 40

Total number of company establishments: 470

Recent crime statistics

Recent crime statistics in Wenum Wiesel
Period Crimes
jan 2026 5
jul 2025 4
jun 2025 2
mei 2025 1
mrt 2025 1
mrt 2026 4
nov 2024 0
nov 2025 6
okt 2024 2
okt 2025 3
sep 2024 2
sep 2025 3

These figures give an indicative picture of safety trends in the living environment of Wenum Wiesel.

Frequently asked questions about living in Wenum Wiesel

Short answers based on current local statistics, handy for a quick comparison of the living environment.

Hoeveel inwoners heeft Wenum Wiesel?

Wenum Wiesel telt in 2026 ongeveer 2.106 inwoners.

Wat is de gemiddelde WOZ-waarde in Wenum Wiesel?

De gemiddelde WOZ-waarde in Wenum Wiesel is in 2025 circa € 664.406.

Wat is het gemiddelde inkomen per inwoner in Wenum Wiesel?

Het gemiddelde inkomen per inwoner in Wenum Wiesel ligt rond € 37.079 per jaar.

Hoe veilig is wonen in Wenum Wiesel?

Voor het huidige jaar gaat het om ongeveer 38 geregistreerde misdrijven. Gebruik deze cijfers als indicatie en vergelijk trends per periode.

Welke woningtypen komen het meest voor in Wenum Wiesel?

In Wenum Wiesel komt vooral "Vrijstaande woningen" veel voor, met ongeveer 652 woningen.

Gratis vrijblijvende offertes ontvangen

Vergelijk meerdere makelaars en kies de beste match.