- Available
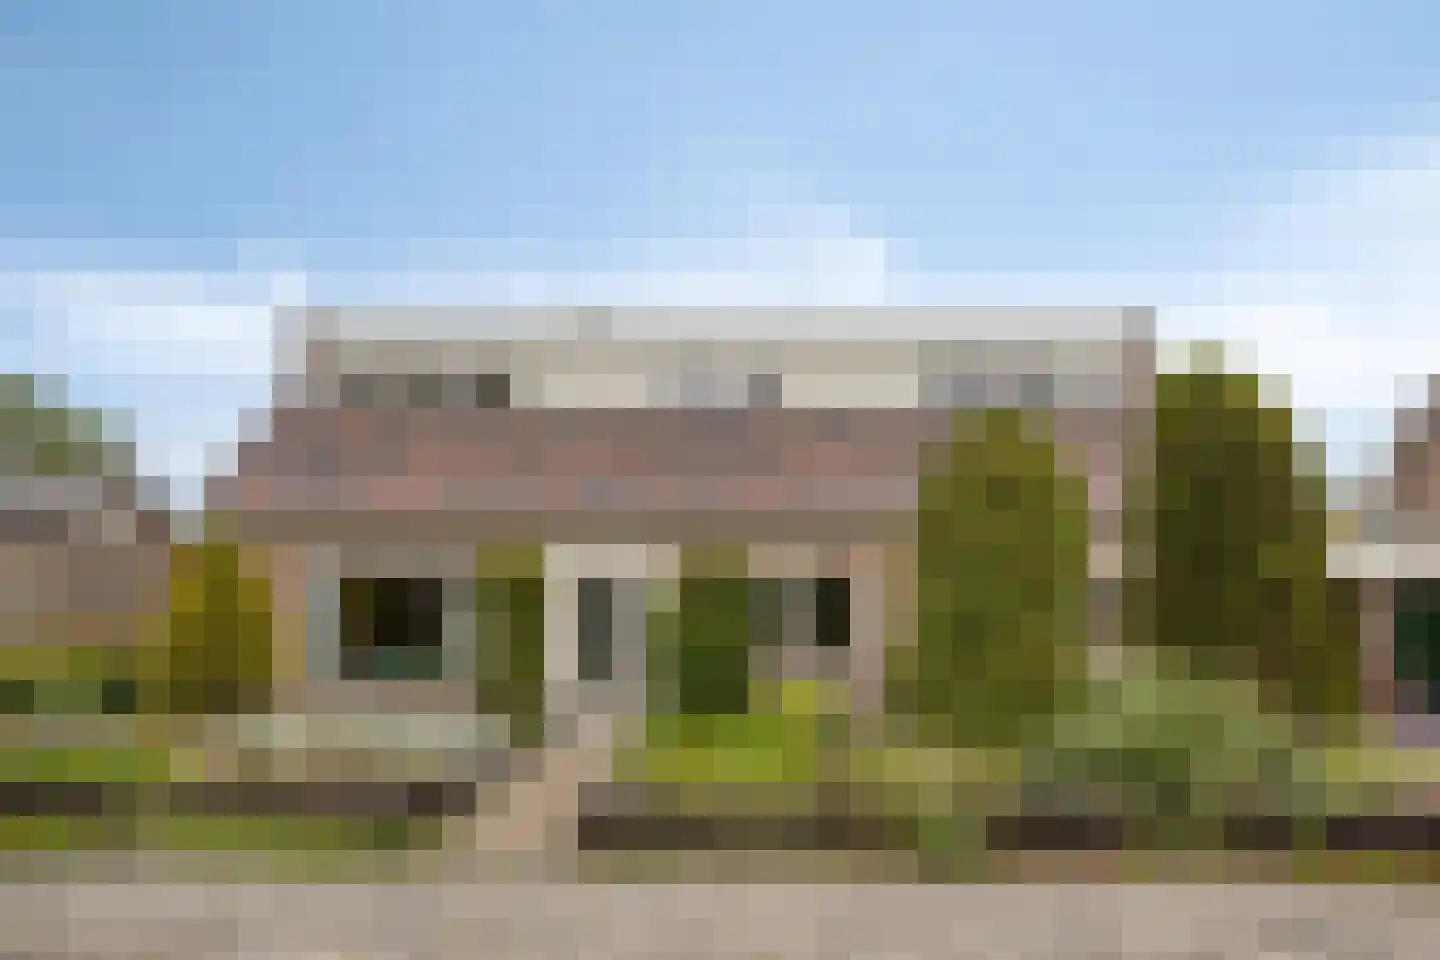
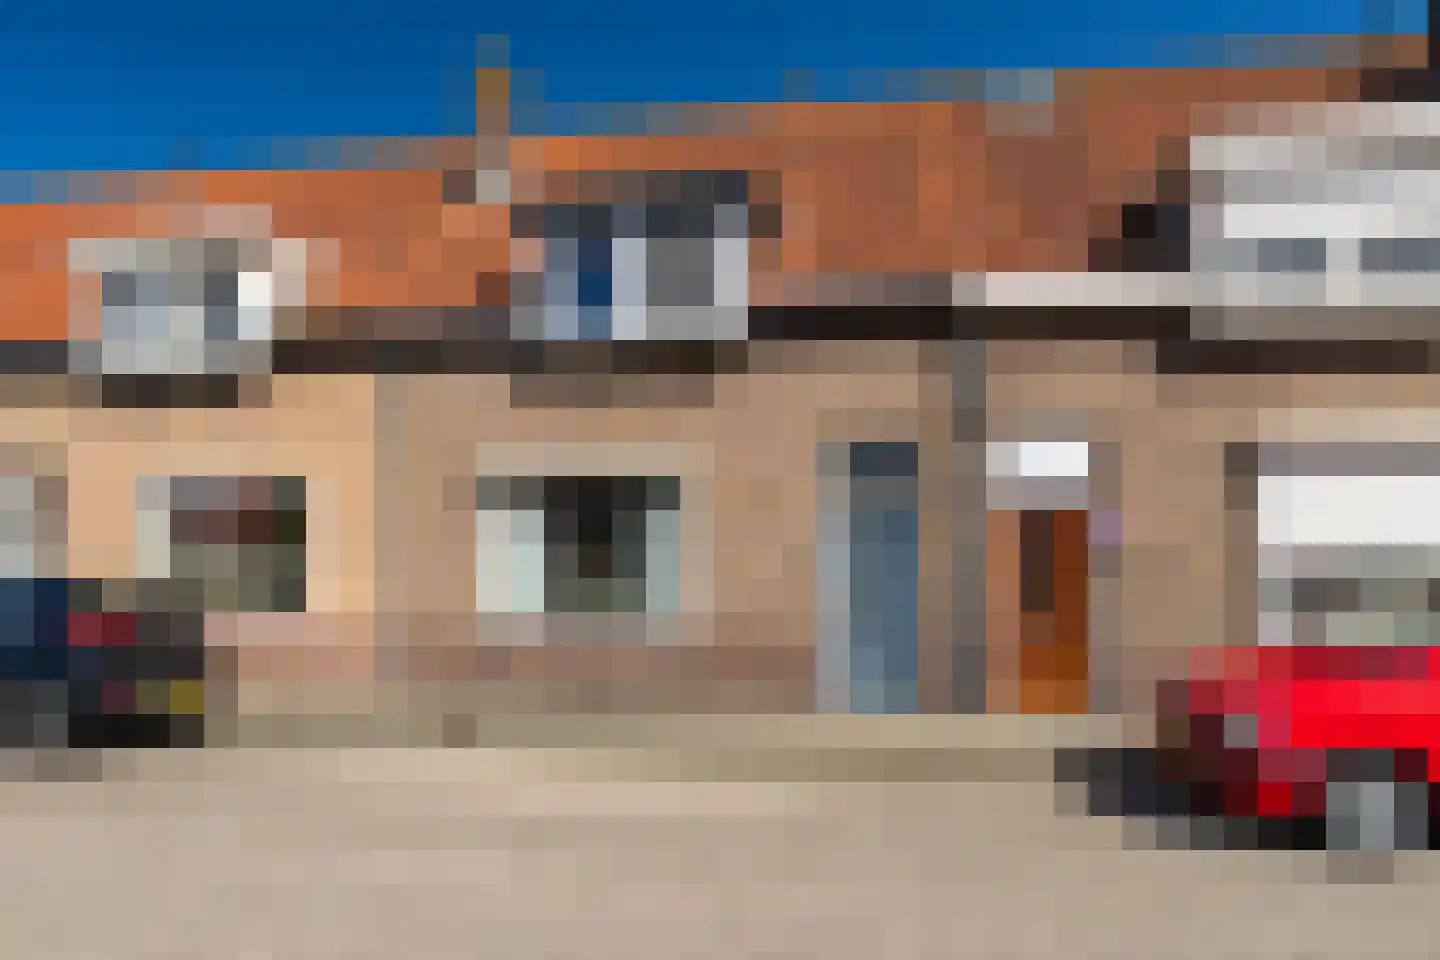
Laan van Welgelegen 68
4251KM Werkendam
€ 585.000 k.k.
€ 3.799/m²
- Living area
- 154 m²
- Land area
- 416 m²
- Bedrooms
- 5
Searching in 114 houses in Werkendam
Type to search. Use arrow down and arrow up to navigate through results and press Enter to open.
Hidden search suggestions.
View current properties in Werkendam or search targeted on street, postal code and property characteristics.
View the current housing stock in Werkendam and quickly filter by price, living area, rooms and more. There are currently 114 houses in this place within our selection. View also 82 sold houses in Werkendam for extra insight into the local housing market.
4251KM Werkendam
€ 585.000 k.k.
€ 3.799/m²
4251BE Werkendam
€ 549.000 k.k.
€ 4.128/m²
4251GK Werkendam
€ 450.000 k.k.
€ 4.545/m²
4251PS Werkendam
€ 625.000 k.k.
€ 3.511/m²
4251CK Werkendam
€ 359.000 k.k.
€ 3.860/m²
4251JB Werkendam
€ 400.000 k.k.
€ 3.670/m²
4251VS Werkendam
€ 425.000 k.k.
€ 5.449/m²
4251LZ Werkendam
€ 745.000 k.k.
€ 3.211/m²
4251CL Werkendam
€ 385.000 k.k.
€ 4.053/m²
4251GC Werkendam
€ 1.495.000 k.k.
€ 5.339/m²
4251JN Werkendam
€ 475.000 k.k.
4251JN Werkendam
€ 575.000 k.k.
4251HR Werkendam
€ 639.000 k.k.
4251DW Werkendam
€ 375.000 k.k.
€ 3.049/m²
4251WN Werkendam
€ 389.000 k.k.
€ 3.602/m²
4251CV Werkendam
€ 475.000 k.k.
€ 2.554/m²
4251CT Werkendam
€ 495.000 k.k.
€ 4.459/m²
4251WL Werkendam
€ 385.000 k.k.
€ 3.632/m²
4251HW Werkendam
€ 380.000 k.k.
€ 3.585/m²
4251JK Werkendam
€ 1.250.000 k.k.
€ 4.355/m²
4251DK Werkendam
€ 795.000 k.k.
€ 3.822/m²
4251AG Werkendam
€ 395.000 k.k.
€ 3.435/m²
4251EZ Werkendam
€ 500.000 k.k.
€ 3.876/m²
4251BD Werkendam
€ 349.000 k.k.
€ 4.058/m²
4251KL Werkendam
€ 350.000 k.k.
4251DR Werkendam
€ 450.000 k.k.
€ 3.913/m²
4251HD Werkendam
€ 359.000 k.k.
€ 3.663/m²
4251XG Werkendam
€ 395.000 k.k.
€ 4.877/m²
Get free quotes from real estate agents with local market knowledge. Compare more than 26 real estate agents in Werkendam.
Selling a home in Werkendam? View the sales-oriented guide sell a house in Werkendam, compare all real estate agents in Werkendam or view the top 10 real estate agents in Werkendam for extra context to your choice.
Real estate agents make sharper offers when they know you're comparing — ask for quotes for sale or purchase.
Practical answers about housing supply, sales and comparing real estate agents in Werkendam.
The costs of a real estate agent in Werkendam depend on commission, setup costs, property presentation and the chosen service. Compare the 26 real estate agents in Werkendam via the real estate agent page and request multiple quotes to compare rates and approach well.
Within our selection, we are currently showing 114 houses in Werkendam. View also the sold houses in Werkendam to compare the current offering with recent transactions.
Take into account not only price and living area but also maintenance, energy label, location, outdoor space and sales status. This way you compare houses in Werkendam on more than just the asking price.
A local real estate agent knows the neighborhoods, recent transactions and demand in Werkendam. By comparing 26 real estate agents in the region you get a better insight into prices, sales strategy and expected yield; the top 10 in Werkendam provides a useful starting point.
Yes, when making a sales plan, a valuation in Werkendam is wise. You gain insight into a realistic asking price and can then compare offers from real estate agents specifically.
View current location data on residents, WOZ development, housing stock, energy consumption, business activity and safety in Werkendam. In 2025 were there 11.875 residents. The average WOZ value in 2025 is EUR 374.000.
These figures help to better assess and compare the housing stock in Werkendam with recent sold homes. Orient yourself then on suitable top real estate agents in Werkendam for sales advice in this region.
Residents
11.875
Last year: 2025
Average WOZ
EUR 374.000
Last year: 2025
Average income per person.
EUR 31.300
Source: AllNumbers
Crimes (current year)
304
Total registered
| Year | Residents |
|---|---|
| 2021 | 11.215 |
| 2022 | 11.280 |
| 2023 | 11.495 |
| 2024 | 11.580 |
| 2025 | 11.875 |
| Year | Average WOZ |
|---|---|
| 2021 | EUR 272.000 |
| 2022 | EUR 301.000 |
| 2023 | EUR 349.000 |
| 2024 | EUR 365.000 |
| 2025 | EUR 374.000 |
Hoger
1.330
Praktisch
3.140
Middelbaar
4.010
Europa
630
Nederland
10.565
Buiten Europa
675
Label C
1.244
Label A
1.009
Label B
840
Label D
441
Label G
368
Label F
319
Label E
237
Label A+++
157
Label A+
75
Label A++++
55
Label A++
37
Label A+++++
1
| Year | Gas (m3) | Electricity (kWh) |
|---|---|---|
| 2020 | 1.240 | 3.090 |
| 2021 | 1.400 | 3.130 |
| 2022 | 1.080 | 2.970 |
| 2023 | 920 | 2.820 |
| 2024 | 880 | 2.840 |
Hoekwoning
Gas: 930 • Electricity: 2.730
Huurwoning
Gas: 800 • Electricity: 2.120
Koopwoning
Gas: 990 • Electricity: 3.210
Appartement
Gas: 630 • Electricity: 1.970
Tussenwoning
Gas: 810 • Electricity: 2.480
Vrijstaande woning
Gas: 1.310 • Electricity: 4.180
Twee-onder-één-kap woning
Gas: 1.030 • Electricity: 3.110
Total number of company establishments: 1.865
| Period | Crimes |
|---|---|
| jan 2026 | 21 |
| jul 2025 | 26 |
| jun 2025 | 33 |
| mei 2025 | 27 |
| mrt 2025 | 24 |
| mrt 2026 | 25 |
| nov 2024 | 25 |
| nov 2025 | 25 |
| okt 2024 | 28 |
| okt 2025 | 24 |
| sep 2024 | 31 |
| sep 2025 | 26 |
These figures give an indicative picture of safety trends in the living environment of Werkendam.
Short answers based on current local statistics, handy for a quick comparison of the living environment.
Werkendam telt in 2025 ongeveer 11.875 inwoners.
De gemiddelde WOZ-waarde in Werkendam is in 2025 circa € 374.000.
Het gemiddelde inkomen per inwoner in Werkendam ligt rond € 31.300 per jaar.
Voor het huidige jaar gaat het om ongeveer 304 geregistreerde misdrijven. Gebruik deze cijfers als indicatie en vergelijk trends per periode.
In Werkendam komt vooral "Tussenwoningen" veel voor, met ongeveer 1.680 woningen.