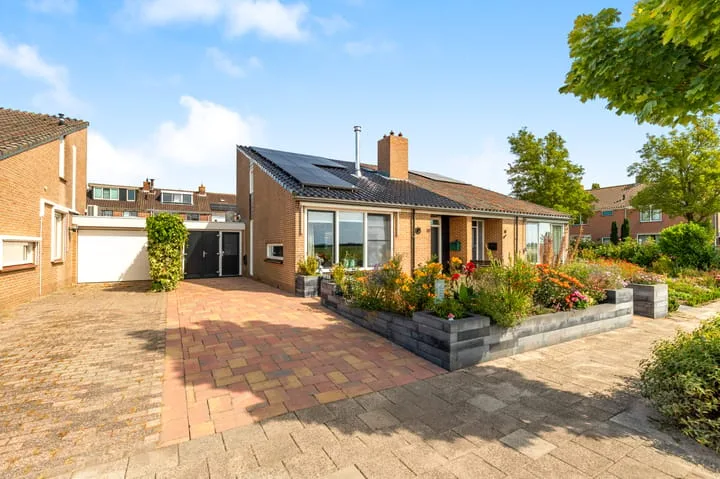
Houses sold in Westwoud

View 12 sold houses in Westwoud

Connected to: Vastgoed Nederland NVM Makelaars

On this page you will find recently sold homes in Westwoud. Use this overview to better estimate selling prices, popular neighborhoods, and the local housing supply before you choose a real estate agent. Also view the current housing supply with 16 houses in Westwoud.

Selection

Search and filter homes

Set your preferences and discover homes that suit you.

Total supply 241.443
Filters

Set price, area and other characteristics. Adjust a filter or click on Show homes. Location changes directly above.

Reset filters

You search for

  • Place Westwoud
  • Status Sold

Huis verkopen in Westwoud? Vergelijk verkoopmakelaars

Bekijk recente verkopen en ontvang gratis offertes van lokale verkoopmakelaars in Westwoud.

Free request a quote

  • Quotes in Westwoud
  • Non-binding
  • Personal
  • Gratis tarieven vergelijken

Zelf je woning verkopen in Westwoud? Vergelijk verkoopmakelaars in Westwoud of bekijk de beste verkoopmakelaars in Westwoud als referentie bij jouw keuze.

Vergelijk meerdere offertes

Makelaars maken scherpere voorstellen als ze weten dat je vergelijkt — vraag offertes aan voor verkoop of aankoop.

Frequently asked questions about sold homes in Westwoud

Short answers about housing prices, sold homes and comparing real estate agents in Westwoud.

Residential and neighborhood statistics in Westwoud

View current location data on residents, WOZ development, housing stock, energy consumption, business activity and safety in Westwoud. In 2025 were there 1.850 residents. The average WOZ value in 2025 is EUR 417.000.

These figures help to better assess and compare the housing stock in Westwoud with recent sold homes. Orient yourself then on suitable top real estate agents in Westwoud for sales advice in this region.

Residents

1.850

Last year: 2025

Average WOZ

EUR 417.000

Last year: 2025

Average income per person.

EUR 32.200

Source: AllNumbers

Crimes (current year)

34

Total registered

Demographics and WOZ development

Inhabitants per year

Inhabitants per year in Westwoud
Year Residents
2021 1.815
2022 1.815
2023 1.830
2024 1.830
2025 1.850

Annual WOZ value

WOZ value per year in Westwoud
Year Average WOZ
2021 EUR 304.000
2022 EUR 338.000
2023 EUR 397.000
2024 EUR 407.000
2025 EUR 417.000

Composition of residents

Age build-up

65+: 395 0-15: 305 15-25: 260 25-45: 410 45-65: 480

Education level

Hoger

310

Praktisch

460

Middelbaar

610

Origin of residents (2025)

Europa

100

Nederland

1.655

Buiten Europa

95

Housing stock and construction periods

Types of homes

Hoekwoningen 127
Appartementen 92
Tussenwoningen 207
Vrijstaande woningen 278
Twee-onder-één-kap woningen 112

Construction period of buildings

Voor 1700 0
1700 tot 1900 59
1900 tot 1925 68
1925 tot 1950 47
1950 tot 1970 165
1970 tot 1980 157
1980 tot 1990 79
1990 tot 2000 75
2000 tot 2010 95
2010 tot 2020 35
2020 en later 42

Energy and sustainability

Energy label distribution

Label A

160

Label C

160

Label B

109

Label G

103

Label D

101

Label A+

34

Label F

28

Label A+++

19

Label E

15

Label A++

14

Label A++++

8

Label A+++++

0

Average energy consumption per year

Average energy consumption per year in Westwoud
Year Gas (m3) Electricity (kWh)
2020 1.480 3.220
2021 1.690 3.360
2022 1.290 3.130
2023 1.090 2.970
2024 1.020 3.110

Consumption per house type

Hoekwoning

Gas: 880 • Electricity: 2.440

Huurwoning

Gas: 820 • Electricity: 2.220

Koopwoning

Gas: 1.170 • Electricity: 3.210

Appartement

Gas: 880 • Electricity: 2.130

Tussenwoning

Gas: 800 • Electricity: 2.300

Vrijstaande woning

Gas: 1.460 • Electricity: 3.830

Twee-onder-één-kap woning

Gas: 1.020 • Electricity: 2.990

Business activity in Westwoud (2025)

Handel en HORECA 25
Nijverheid en energie 50
Zakelijke dienstverlening 50
Overheid, onderwijs en zorg 35
Landbouw, bosbouw en visserij 30
Vervoer, informatie en communicatie 10
Financiele diensten en onroerendgoed 15
Cultuur, recreatie en overige diensten 35

Total number of company establishments: 250

Recent crime statistics

Recent crime statistics in Westwoud
Period Crimes
jan 2025 3
jan 2026 3
jul 2025 5
jun 2025 2
mei 2025 2
mrt 2025 4
nov 2024 3
nov 2025 3
okt 2024 3
okt 2025 2
sep 2024 3
sep 2025 1

These figures give an indicative picture of safety trends in the living environment of Westwoud.

Frequently asked questions about living in Westwoud

Short answers based on current local statistics, handy for a quick comparison of the living environment.

Hoeveel inwoners heeft Westwoud?

Westwoud telt in 2025 ongeveer 1.850 inwoners.

Wat is de gemiddelde WOZ-waarde in Westwoud?

De gemiddelde WOZ-waarde in Westwoud is in 2025 circa € 417.000.

Wat is het gemiddelde inkomen per inwoner in Westwoud?

Het gemiddelde inkomen per inwoner in Westwoud ligt rond € 32.200 per jaar.

Hoe veilig is wonen in Westwoud?

Voor het huidige jaar gaat het om ongeveer 34 geregistreerde misdrijven. Gebruik deze cijfers als indicatie en vergelijk trends per periode.

Welke woningtypen komen het meest voor in Westwoud?

In Westwoud komt vooral "Vrijstaande woningen" veel voor, met ongeveer 278 woningen.

Gratis vrijblijvende offertes ontvangen

Vergelijk meerdere makelaars en kies de beste match.