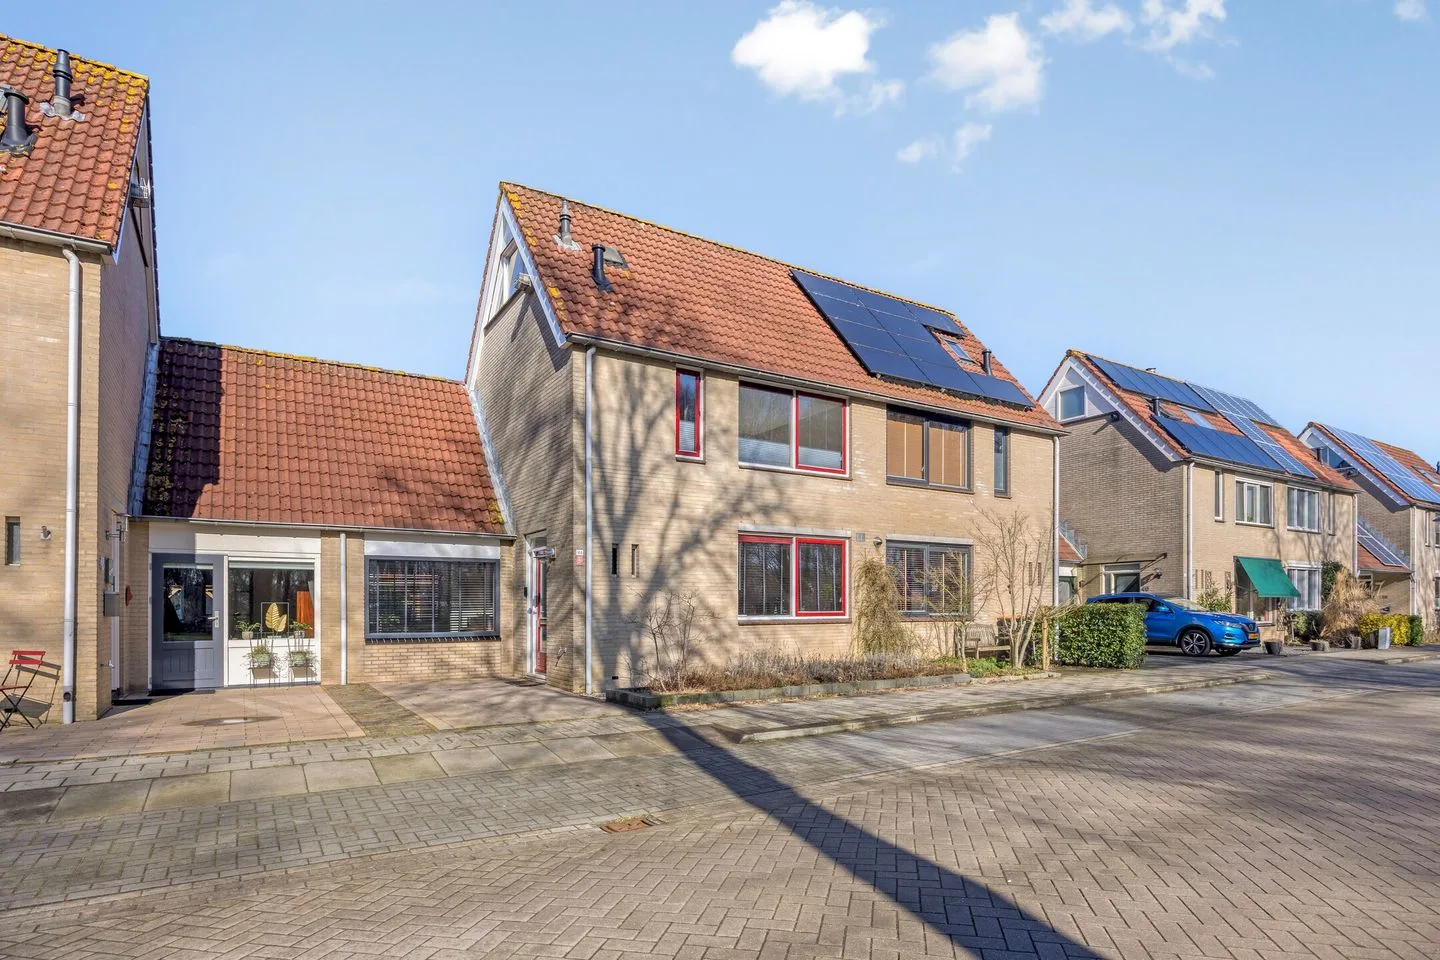
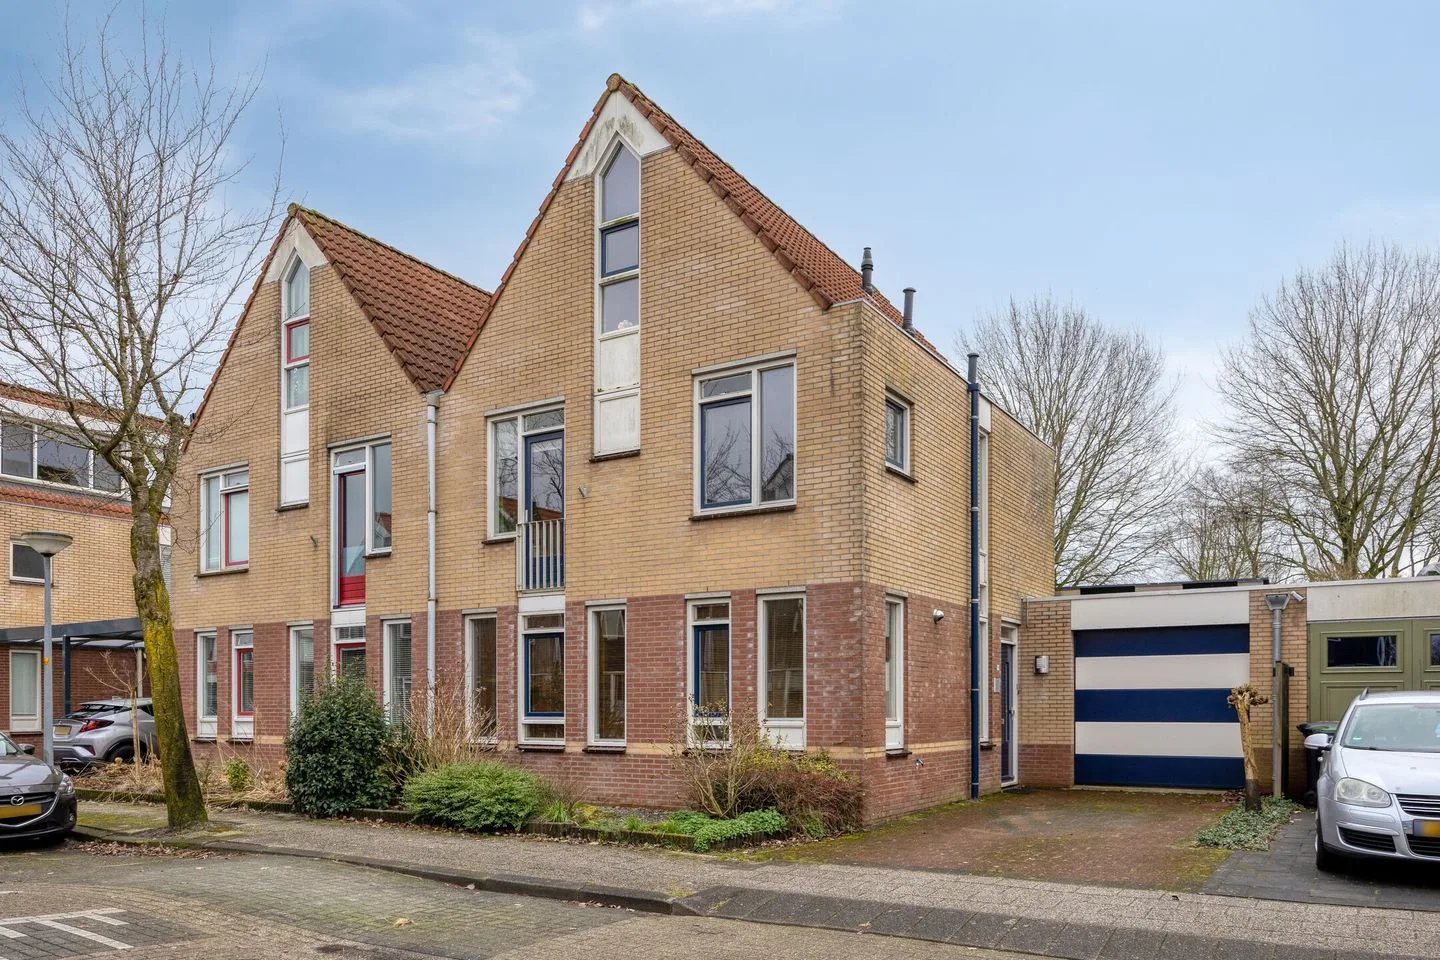
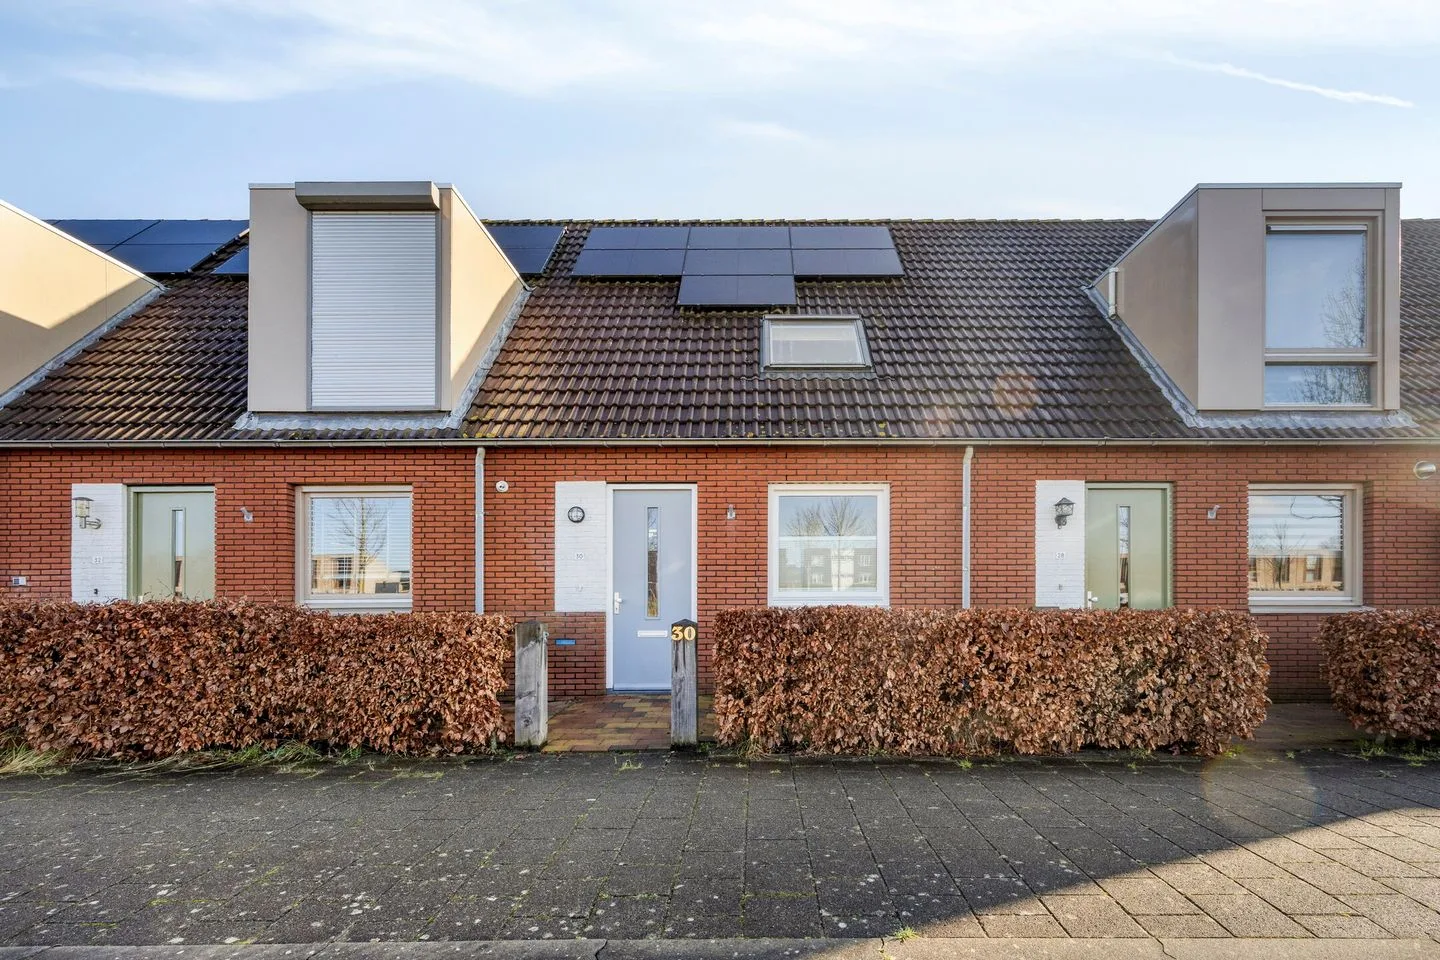
- Sold
Maalgang 24
3894GD Zeewolde
€ 595.000 k.k.
€ 3.914/m²
- Living area
- 152 m²
- Land area
- 280 m²
- Bedrooms
- 4
Searching in 407 houses in Zeewolde
Type to search. Use arrow down and arrow up to navigate through results and press Enter to open.
Hidden search suggestions.
View current properties in Zeewolde or search targeted on street, postal code and property characteristics.
View the current housing stock in Zeewolde and quickly filter by price, living area, rooms and more. There are currently 407 houses in this place within our selection. View also 277 sold houses in Zeewolde for extra insight into the local housing market.
3894GD Zeewolde
€ 595.000 k.k.
€ 3.914/m²
3893CR Zeewolde
€ 485.000 k.k.
€ 3.702/m²
3892EJ Zeewolde
€ 565.000 k.k.
€ 4.035/m²
3894ER Zeewolde
€ 419.500 k.k.
€ 4.369/m²
3893KB Zeewolde
€ 435.000 k.k.
€ 3.595/m²
3893JC Zeewolde
€ 375.000 k.k.
€ 3.989/m²
3894DG Zeewolde
€ 785.000 k.k.
€ 4.046/m²
3891ET Zeewolde
€ 325.000 k.k.
€ 3.963/m²
3894HK Zeewolde
€ 586.200
€ 4.310/m²
3894CA Zeewolde
€ 650.000 k.k.
€ 4.577/m²
3891ZS Zeewolde
€ 465.000 k.k.
€ 3.207/m²
3893DJ Zeewolde
€ 450.000 k.k.
€ 3.813/m²
3891BX Zeewolde
€ 375.000 k.k.
€ 3.750/m²
3891HD Zeewolde
€ 275.000 k.k.
€ 4.661/m²
3893HD Zeewolde
€ 485.000 k.k.
€ 3.277/m²
3893JE Zeewolde
€ 700.000 k.k.
€ 3.482/m²
3893JE Zeewolde
€ 699.500 k.k.
€ 3.515/m²
3891CZ Zeewolde
€ 500.000 k.k.
€ 4.167/m²
3891EP Zeewolde
€ 475.000 k.k.
€ 3.417/m²
3893JK Zeewolde
€ 468.000 k.k.
€ 3.600/m²
3898LL Zeewolde
€ 465.000 k.k.
€ 3.875/m²
3894DD Zeewolde
€ 385.000 k.k.
€ 5.133/m²
3892BJ Zeewolde
€ 500.000 k.k.
€ 3.623/m²
3893JJ Zeewolde
€ 450.000 k.k.
€ 3.462/m²
3894DK Zeewolde
€ 350.000 k.k.
€ 4.930/m²
3891KG Zeewolde
€ 530.000 k.k.
€ 3.193/m²
3891EG Zeewolde
€ 487.500 k.k.
€ 4.314/m²
3892WB Zeewolde
€ 400.000 k.k.
€ 3.390/m²
Get free quotes from real estate agents with local market knowledge. Compare more than 33 real estate agents in Zeewolde.
Selling a home in Zeewolde? View the sales-oriented guide sell a house in Zeewolde, compare all real estate agents in Zeewolde or view the top 10 real estate agents in Zeewolde for extra context to your choice.
Real estate agents make sharper offers when they know you're comparing — ask for quotes for sale or purchase.
Practical answers about housing supply, sales and comparing real estate agents in Zeewolde.
The costs of a real estate agent in Zeewolde depend on commission, setup costs, property presentation and the chosen service. Compare the 33 real estate agents in Zeewolde via the real estate agent page and request multiple quotes to compare rates and approach well.
Within our selection, we are currently showing 407 houses in Zeewolde. View also the sold houses in Zeewolde to compare the current offering with recent transactions.
Take into account not only price and living area but also maintenance, energy label, location, outdoor space and sales status. This way you compare houses in Zeewolde on more than just the asking price.
A local real estate agent knows the neighborhoods, recent transactions and demand in Zeewolde. By comparing 33 real estate agents in the region you get a better insight into prices, sales strategy and expected yield; the top 10 in Zeewolde provides a useful starting point.
Yes, when making a sales plan, a valuation in Zeewolde is wise. You gain insight into a realistic asking price and can then compare offers from real estate agents specifically.
View current location data on residents, WOZ development, housing stock, energy consumption, business activity and safety in Zeewolde. In 2026 were there 24.610 residents. The average WOZ value in 2025 is EUR 423.000.
These figures help to better assess and compare the housing stock in Zeewolde with recent sold homes. Orient yourself then on suitable top real estate agents in Zeewolde for sales advice in this region.
Residents
24.610
Last year: 2026
Average WOZ
EUR 423.000
Last year: 2025
Average income per person.
EUR 35.900
Source: AllNumbers
Crimes (current year)
776
Total registered
| Year | Residents |
|---|---|
| 2022 | 23.348 |
| 2023 | 23.692 |
| 2024 | 23.899 |
| 2025 | 24.291 |
| 2026 | 24.610 |
| Year | Average WOZ |
|---|---|
| 2021 | EUR 305.000 |
| 2022 | EUR 331.000 |
| 2023 | EUR 393.000 |
| 2024 | EUR 413.000 |
| 2025 | EUR 423.000 |
Hoger
32
Praktisch
22
Middelbaar
46
Europa
2.628
Nederland
18.756
Buiten Europa
2.907
Label A
4.503
Label B
3.030
Label C
2.993
Label A+
480
Label A++
392
Label A+++
339
Label A++++
73
Label D
48
Label E
41
Label F
17
Label G
7
Label A+++++
5
| Year | Gas (m3) | Electricity (kWh) |
|---|---|---|
| 2020 | 920 | 3.050 |
| 2021 | 1.030 | 3.100 |
| 2022 | 790 | 2.890 |
| 2023 | 660 | 2.740 |
| 2024 | 620 | 2.830 |
Hoekwoning
Gas: 640 • Electricity: 2.770
Huurwoning
Gas: 530 • Electricity: 2.060
Koopwoning
Gas: 720 • Electricity: 3.030
Appartement
Gas: 420 • Electricity: 1.860
Tussenwoning
Gas: 600 • Electricity: 2.580
Vrijstaande woning
Gas: 1.180 • Electricity: 4.030
Twee-onder-één-kap woning
Gas: 750 • Electricity: 3.570
Total number of company establishments: 3.725
| Period | Crimes |
|---|---|
| jan 2026 | 36 |
| jul 2025 | 74 |
| jun 2025 | 94 |
| mei 2025 | 49 |
| mrt 2025 | 94 |
| mrt 2026 | 52 |
| nov 2024 | 70 |
| nov 2025 | 36 |
| okt 2024 | 74 |
| okt 2025 | 58 |
| sep 2024 | 63 |
| sep 2025 | 46 |
These figures give an indicative picture of safety trends in the living environment of Zeewolde.
Short answers based on current local statistics, handy for a quick comparison of the living environment.
Zeewolde telt in 2026 ongeveer 24.610 inwoners.
De gemiddelde WOZ-waarde in Zeewolde is in 2025 circa € 423.000.
Het gemiddelde inkomen per inwoner in Zeewolde ligt rond € 35.900 per jaar.
Voor het huidige jaar gaat het om ongeveer 776 geregistreerde misdrijven. Gebruik deze cijfers als indicatie en vergelijk trends per periode.
In Zeewolde komt vooral "Tussenwoningen" veel voor, met ongeveer 4.605 woningen.