- Available
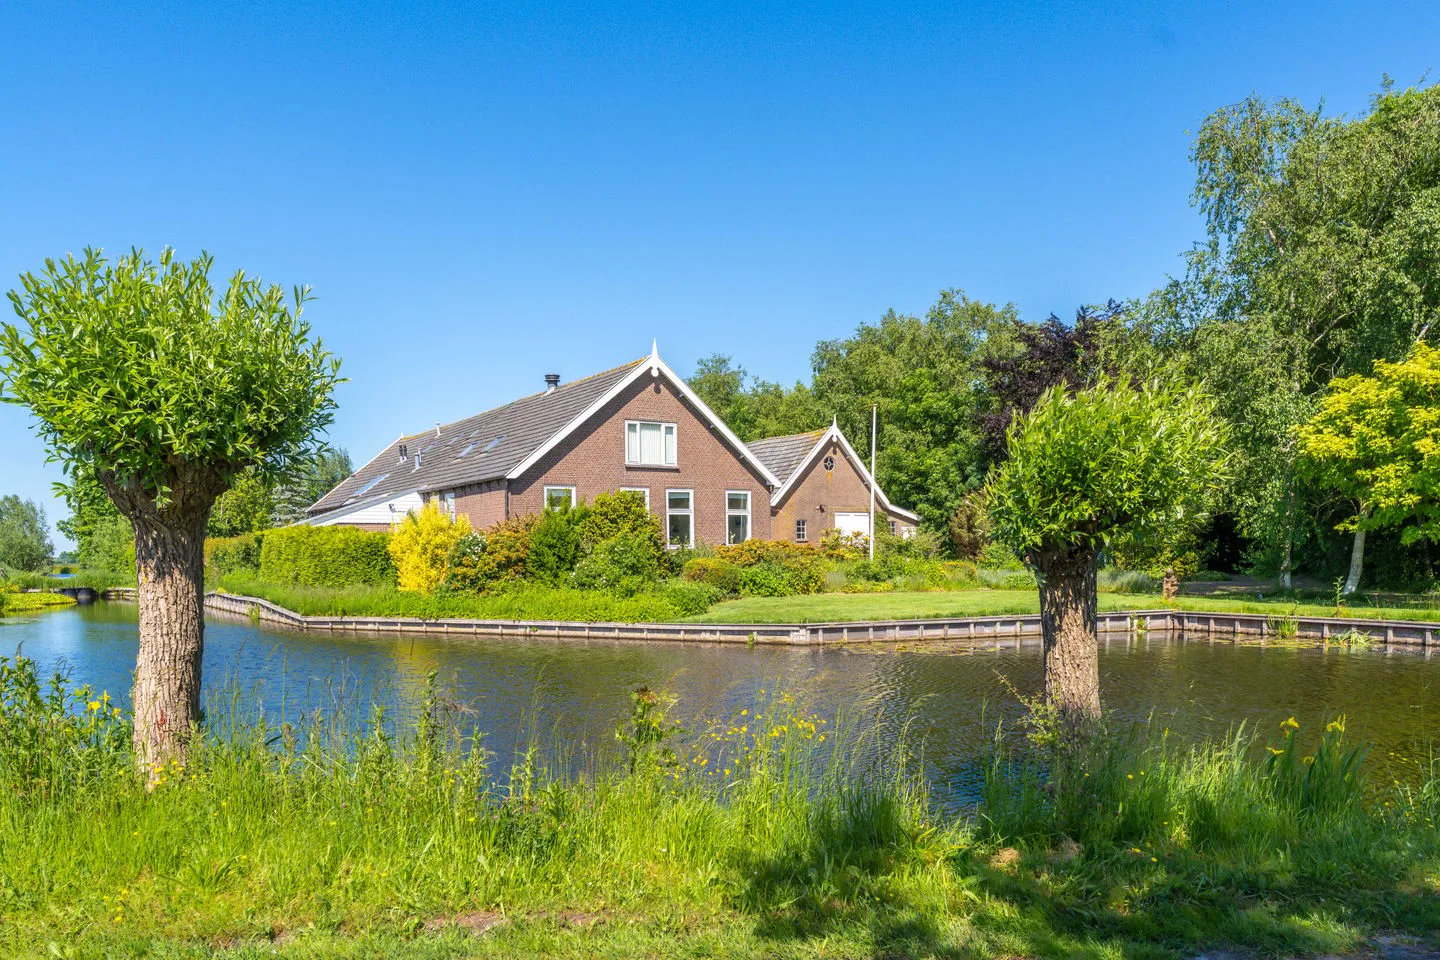
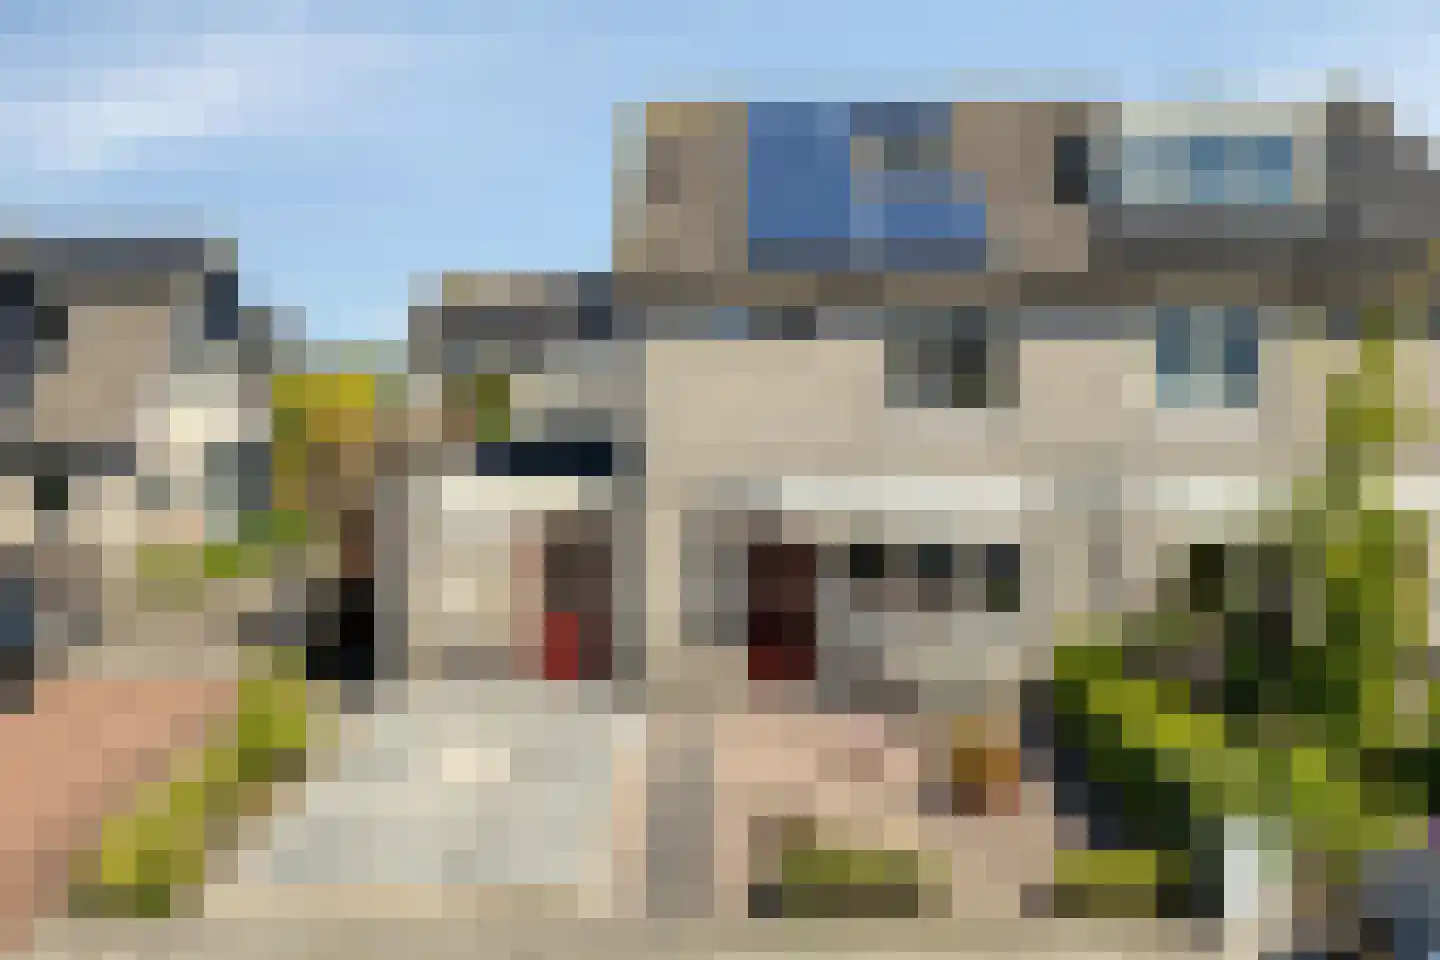
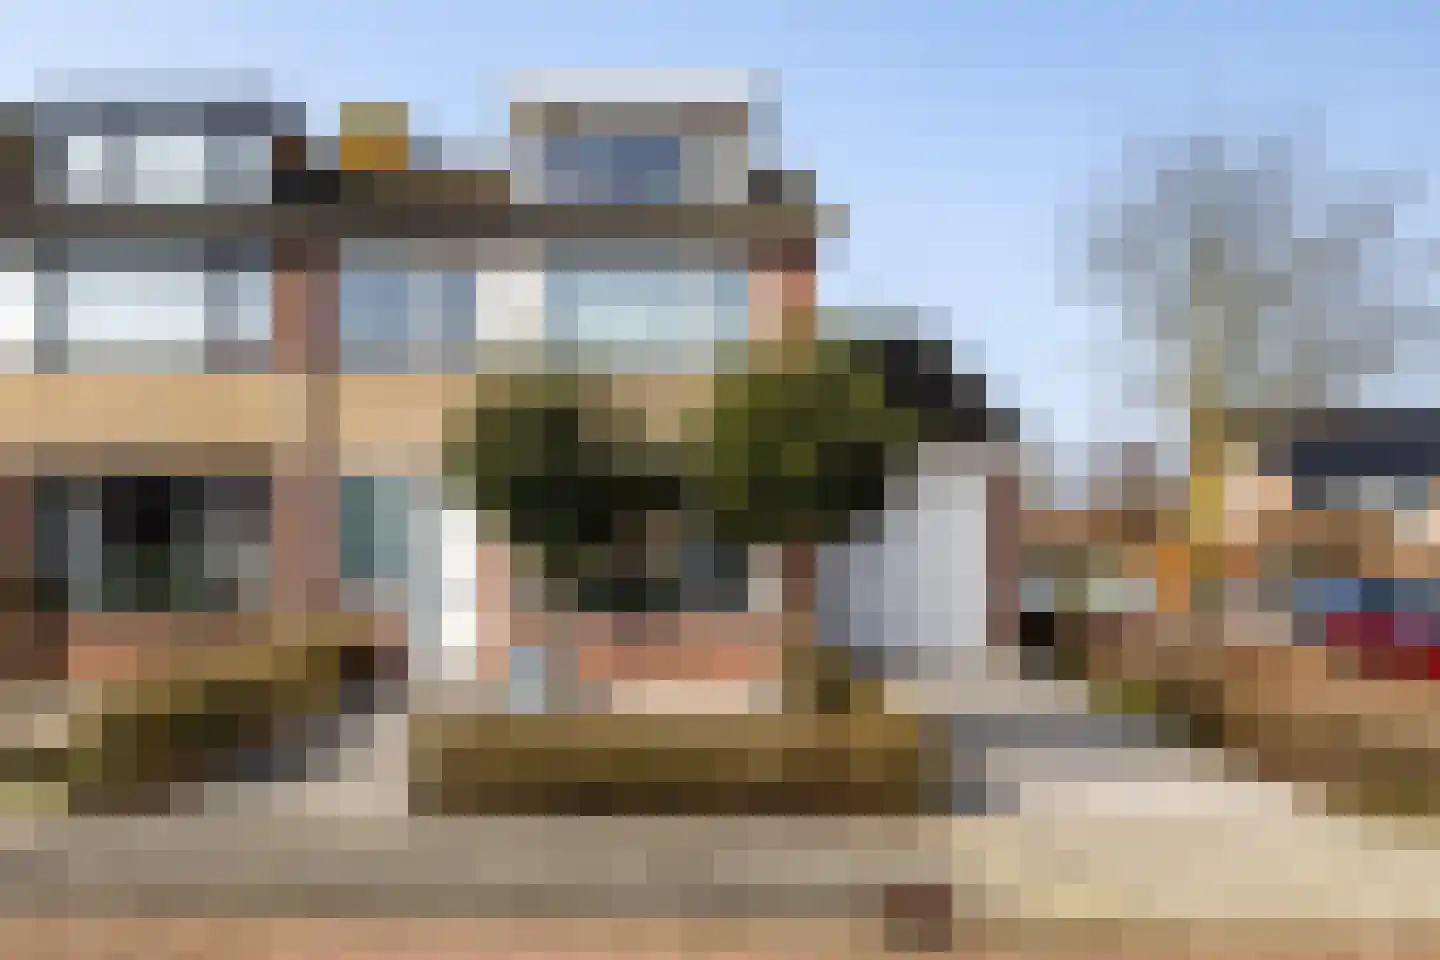
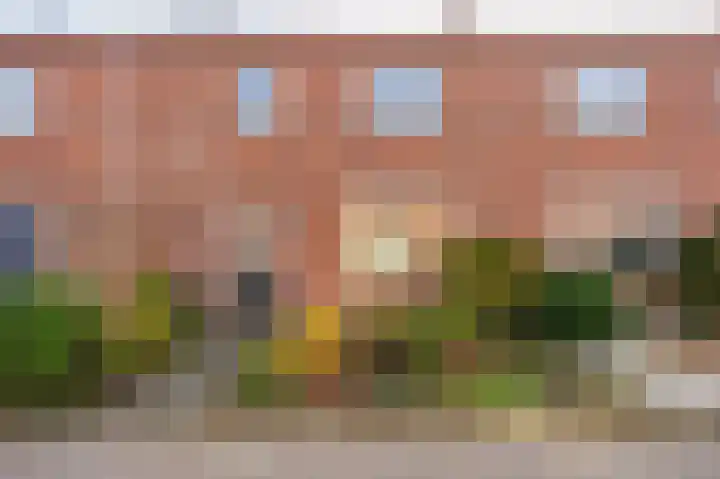
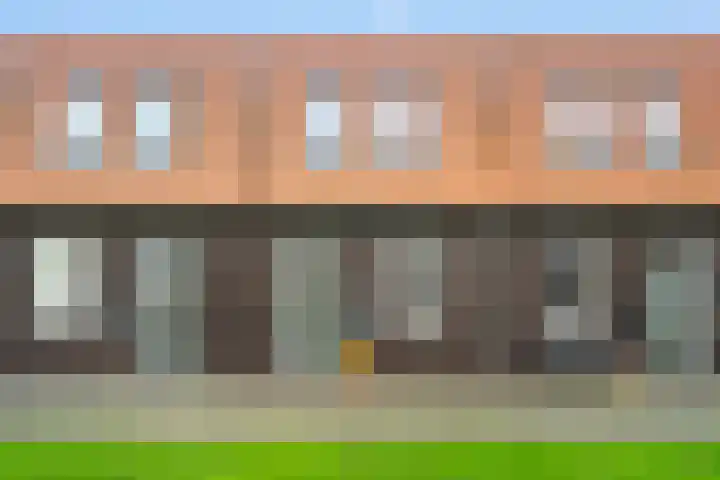
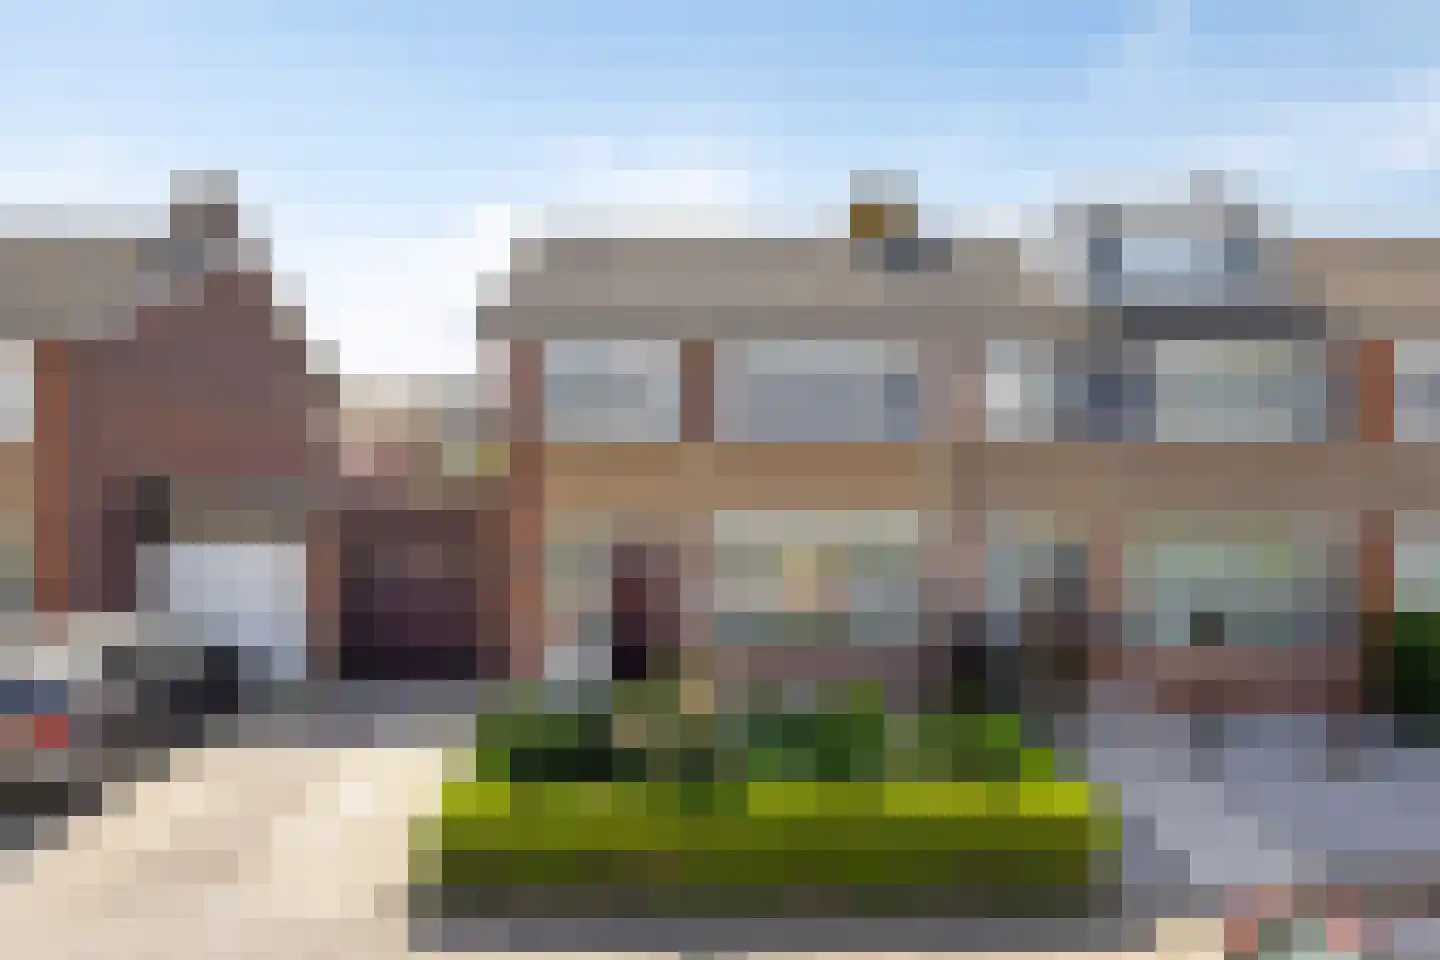
Prinses Beatrixstraat 27
3474JV Zegveld
€ 535.000 k.k.
€ 4.084/m²
- Living area
- 131 m²
- Land area
- 213 m²
- Bedrooms
- 4
Searching in 20 houses in Zegveld
Type to search. Use arrow down and arrow up to navigate through results and press Enter to open.
Hidden search suggestions.
View current properties in Zegveld or search targeted on street, postal code and property characteristics.
View the current housing stock in Zegveld and quickly filter by price, living area, rooms and more. There are currently 20 houses in this place within our selection. View also 14 sold houses in Zegveld for extra insight into the local housing market.
3474JV Zegveld
€ 535.000 k.k.
€ 4.084/m²
3474JS Zegveld
€ 545.000 k.k.
€ 4.192/m²
3474KG Zegveld
€ 900.000 k.k.
3474JR Zegveld
€ 460.000 k.k.
€ 3.932/m²
3474KG Zegveld
€ 1.800.000 k.k.
€ 5.573/m²
3474HN Zegveld
€ 669.500 k.k.
€ 4.405/m²
3474NA Zegveld
€ 495.000 k.k.
€ 4.304/m²
3474KC Zegveld
€ 335.000 k.k.
€ 5.154/m²
3474KC Zegveld
€ 285.000 k.k.
€ 6.333/m²
3474JW Zegveld
€ 625.000 k.k.
€ 4.310/m²
3474JM Zegveld
€ 390.000 k.k.
€ 5.200/m²
3474JL Zegveld
€ 380.000 k.k.
€ 4.367/m²
3474HR Zegveld
€ 439.000 k.k.
€ 4.262/m²
3474GB Zegveld
€ 375.000 k.k.
€ 5.357/m²
3474JN Zegveld
€ 475.000 k.k.
€ 3.925/m²
3474NA Zegveld
€ 475.000 k.k.
€ 4.130/m²
3474JR Zegveld
€ 400.000 k.k.
€ 3.508/m²
3474JP Zegveld
€ 450.000 k.k.
€ 4.591/m²
3474JR Zegveld
€ 350.000 k.k.
€ 4.069/m²
3474JJ Zegveld
€ 395.000 k.k.
€ 3.726/m²
Get free quotes from real estate agents with local market knowledge. Compare more than 38 real estate agents in Zegveld.
Selling a home in Zegveld? Compare all real estate agents in Zegveld or view the top 10 real estate agents in Zegveld for extra context for your choice.
Real estate agents make sharper offers when they know you're comparing — ask for quotes for sale or purchase.
Practical answers about housing supply, sales and comparing real estate agents in Zegveld.
The costs of a real estate agent in Zegveld depend on commission, setup costs, property presentation and the chosen service. Compare the 38 real estate agents in Zegveld via the real estate agent page and request multiple quotes to compare rates and approach well.
Within our selection, we are currently showing 20 houses in Zegveld. View also the sold houses in Zegveld to compare the current offering with recent transactions.
Take into account not only price and living area but also maintenance, energy label, location, outdoor space and sales status. This way you compare houses in Zegveld on more than just the asking price.
A local real estate agent knows the neighborhoods, recent transactions and demand in Zegveld. By comparing 38 real estate agents in the region you get a better insight into prices, sales strategy and expected yield; the top 10 in Zegveld provides a useful starting point.
Yes, when making a sales plan, a valuation in Zegveld is wise. You gain insight into a realistic asking price and can then compare offers from real estate agents specifically.
View current location data on residents, WOZ development, housing stock, energy consumption, business activity and safety in Zegveld. In 2025 were there 2.445 residents. The average WOZ value in 2025 is EUR 450.000.
These figures help to better assess and compare the housing stock in Zegveld with recent sold homes. Orient yourself then on suitable top real estate agents in Zegveld for sales advice in this region.
Residents
2.445
Last year: 2025
Average WOZ
EUR 450.000
Last year: 2025
Average income per person.
EUR 32.700
Source: AllNumbers
Crimes (current year)
34
Total registered
| Year | Residents |
|---|---|
| 2021 | 2.300 |
| 2022 | 2.320 |
| 2023 | 2.405 |
| 2024 | 2.430 |
| 2025 | 2.445 |
| Year | Average WOZ |
|---|---|
| 2021 | EUR 354.000 |
| 2022 | EUR 374.000 |
| 2023 | EUR 422.000 |
| 2024 | EUR 427.000 |
| 2025 | EUR 450.000 |
Hoger
480
Praktisch
430
Middelbaar
900
Europa
135
Nederland
2.155
Buiten Europa
150
Label C
276
Label B
190
Label A
177
Label D
108
Label G
101
Label F
49
Label E
29
Label A+++
28
Label A+
18
Label A++
11
Label A++++
9
Label A+++++
1
| Year | Gas (m3) | Electricity (kWh) |
|---|---|---|
| 2020 | 1.420 | 3.270 |
| 2021 | 1.600 | 3.310 |
| 2022 | 1.170 | 3.100 |
| 2023 | 960 | 2.940 |
| 2024 | 920 | 2.980 |
Hoekwoning
Gas: 920 • Electricity: 2.720
Huurwoning
Gas: 890 • Electricity: 2.400
Koopwoning
Gas: 980 • Electricity: 3.100
Appartement
Gas: 570 • Electricity: 2.030
Tussenwoning
Gas: 790 • Electricity: 2.500
Vrijstaande woning
Gas: 1.380 • Electricity: 3.870
Twee-onder-één-kap woning
Gas: 900 • Electricity: 3.430
Total number of company establishments: 370
| Period | Crimes |
|---|---|
| jan 2025 | 2 |
| jan 2026 | 1 |
| jul 2025 | 4 |
| jun 2025 | 3 |
| mei 2025 | 1 |
| mrt 2025 | 3 |
| nov 2024 | 2 |
| nov 2025 | 3 |
| okt 2024 | 7 |
| okt 2025 | 0 |
| sep 2024 | 4 |
| sep 2025 | 2 |
These figures give an indicative picture of safety trends in the living environment of Zegveld.
Short answers based on current local statistics, handy for a quick comparison of the living environment.
Zegveld telt in 2025 ongeveer 2.445 inwoners.
De gemiddelde WOZ-waarde in Zegveld is in 2025 circa € 450.000.
Het gemiddelde inkomen per inwoner in Zegveld ligt rond € 32.700 per jaar.
Voor het huidige jaar gaat het om ongeveer 34 geregistreerde misdrijven. Gebruik deze cijfers als indicatie en vergelijk trends per periode.
In Zegveld komt vooral "Tussenwoningen" veel voor, met ongeveer 348 woningen.