In Leeuwarden staat Elfsteden Makelaars en Taxateurs B.V. voor betrouwbare, transparante en persoonlijke dienstverlening in de vastgoedwereld. Met een sterke focus op klantgerichtheid en kwaliteit, helpen we zowel kopers als verkopers om hun doelen te bereiken. Onze expertise ligt in het vertrouwen opbouwen en het geven van duidelijke, eerlijke adviezen. Wij bieden een breed aanbod aan diensten zoals verkoop, aankoop, taxaties en verhuu...
Current housing stock
-

- Available
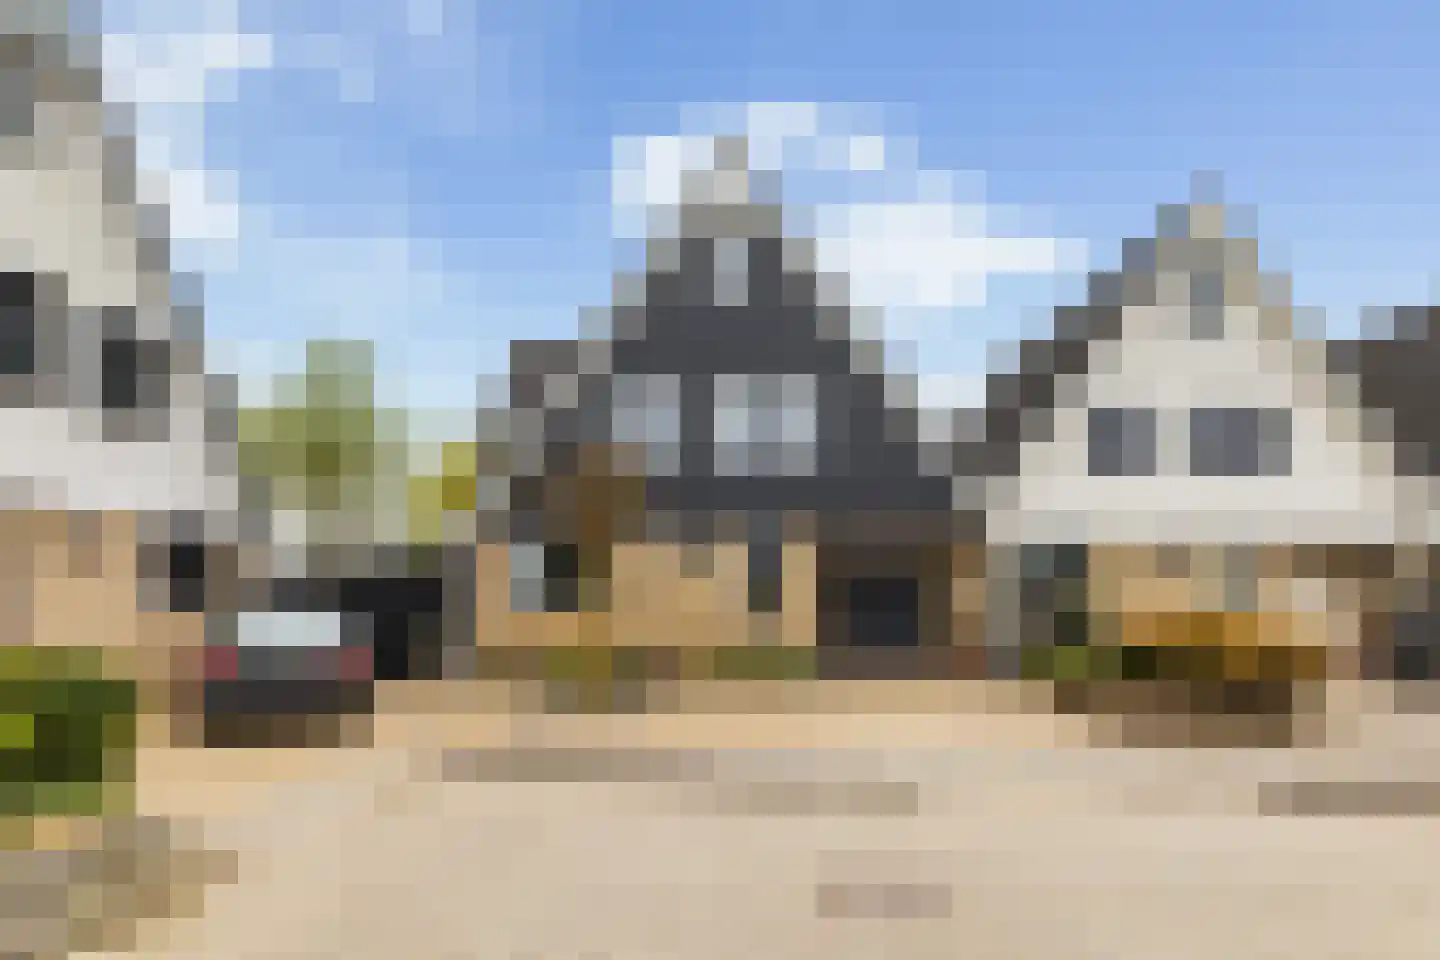
Het Zool 9
8939BL Leeuwarden
€ 489.000 k.k.
€ 4.041/m²
BSave as favorite- Living area
- 121 m²
- Land area
- 335 m²
- Bedrooms
- 4
-

- Available
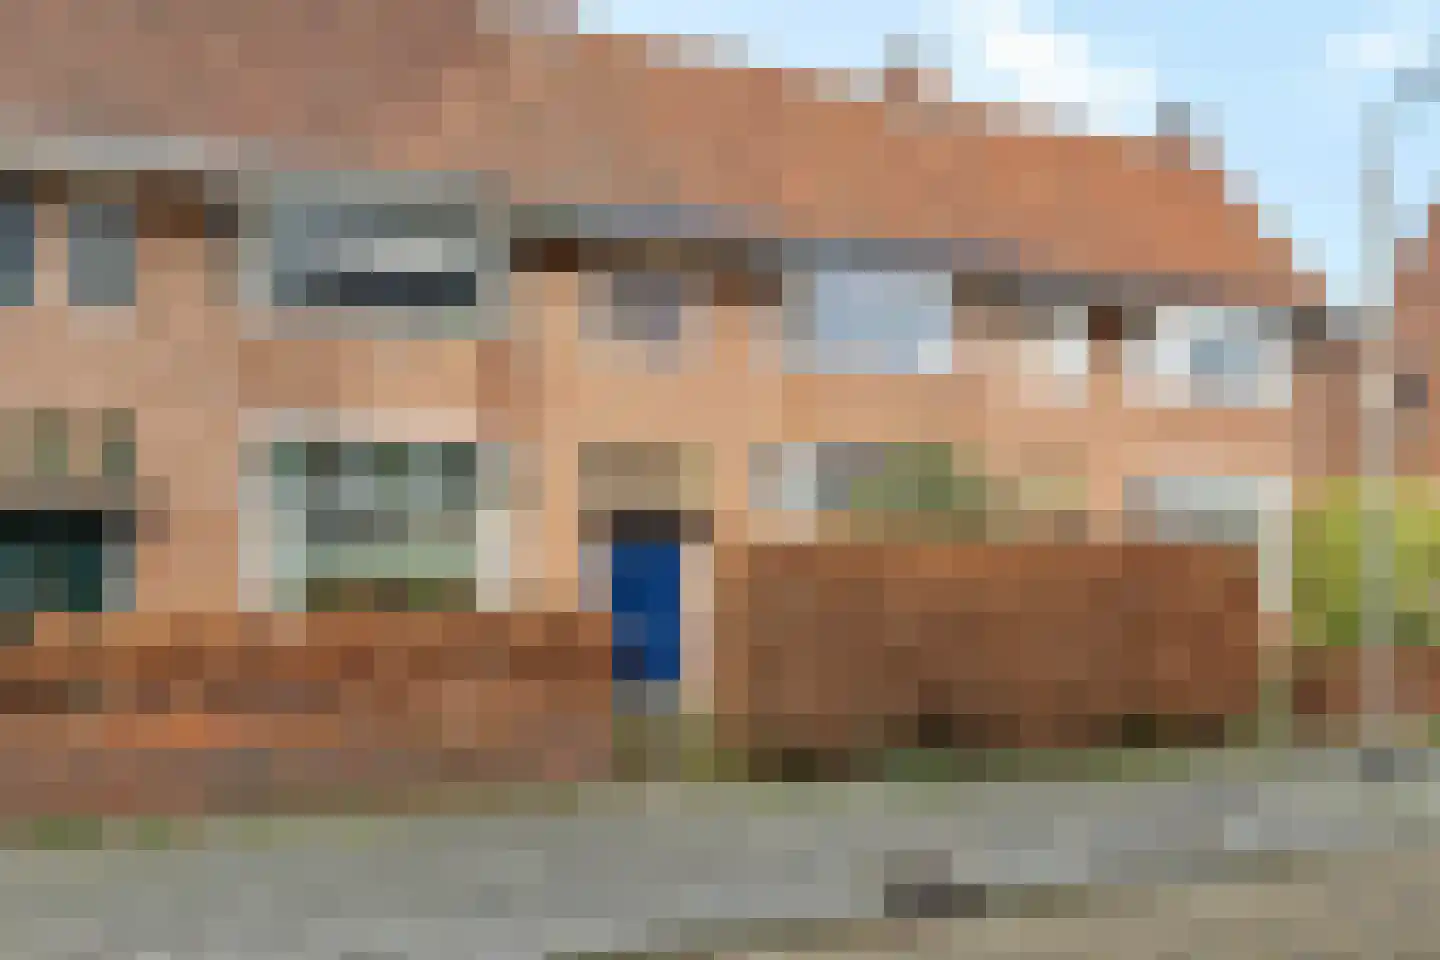
Bierumerterp 12
9101SB Dokkum
€ 730.000 k.k.
€ 4.591/m²
BSave as favorite- Living area
- 159 m²
- Land area
- 633 m²
- Bedrooms
- 4
-
- Available
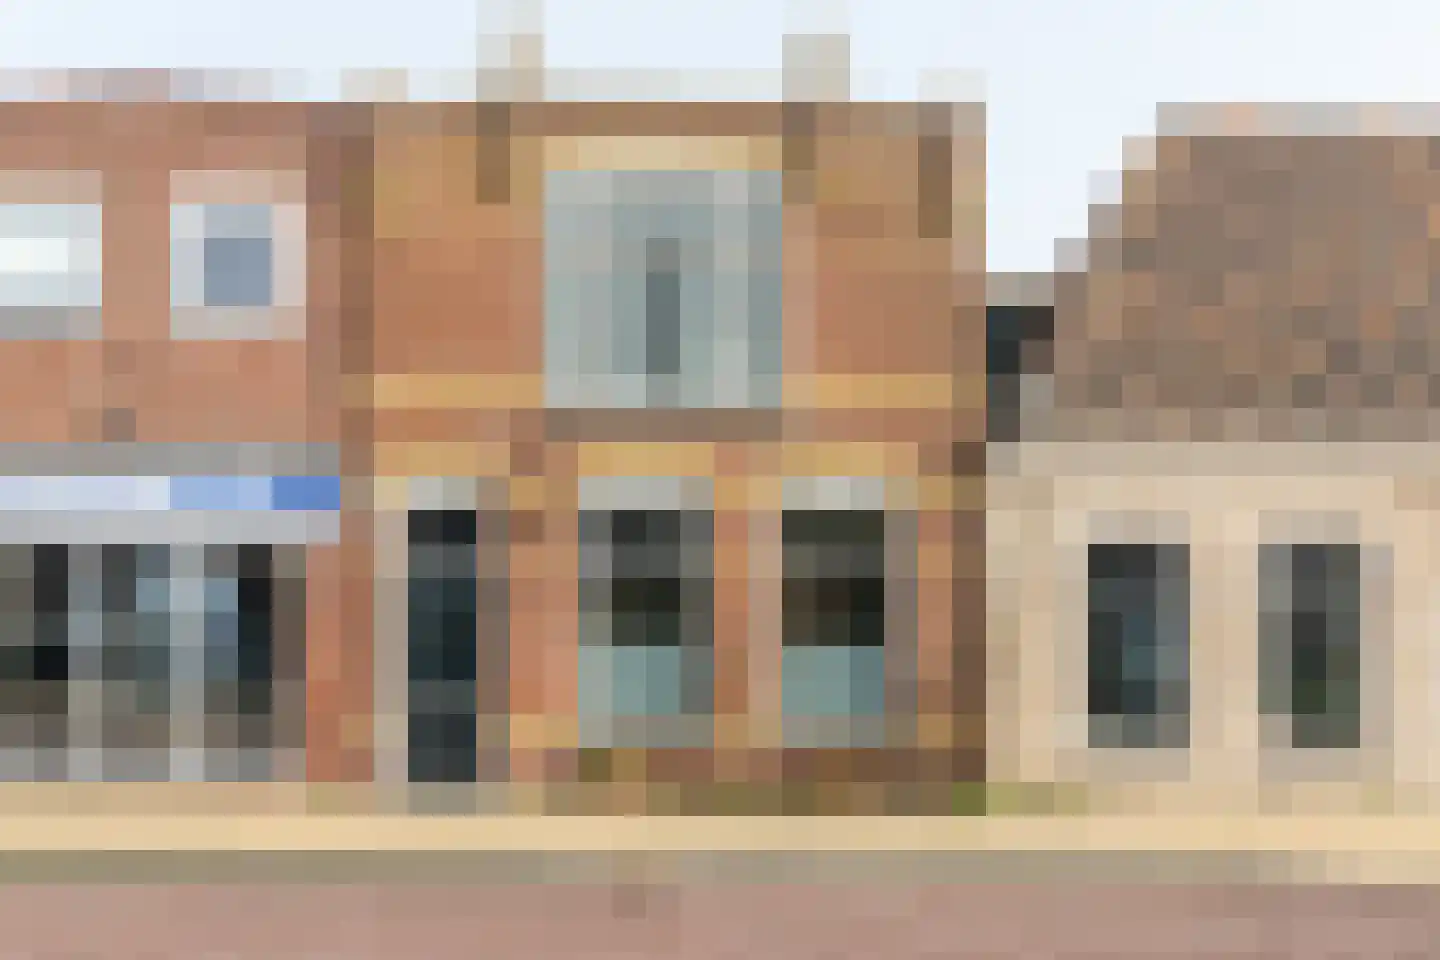
Gysbert Japicxstrjitte 14
9291GL Kollum
€ 269.500 k.k.
BSave as favorite- Living area
- 119 m²
- Land area
- 151 m²
- Bedrooms
- 4
-
- Available
It Diel 5
9062HS Oentsjerk
€ 420.000 k.k.
A++Save as favorite- Living area
- 129 m²
- Land area
- 290 m²
- Bedrooms
- 4
-

- Available
Casimirstrjitte 5
9288BN Kootstertille
€ 285.000 k.k.
€ 2.192/m²
BSave as favorite- Living area
- 130 m²
- Land area
- 219 m²
- Bedrooms
- 4
-

- Available
Aak 8
9141VJ Wierum
€ 200.000 k.k.
€ 2.222/m²
CSave as favorite- Living area
- 90 m²
- Land area
- 257 m²
- Bedrooms
- 3
Reviews (90)
Review platforms
BronscoresTotal score
90 total reviews

Funda
75 reviews on Funda

15 reviews on Google
-
van Scheltingalaan 23
10Bart de Boer is rustig en duidelijk, houdt tijdens het proces steeds de vinger aan de pols en heeft ons steeds goed op de hoogte gehouden. Ook de contacten met de medewerkers op het kantoor verliepen steeds zeer soepel, op vragen werd snel gereageerd. We kunnen deze makelaar zeker aanbevelen.
-
De Zwaan 34
10Het is altijd een prettige samenwerking met deze makelaar. Ze zijn snel en duidelijk en kennen de markt.
-
Grimbeert 8
9Het contact verliep goed en was persoonlijk en heel fijn. De makelaar was betrokken, enthousiast en goed bereikbaar.
-
Op de Keppels 20
10Het contact verliep uiterst plezierig Op verschillende manieren heel goed bereikbaar en zeer behulpzaam
-
De Skeakels 3
10Goed advies, geweldige begeleiding, uitermate professioneel en vriendelijk. Ik zou hem zeker aanraden.
-
Humaldawei 47
9We hebben prettig contact gehad met de makelaar. Bij een eerdere bezichtiging voor een mogelijke aankoop hadden we al een zeer positieve indruk gekregen. Daarom kozen we nu, bij de verkoop van onze woning, opnieuw voor dezelfde makelaar. Ook dit keer verliep het contact weer bijzonder prettig.
-
de Hammeren 27
9Snelle verkoop, en aankoop Antwoord altijd op vragen Gewoon goed Accuraat En begripvol en deskundig
-
Fransisca B.
10Ontzettend fijn contact gehad met voornamelijk Bert en Tessa tijdens onze zoektocht naar een woning. Vriendelijke en menselijke makelaardij, zeer prettig in contact. In het begin een kleine miscommunicatie maar daarna steeds snel & goed geholpen! Na één bod was het al raak, dat was niet gelukt zonder jullie! Nogmaals dank ook Bert voor alle hulp tijdens het gehele proces :)
-
Haadwei 2
10Zeer proactief en professioneel, daarnaast was de comminicatie erg prettig. De door de makelaar uitgesproken verwachtingen tav het verkoopproces zijn helemaal waargemaakt.
-
Frisiusstrjitte 3
10Vlot contact met de makelaar en het kantoor en goed geadviseerd. Ze zijn betrokken en bereiken daarmee het gewenste resultaat.
-
Alde Syl 8
9Goede communicatie, prijs bewust. Goede ondersteuning, een plezierig mens in de omgang. Punctueel. Een echte aanrader. Discreet
-
Trynwâldsterdyk 11
10Goed advies gehad, fijn dat de bemiddeling door Elfsteden werd gedaan. Communicatie was vlot. We zijn erg blij met de hulp van Elfsteden Makelaars.
-
De Twee Gebroeders 321
9Translated by AIThe sale and information process went smoothly. The real estate agent explained everything clearly, and for any questions you had, you received a quick and clear answer.
-
de Hammeren 17
9Translated by AIVery good, good business knowledge. Good information during the sale and after that time. Good contact.
-
Groningerstraatweg 25
9Translated by AIVery pleasant to deal with and very quick in responding on the group app. Very reachable, maybe even a bit too good because he also reacted immediately on the app during the weekend :). Also the ladies at the office were quick and efficient. If something was not clear, it was immediately explained or chosen for us. Since it was our first time selling a house, everything was new, but Rinze-Yme thought well with us. Very satisfied!
-
Papaverstraat 38
10Translated by AIContact with Super. After each viewing day, a short contact with Super handled. All further appointments also gone well. In short, very good feeling.
-
Allemawei 6
10Translated by AIWe have experienced the contact and communication with this real estate agent as very pleasant. He was, so to speak, available day and night. Reacted very quickly to questions and kept us well informed of the developments.
-
Ytsjesân 56
9Translated by AIExcellent contact with real estate agent Bert, straight forward and sober in dealings! Both for purchase and sale a familiar person/agent who does not go around the bush and communicates well
-
Bernhardus Bumastraat 43
10Translated by AII am very satisfied with the sale of our home and the help that Elfsteden Makelaars has provided.
-
Sytjemastate 11
10Translated by AIDo what they say and say what they do. Very fine and pleasant in contact, expert, good at thinking along in a situation that is tough for us and in time. We recommend Rinze Yme 100%.