Boekweit | Olie Makelaars/taxateurs

Wheat | Oil stands for a solid and personal approach in the sale of your home. We are active in the Hoorn region and have a strong presence with lots of customer contact, leading to high returns. Our large agenda capacity and professional approach ensure that your house quickly comes into good hands. Our team is always available, even during holidays or illness. We work with a strong organization, so there are no missed opportunities. P...
Current housing stock
-

- Available
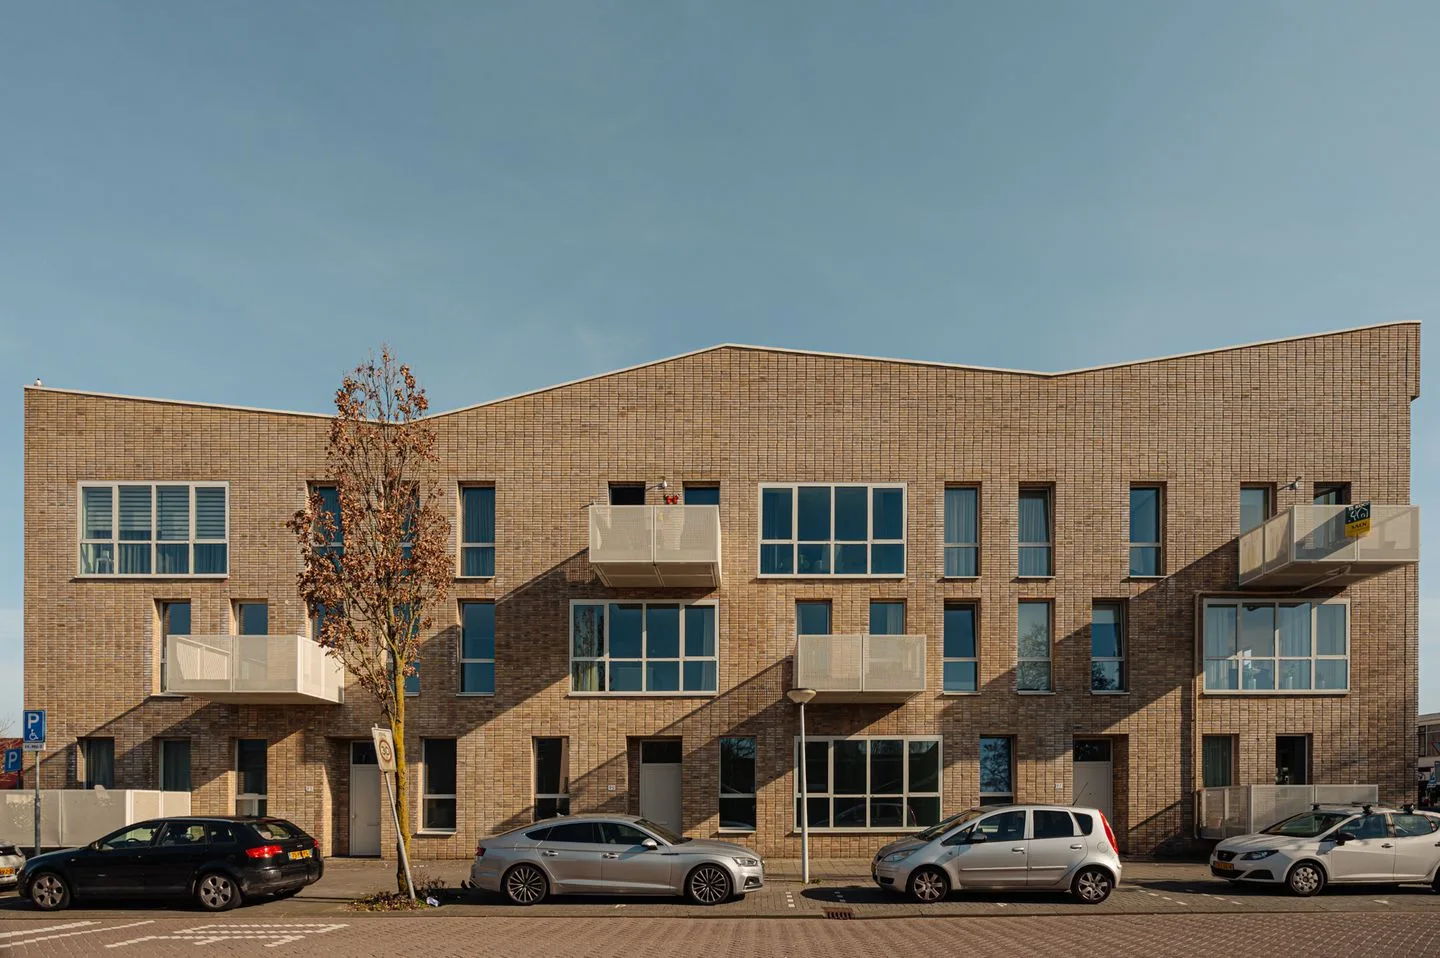
Diamantplein 22
1625RS Hoorn
€ 600.000 k.k.
€ 3.797/m²
ASave as favorite- Living area
- 158 m²
- Land area
- 225 m²
- Bedrooms
- 4
-

- Available
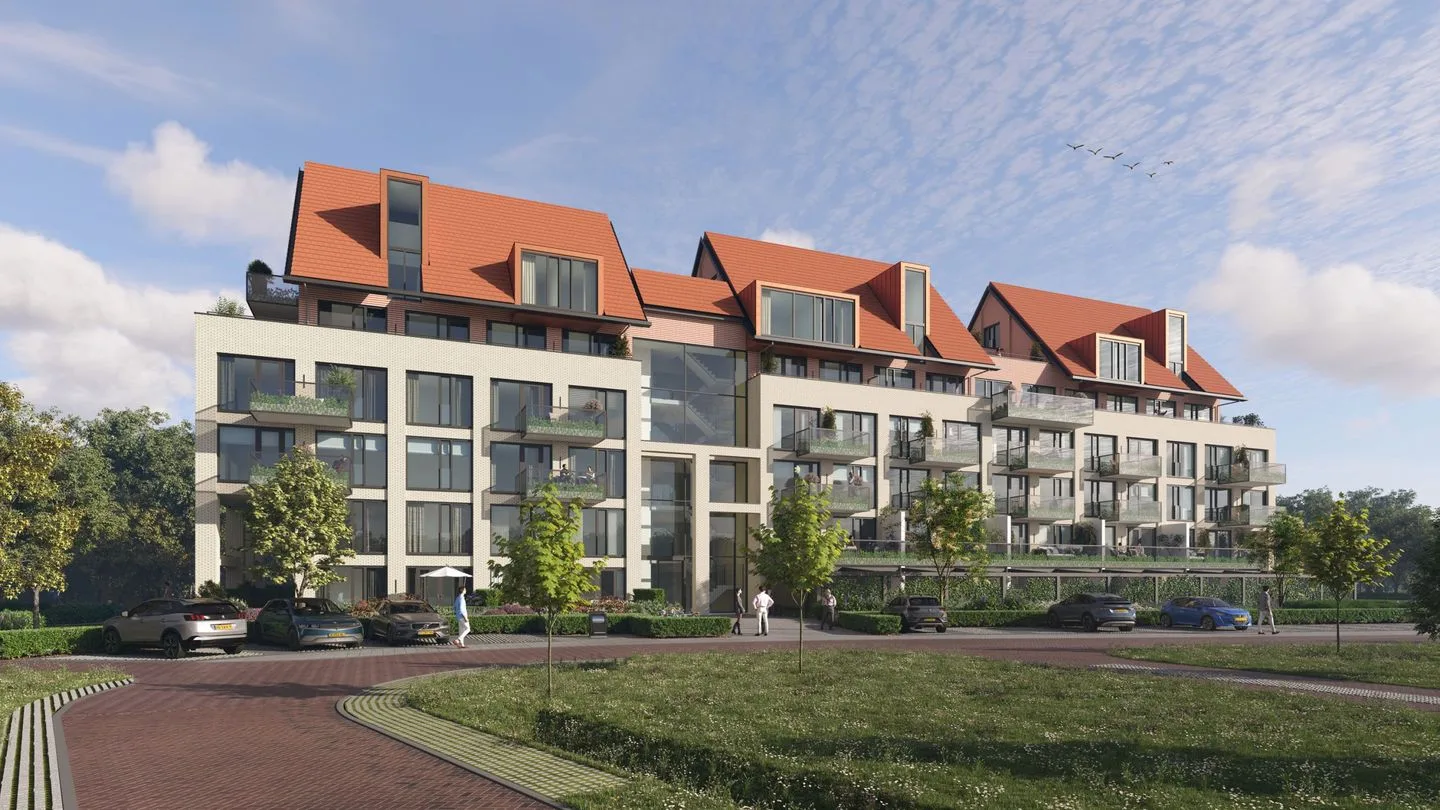
Stolphoeve 27
1689DG Zwaag
€ 525.000 k.k.
€ 3.750/m²
ASave as favorite- Living area
- 140 m²
- Land area
- 261 m²
- Bedrooms
- 4
-

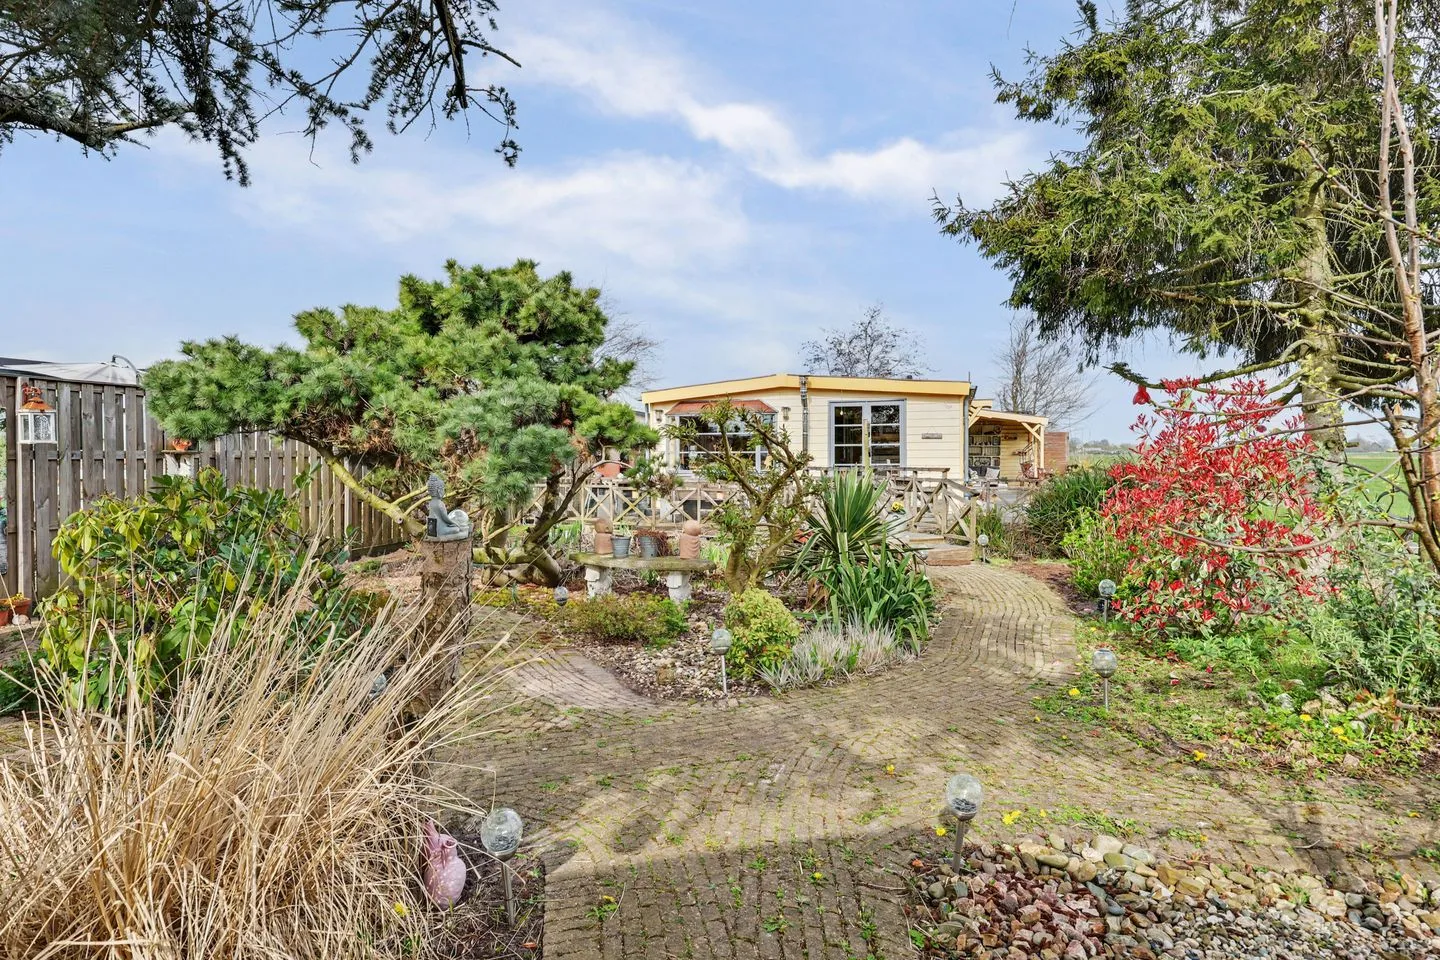
- Available
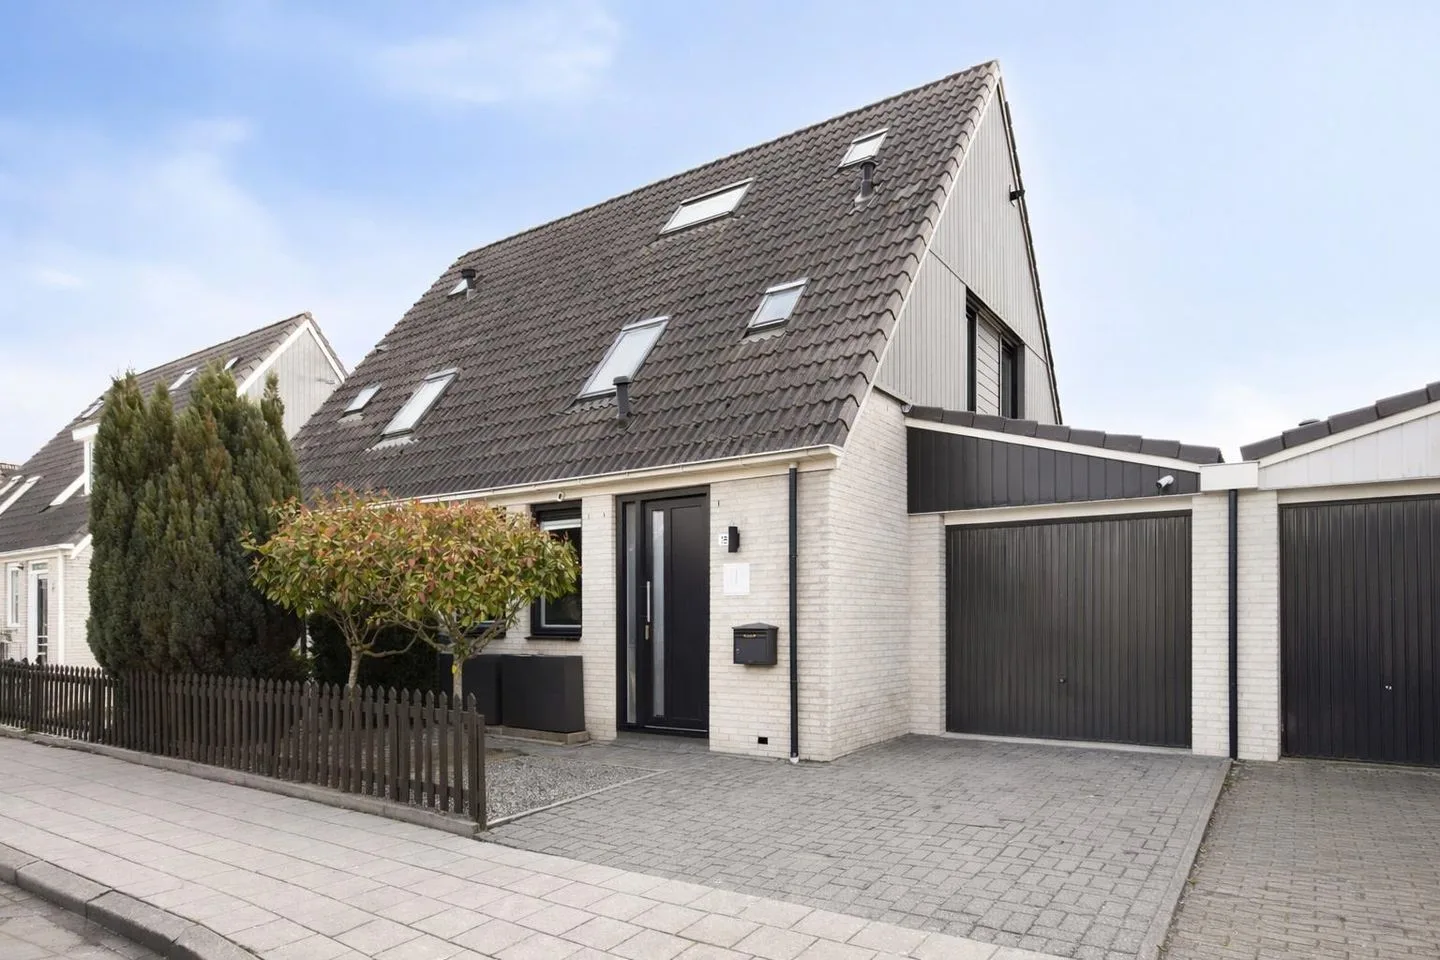
Lijsbeth Tijsweg 7 46
1647LE Berkhout
€ 285.000 k.k.
BSave as favorite- Living area
- 95 m²
- Land area
- 480 m²
- Bedrooms
- 3
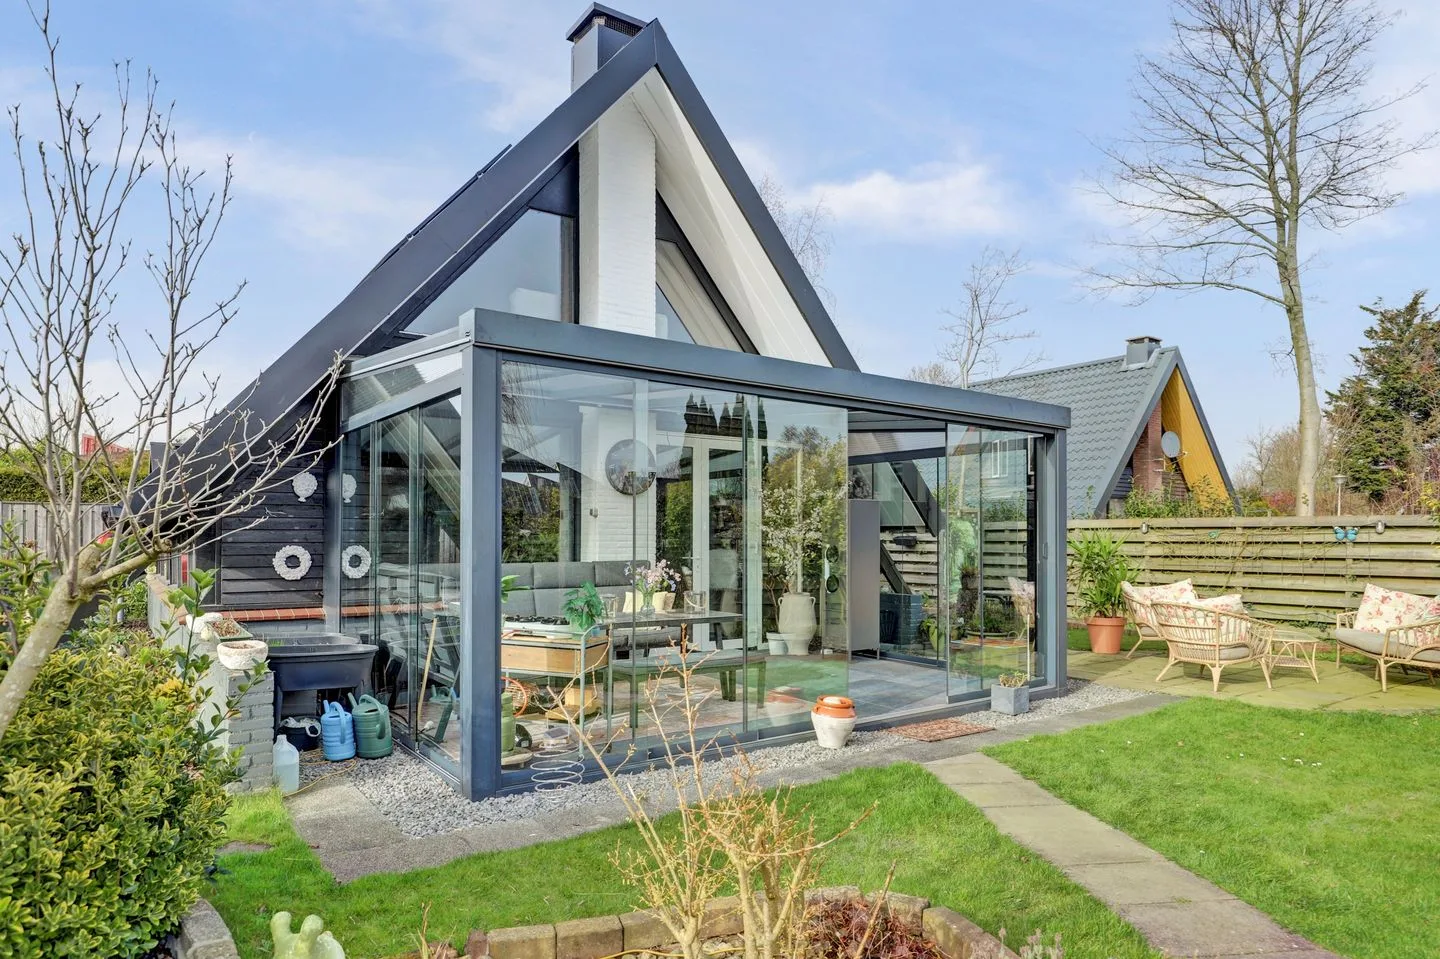
-

- Available
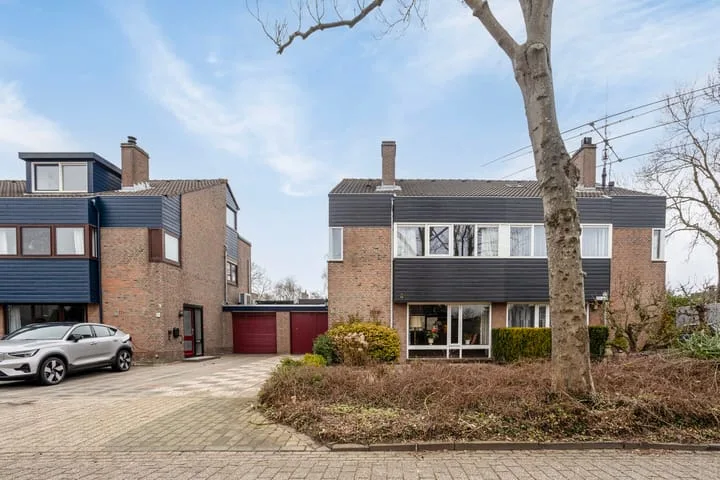
Zon 1
1621CA Hoorn
€ 595.000 k.k.
CSave as favorite- Living area
- 160 m²
- Land area
- 45 m²
- Bedrooms
- 4
-

- Available
Pelmolenpad 21 A
1622NL Hoorn
€ 250.000 k.k.
GSave as favorite- Living area
- 77 m²
- Land area
- 94 m²
- Bedrooms
- 2
-

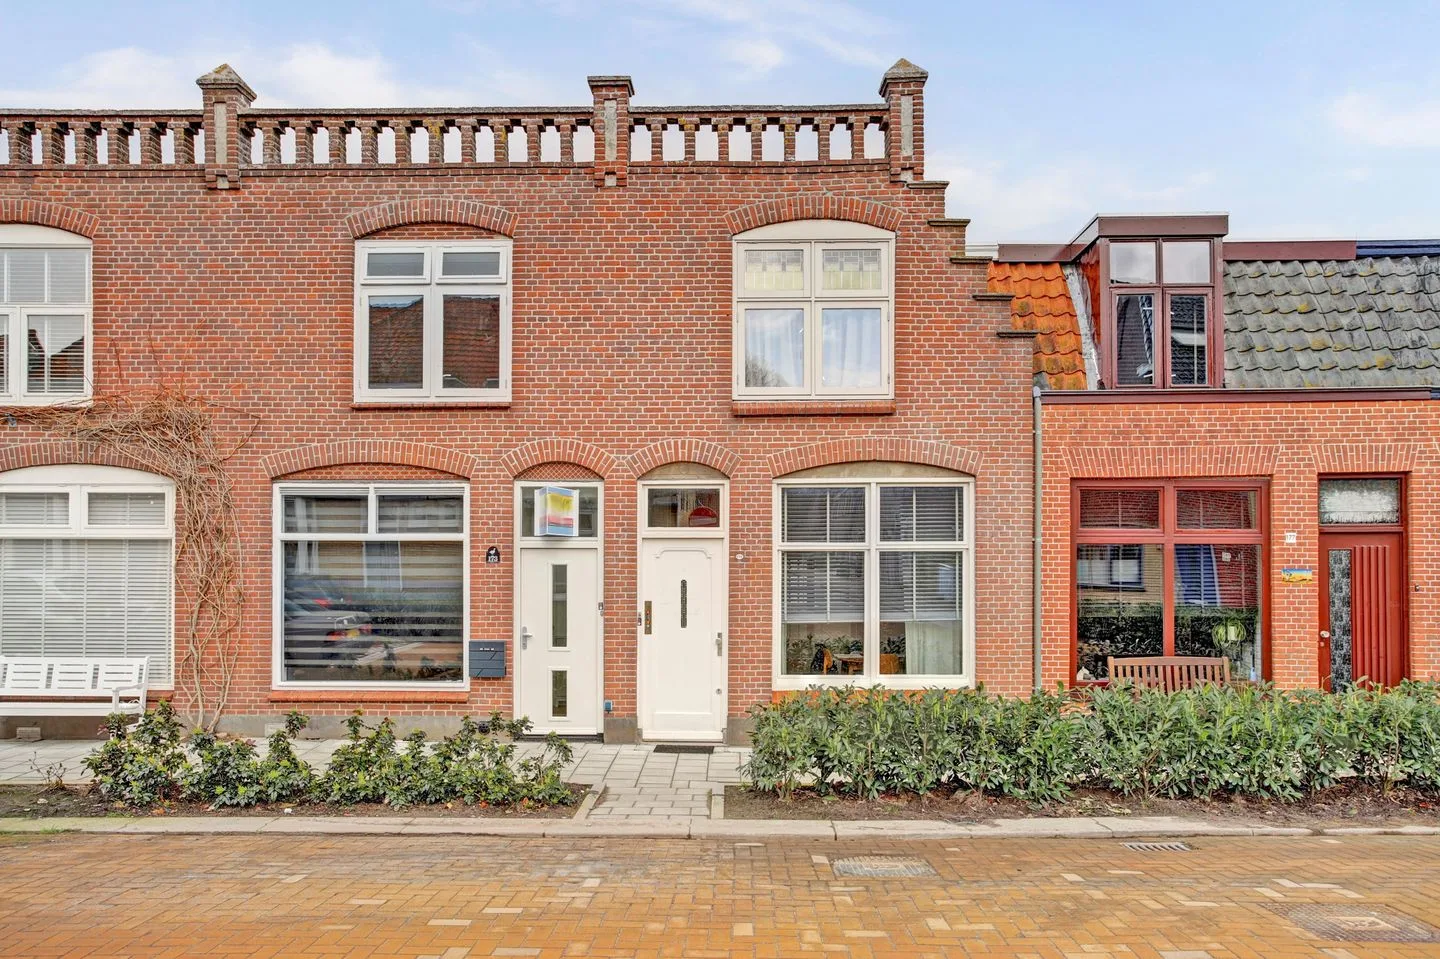
- Available
J.P. Coenstraat 17
1623LD Hoorn
€ 875.000 k.k.
€ 5.303/m²
CSave as favorite- Living area
- 165 m²
- Land area
- 200 m²
- Bedrooms
- 3
Reviews (223)
Review platforms
BronscoresTotal score
223 total reviews

Funda
109 reviews on Funda

114 reviews on Google
-
Poolster 221
10Edwin heeft ons volledig ontzorgd en de woning snel en voor de afgesproken prijs verkocht. Alle zaken werden ons uit handen genomen (bezichtigingen, energielabel, meterstanden opnemen, woning verkoopklaar maken, etc.) terwijl we wel steeds op de hoogte waren van de voortgang van de verkoop. De communicatie vanuit het kantoor was uitstekend: we wisten steeds én op tijd wat er gebeurde, zonder dat we overladen werden met teveel of te uitgebreide communicatie. Fijn om mee te werken…
-
Koperslager 25
10Zeer deskundig, denkt goed mee en is goed bereikbaar bij extra vragen. Ook afstemming voor de bezichtigingen verliep heel soepel.
-
Denny Kwakman
10Translated by AISubject matter experts and pleasant communication
-
Manon Versteeg
10Translated by AIMy great appreciation! From the first contact, the communication was clear, fast and very professional. At the same time, the approach was personal and involved. I can wholeheartedly recommend this real estate agent. Once again, thank you very much!
-
Sjoerd Blomme
10Translated by AIHello,\/nIn the meantime, our property has been sold. We are very pleased with the guidance and support of Boekweit Olie Makelaars. In particular, we have experienced the contact with Edwin Sinnige and Karin Gebhardt as pleasant. With kind regards, Jacky and Sjoerd Blomme
-
Benonilaan 2
10Translated by AIProfessional, fine communication and personal contact. For all my questions I could go to the right person. Good guidance from start to finish. Very nice to be able to take this exciting and big step together with the staff of Boekweit|Olie.
-
Nieuwsteeg 31
10Translated by AIVery smooth and fast arranged. Excellent guidance throughout the entire sales process. And sold quickly!
-
Paaldijk 122
8Translated by AIGreat contact. Appointments were well followed up. Expertise is great. Businesslike and professional! Satisfied!
-
patrick nelemans
10Translated by AIOur real estate agent guided us step by step through the process, communicated clearly and transparently, and gave us the confidence that everything was being handled carefully. Thanks to the professional approach and the human touch, we look back on this nevertheless exciting period with a good feeling. We are extremely grateful and can wholeheartedly recommend this real estate agent.
-
Bridget Abelskamp
2Translated by AIVery disappointed in this company! I bought a house and this was the seller's real estate agent. The lock of the back door doesn't work. This wasn't reported during viewings or at handover. They knew because I have seen 2 real estate agents with the key in the lock but no one started talking about it. Self-checking was also not an option because we only received the keys from the notary. And the selling real estate agent also doesn't want to ask the seller if we can still find a solution for this. Very rude and hypocritical so 😮💨 If they really tried as the response to this review says, then they would have pointed out that the key didn't work. Thanks for sharing my address, it's very nice when the door doesn't lock properly 🤷♀️🤦♀️ So be careful because this company is not honest!! Who knows on which other areas 😏
-
A DE PRUYSSENAERE
10Translated by AIExcellent and professional guidance. Cooperation with Elke Vijn was very pleasant and quick. I can recommend this real estate agent to everyone.
-
Volder 58
8Translated by AIClear explanation about strategy and costs. Sales process has smoothly proceeded in accordance with the agreements. In short, handled quickly and professionally.
-
Visserseiland 129
10Translated by AIOur real estate agent was an enormous support during the sale of the house after my father's passing. Not only very knowledgeable about the local market, but also genuinely involved in the emotional situation we were in. He/She guided us step by step through the process, communicated clearly and transparently, and gave us the confidence that everything was being carefully handled. Thanks to the professional approach and the human touch, we look back on a period that …
-
Robert Stolzhof 83
8Translated by AINo words. Met exactly as expected after first contact. Competent, expert and reassuring. Very happy with it!
-
Veldbeemd 29
9Translated by AIFrom the intake a clear and clear strategy determined in consultation, with an eye for realistic market price. Do not make promises that cannot be fulfilled, calm around the viewings, direct clear feedback on opportunities and ultimately quickly, professionally and businesslike to the desired agreement.
-
Veranda 57
9Translated by AISuper helped by Edwin Sinnige. Honest and open communication and we are happy with how the process has gone.
-
Jan Doustraat 64
10Translated by AIA great collaboration with Boekweit Olie. The sale of the property was quickly arranged at a market-conforming price. The contacts with the office were excellent. Appointments were kept and quickly handled. Completely satisfied 👍
-
Coos Schouten
10 -
Wim Stilma
10Translated by AIWe are very satisfied with Boekweit|Olie real estate agents! A solid 9,5👍. Edwin Sinnige and the team at the office have helped us fantastically. We sincerely recommend this real estate agent, we had full confidence in Edwin and everything went smoothly. We could always call them and we were guided through the sometimes difficult 'tasks' that come with selling a house, with all patience from them. You can tell they work with pleasure and take that extra step for their customers…… All praise!
-
Kelsey
10Translated by AIVery well helped by Elke. Professional, customer-friendly and expert. I could ask everything and got a quick response! Thanks to Boekweit Olie for my first home, thank you!