EV Wonen Makelaardij BV
At EV Wonen, we ensure that buying or selling your home proceeds carefully and with confidence. Our experience as a registered real estate agent and appraiser provides a solid foundation for all steps in the process. Whether it's about market value, a mortgage or the right timing for the sale: we are ready to support you with knowledge and assistance. We understand that this step in your life is not light, so we take the time to serious...
Current housing stock
-
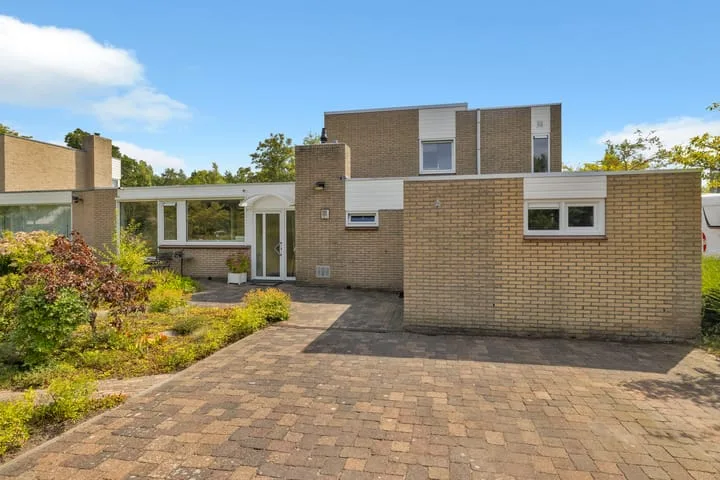
- Available
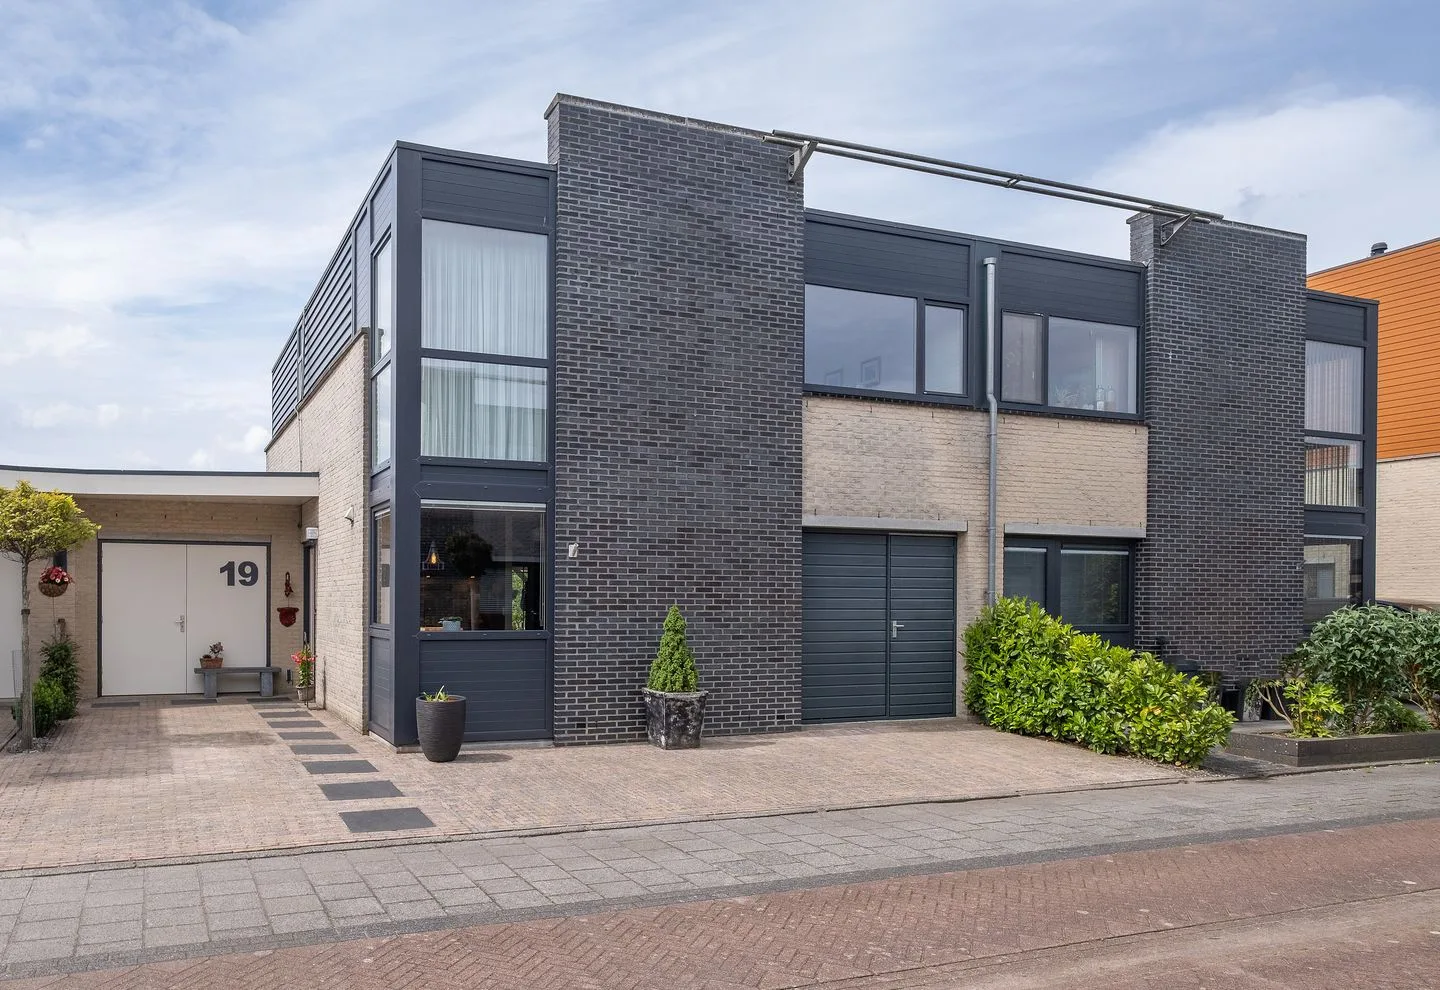
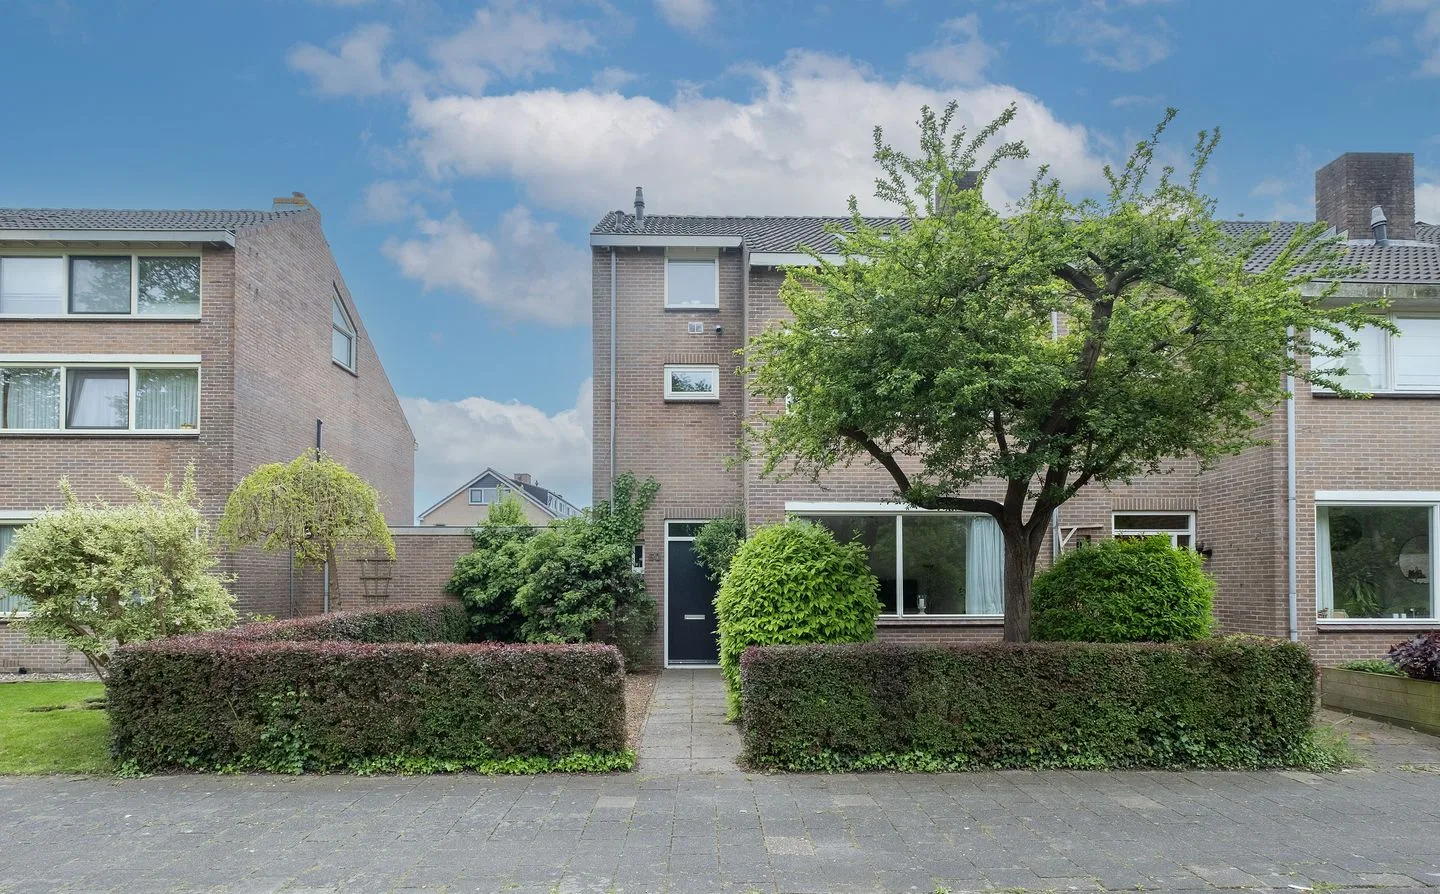
C.F. Kuijken-van der Eijndetuin 19
1705HX Heerhugowaard
€ 550.000 k.k.
€ 3.929/m²
ASave as favorite- Living area
- 140 m²
- Land area
- 235 m²
- Bedrooms
- 3
-
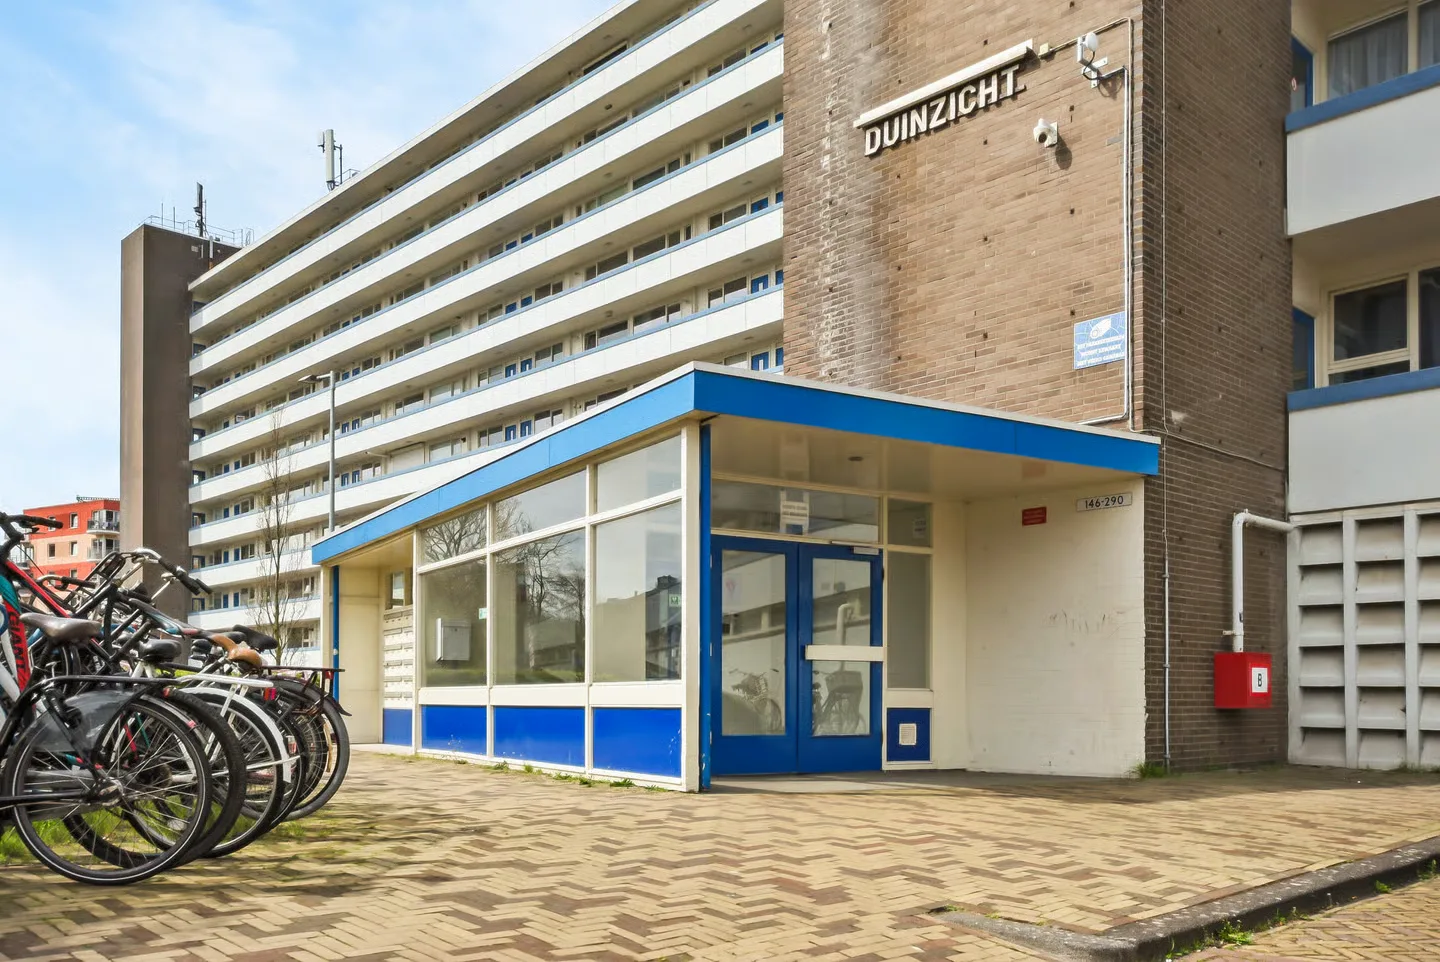
- Available
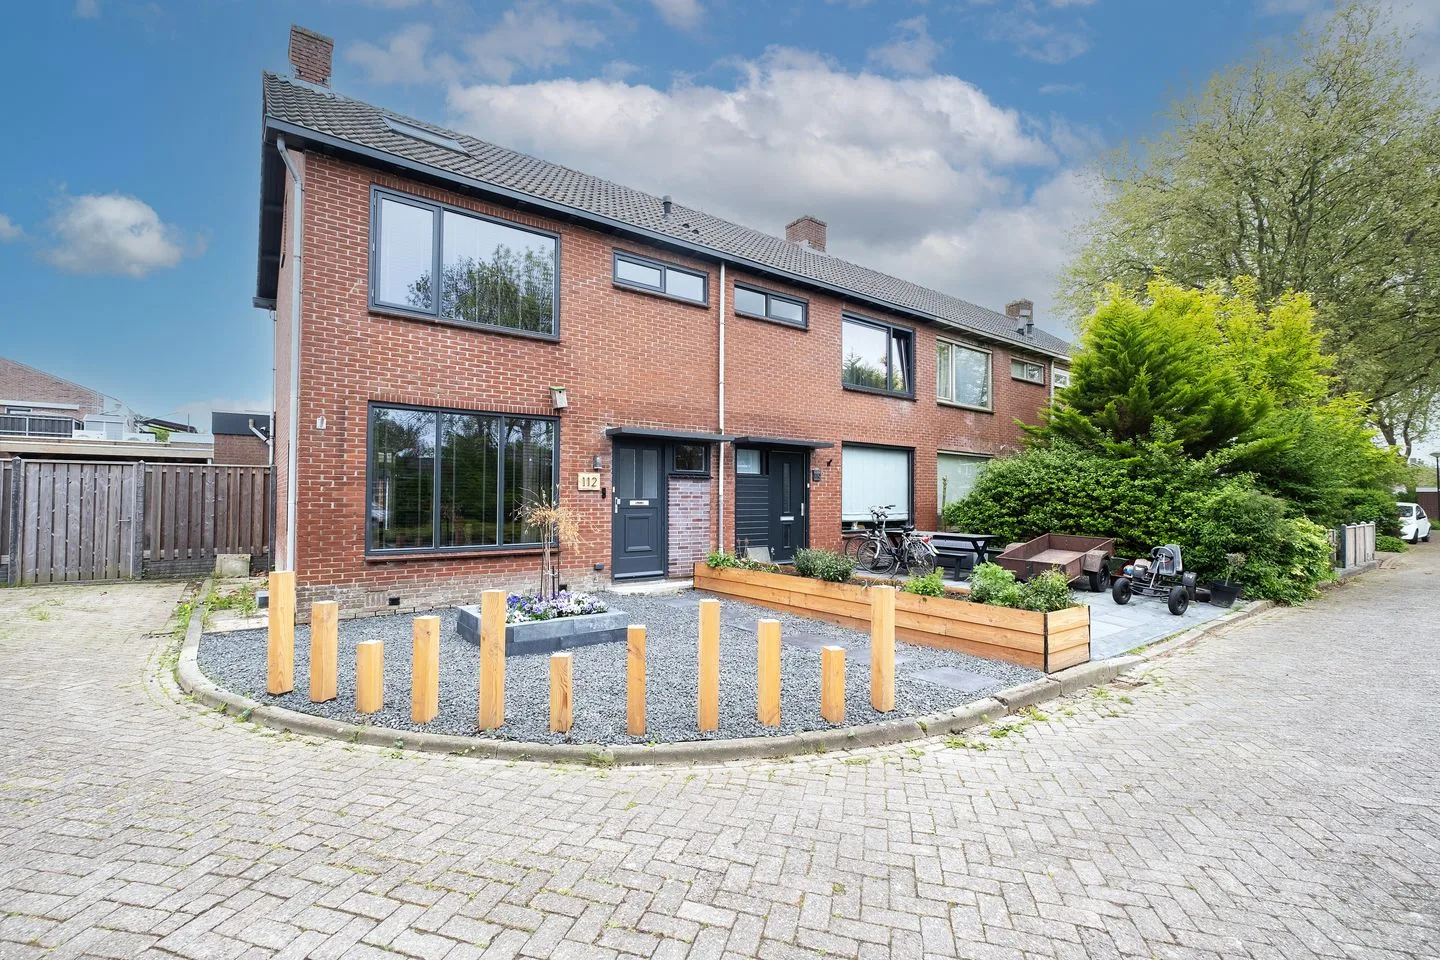
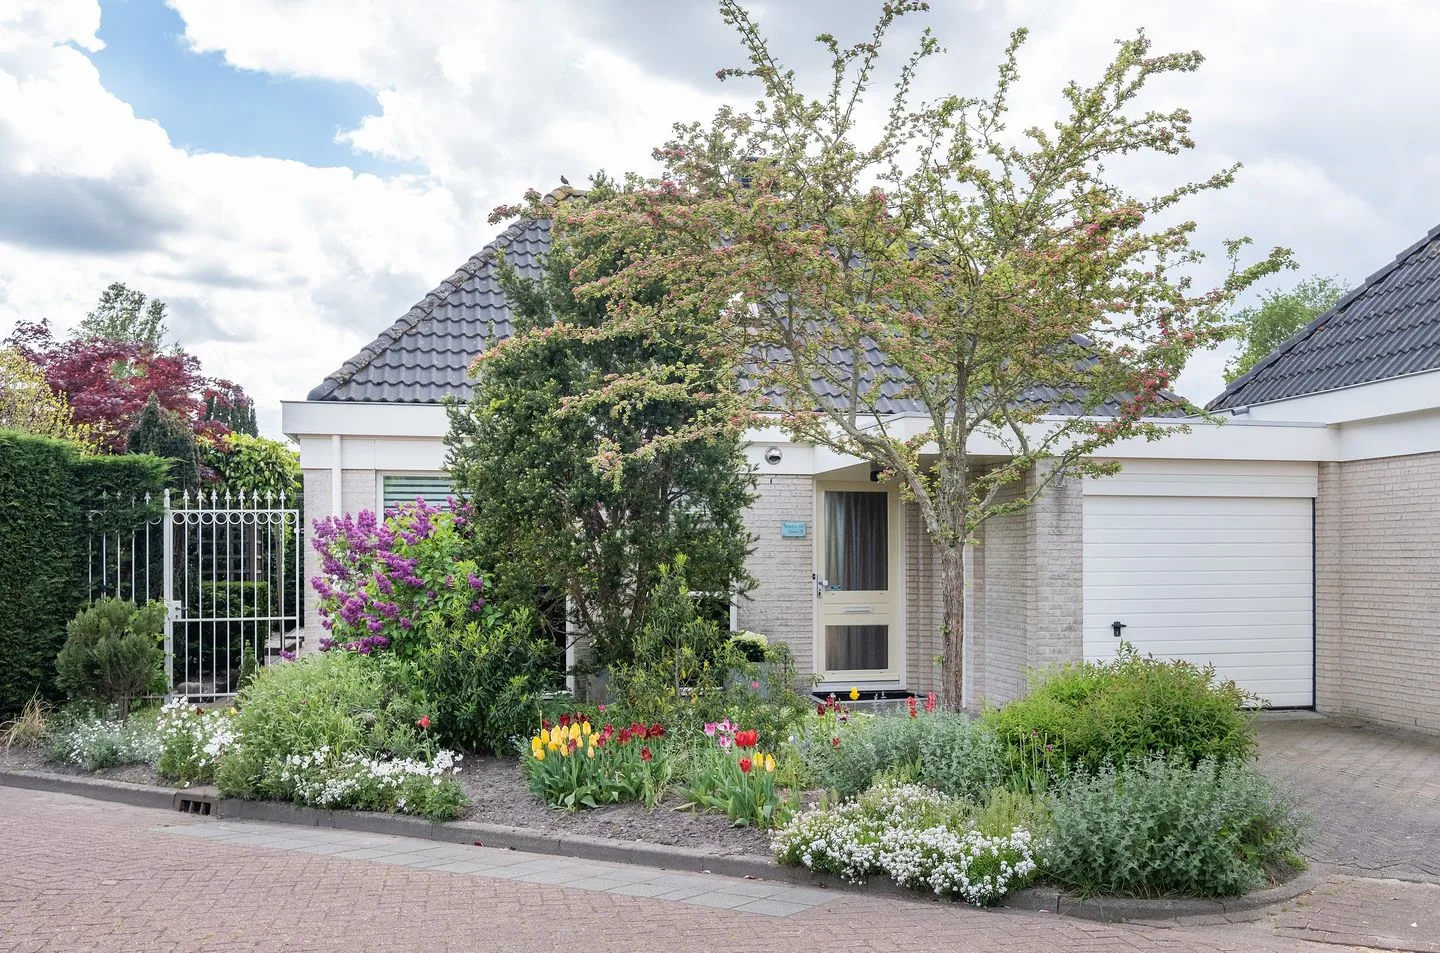
C. Huygensstraat 112
1702EZ Heerhugowaard
€ 435.000 k.k.
€ 3.508/m²
BSave as favorite- Living area
- 124 m²
- Land area
- 170 m²
- Bedrooms
- 4
-
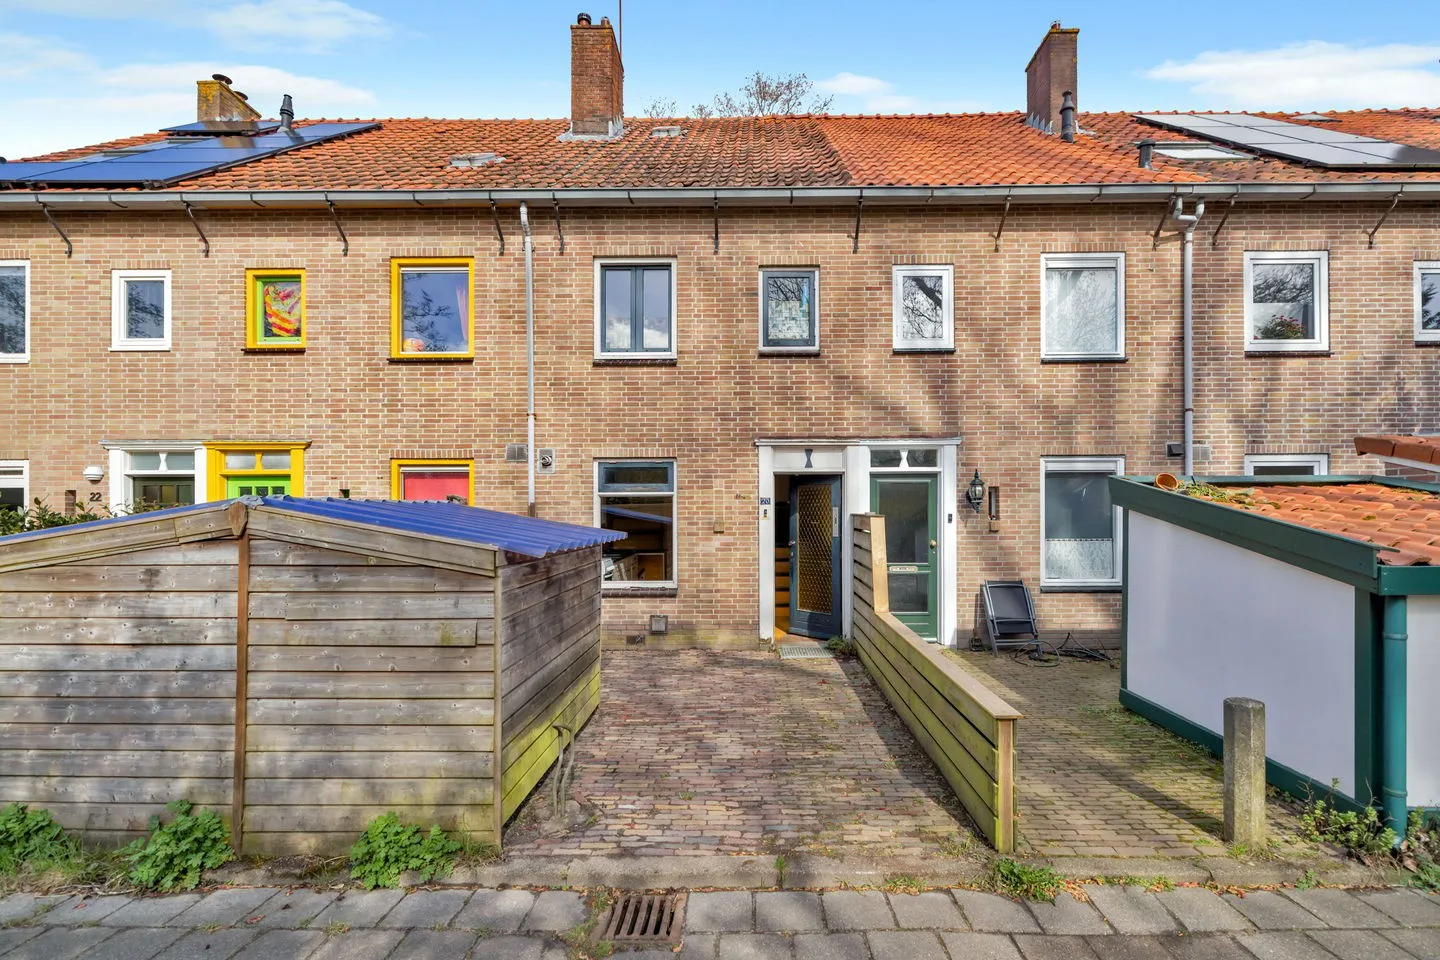
- Available
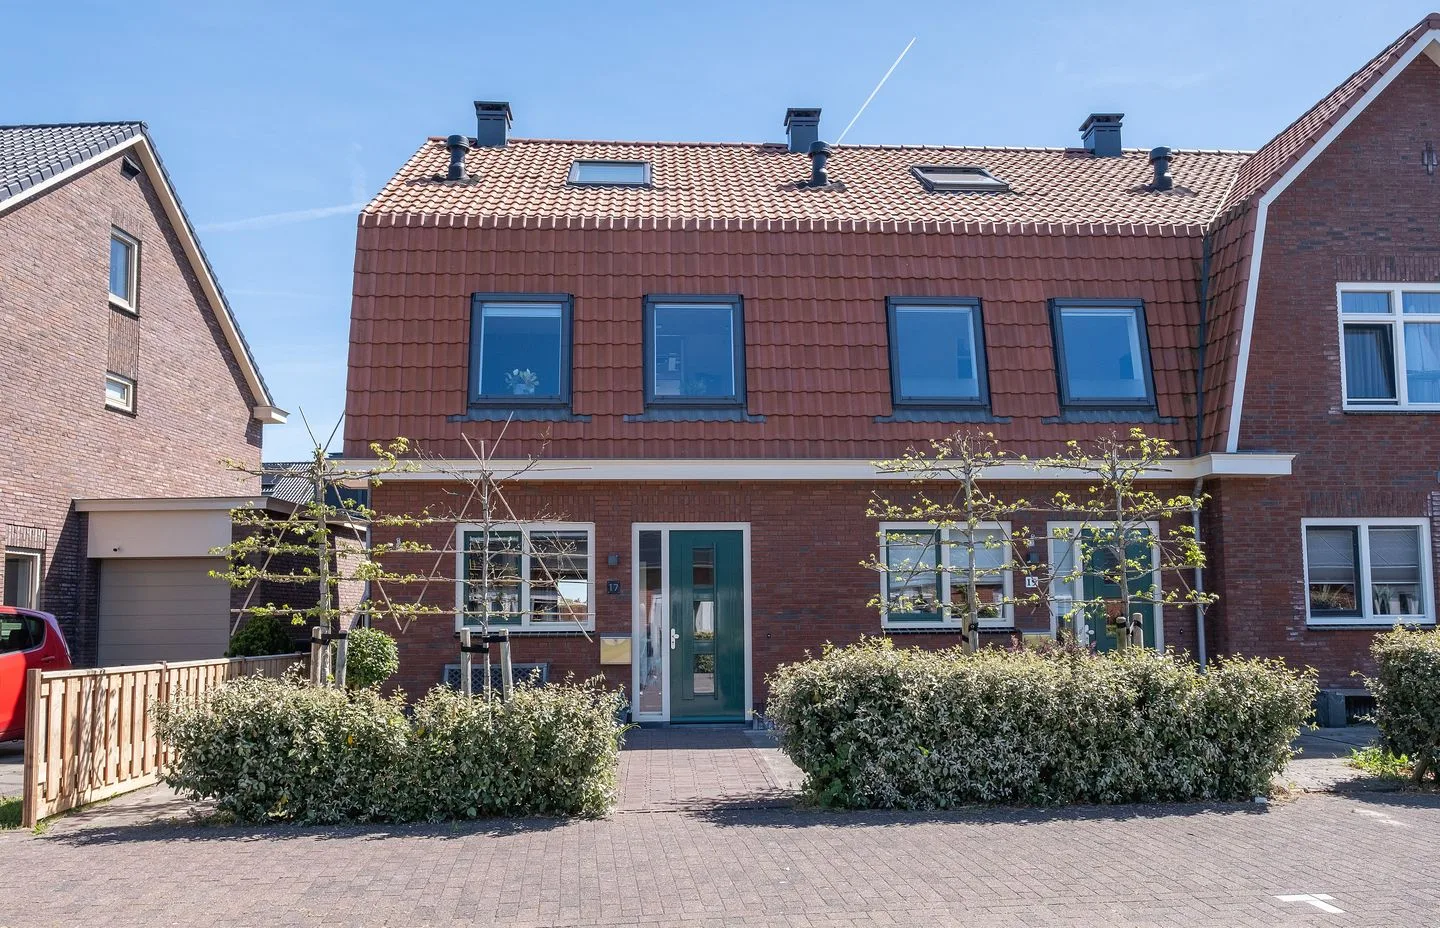
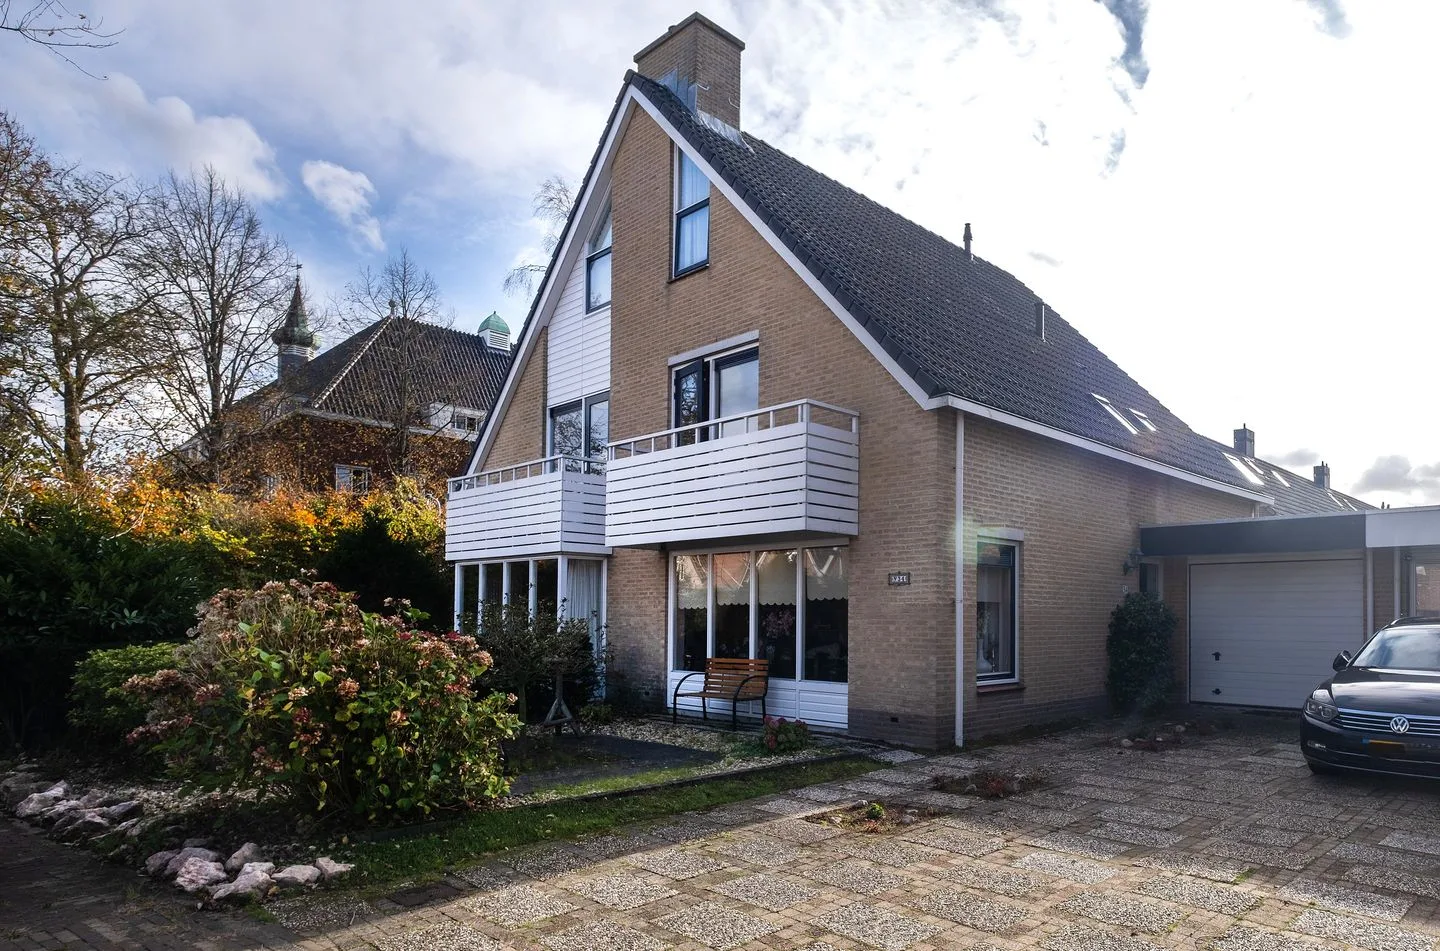
Madeliefstraat 17
1706AN Heerhugowaard
€ 450.000 k.k.
€ 4.369/m²
ASave as favorite- Living area
- 103 m²
- Land area
- 186 m²
- Bedrooms
- 4
-
- Available
Krusemanlaan 60
1701VN Heerhugowaard
€ 445.000 k.k.
€ 3.589/m²
CSave as favorite- Living area
- 124 m²
- Land area
- 241 m²
- Bedrooms
- 5
-
- Available
Dwergvinvis 28
1704VW Heerhugowaard
€ 569.000 k.k.
€ 5.578/m²
CSave as favorite- Living area
- 102 m²
- Land area
- 298 m²
- Bedrooms
- 3
-
- Available
Loudelsweg 34
1861TG Bergen (NH)
€ 715.000 k.k.
€ 5.909/m²
BSave as favorite- Living area
- 121 m²
- Land area
- 251 m²
- Bedrooms
- 3
Reviews (118)
Review platforms
BronscoresTotal score
118 total reviews

Funda
81 reviews on Funda

37 reviews on Google
-
Pabloïnca / Martijn Bannanahammock
2Vandaag zijn we wezen kijken bij een woning die door deze makelaar te koop wordt aangeboden. De ontvangst was redelijk, de verkopende partij heeft de zaken goed voorbereid en is zelfs nog in bezit van originele tekeningen en documenten. De eye catcher was de tuin, nou ja, park. Op de advertentie wordt gesproken van bijna 500 meter eigen grond, maar die blijkt veel groter. 60 vierkante meter wordt gehuurd van de gemeente en dus geen eigendom. Ook is een hele hoek van gemeentegrond in gebruik waardoor er een gigantische tuin ontstaat, maar hoe die tot stand komt, staat niet in de (te) beperkte tekst op funda. Ook geeft deze makelaar aan Huizen eerst op socials te zetten voor deze op funda komen. Dus je bent verplicht hun te volgen om de nieuwe woningen te kunnen zien. Dat is toch niet waar je voor kiest als verkoper? Maar de reden voor deze lage beoordeling is de manier waarop de makelaar ons vandaag de woning heeft laten zien. Precies op tijd kwamen we bij de woning aan en na 10 minuten stond de volgende kijker al op de stoep. Waarop de makelaar ons de schuld gaf van zijn mislukte planning. “Ja, jullie waren te laat en zij zijn te vroeg”. Dus hij ging naar de andere kijkers om ze de tuin in te leiden terwijl wij nog boven stonden. Lekker dan. Man komt terug, we lopen naar zolder en ik kreeg een gevoel van afraffelen. Terug beneden zegt hij “kijk nog maar even rond, ga ik door met de volgende”. Het is toch geen open huizen route ofzo? Daarnaast was de woning te duur voor de huidige staat (originele jaren 70 keuken en badkamer, cv van 25 jaar oud, enkel glas op zolder enz enz) van de woning in vergelijking met vergelijkbare woningen. Ja de tuin is groot, maar ook voor een flink stuk van de gemeente. Voor huizen in dit segment maakt hij zich er veel te gemakkelijk van af.
-
Spaarne 34
10Translated by AIWe have experienced the sale of our house as a very pleasant experience! A lot of effort and time has been invested in it, for which we are very grateful.
-
Paltrokmolen 14
10Translated by AIWe had already heard about EV Wonen through friends and acquaintances, and because of the positive messages we chose EV Wonen. Friendly, calm and reasonable, straight forward. Very satisfied with the organization of the entire sales process. Stylist, energy label, photos, scheduling visits - all this went smoothly one after the other.
-
Tuin van Freyr 57
10Translated by AIWe look back on Edwin's services with great satisfaction. The personal contact felt genuine and involved, while at the same time work was carried out in a very professional and goal-oriented manner. Edwin was highly accessible and responded quickly and clearly to questions. What we especially appreciated is that everything was continuously considered from our perspective. No standard approach, but tailor-made and honest advice. Moreover, everything was well prepared and thought through in detail. From the initial inquiry...
-
David Sanderse
10Translated by AIVery knowledgeable and well-prepared real estate agent. We made clear agreements regarding the sale and they were followed through. The communication went smoothly and up to the notary we were professionally and kindly supported. Hence this review, which is an exception.
-
bryan
2Translated by AIWarning for this company We wanted to buy a house through this company and made an offer, subject to a structural survey. From the first survey it turned out that the house had serious defects. The sellers and Edwin were not in agreement with this report and insisted that additional surveys be carried out. The party we then engaged ourselves, was also labeled by them as “unreliable”. They wanted to exclusively accept a third party that was arranged through themselves, because according to them that would be good. This has led to extra costs, while multiple reports confirmed the same serious defects, including cracks, subsidence and structural problems with a steel structure. In the end we did not buy the house because of these defects. Also another buyer before us was unable to buy the house for the same reasons. My advice: be extra careful with this company and always have a fully independent survey carried out.
-
Annemieke Weijers
10Translated by AIGood experience with the real estate agent. Neat, honest and open negotiations. Also nice that everything was handled on time and correctly.
-
Gabriëlstraat 17
10Translated by AIEV Wonen showed comprehensive market knowledge and a solid approach and quotation discussion right from the first conversation. EV Wonen was able to quickly put the house up for sale, accompanied by professional advice on preparing the sale. We are impressed by the enthusiasm, quick action, fast communication and quick sale.
-
Liesbeth Tilanusland 9
10Translated by AIThe real estate agent was very involved. We got a stylist who gave us advice. That was very nice. The tips we applied. We were able to sell our house very well and quickly. We are very happy with the process and the nice cooperation with EV Wonen. I can recommend this real estate agent to everyone!
-
Maria Zegwaart-de Korte erf 6
10Translated by AICompetent and pleasant to work with. Has a professional and complete team around them. Also willing to take care of things if you are not present in the Netherlands at the moment.
-
leo en corrie groot
10Translated by AIWhat a great team, they are ready for you at EV wonen, they are knowledgeable and up to date, regarding the financial handling, and they know what they offer the customer, quick answers to questions, I give them a 10, very satisfied
-
Charlotte Ruysplantsoen 11
9Translated by AIThe real estate agent was always available for consultation, etc. Thought also well along. Kept me also well informed about the reaction of the viewers.
-
Ter Braaklaan 36
10Translated by AIA lot of personal contact with the real estate agent. We wanted a very fast process, and therefore everything was planned very tightly. Where quick switching was needed and this went smoothly between us. With the flexibility of all parties, everything came out as discussed; from the stylist, the photographer to the viewings, it proceeded at full speed but in the correct coordination and according to plan. With ultimately a fantastic result from the sale of our home.
-
Frida Katzland 10
10Translated by AIEverything went far above expectations, smoothly and professionally. Perfectly organized from start to finish!
-
Koraal 84
10Translated by AIEdwin has helped us for the 2nd time very well with buying and selling. He is honest and reacts very quickly. You are not just a number at EV living. He thinks with you.
-
Pieter de Hooghstraat 71
10Translated by AIA pleasant and enthusiastic real estate agent. Clear in communication, listens well to the customer's wishes/input, moves along with the planning and an involved and people-oriented approach. He keeps you well informed about the status of the sale. All in all, very satisfied! Thanks for the nice cooperation!
-
van Teylingenlaan 32
9Translated by AIWe find EV Wonen Makelaardij B.V. very good, clear agreements and super fast with the handling we are very satisfied
-
Lapis Lazuli 151
10Translated by AIVery nice people, very communicative skilled and always willing to make time for you. If not reachable, always a quick call or message back.
-
Frida Katzland 42
10Translated by AIEdwin is a very pleasant real estate agent. Low-threshold, expert and always easy to reach. The sale of my home went quickly and smoothly thanks to the short lines and clear communication. Also, the stylist and photographer were top, professional and ensured a nice presentation of my home.
-
Ribeslaan 7
10Translated by AIEdwin is a nice and professional real estate agent with good knowledge of the market. The communication during the sales process is smooth, he always responds quickly and gives good advice. In short, all praise for Edwin and his team.