SMASH Makelaars - dé lokale vastgoedspecialist
SMASH Makelaars is a local real estate specialist with offices in The Hague and the surrounding area. Since 2018, Alexandra van der Schot and Sander van Meerten have been working together to offer a fresh approach that aligns with the current needs of our customers. With years of experience in both buying and selling homes, we emphasize reliability, involvement, and creativity. Our modern approach ensures that your home is optimally pre...
Current housing stock
-
- Available
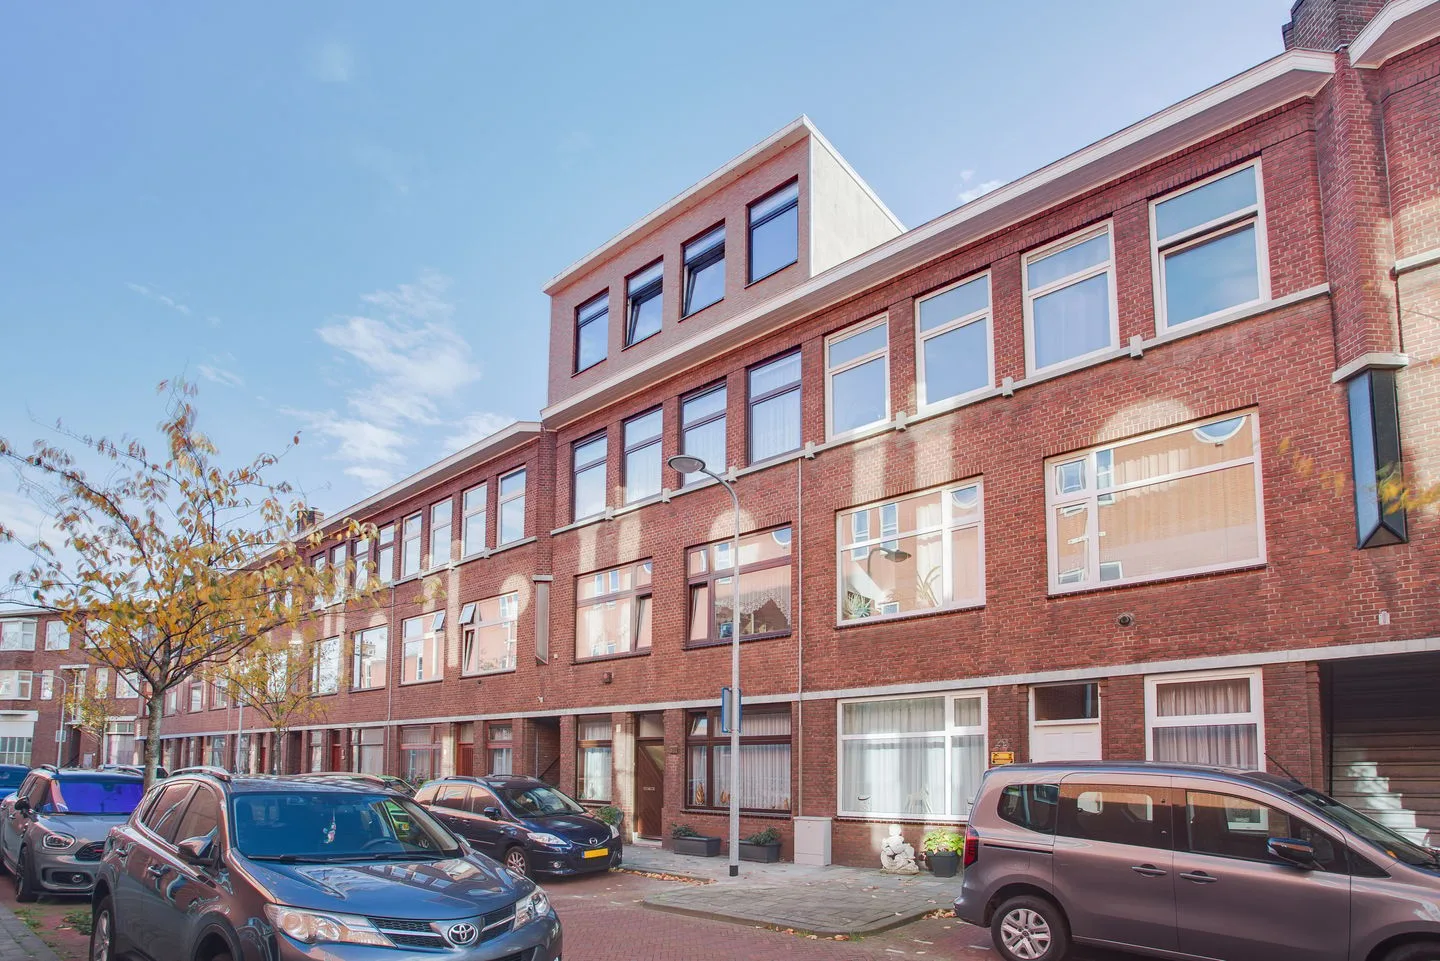
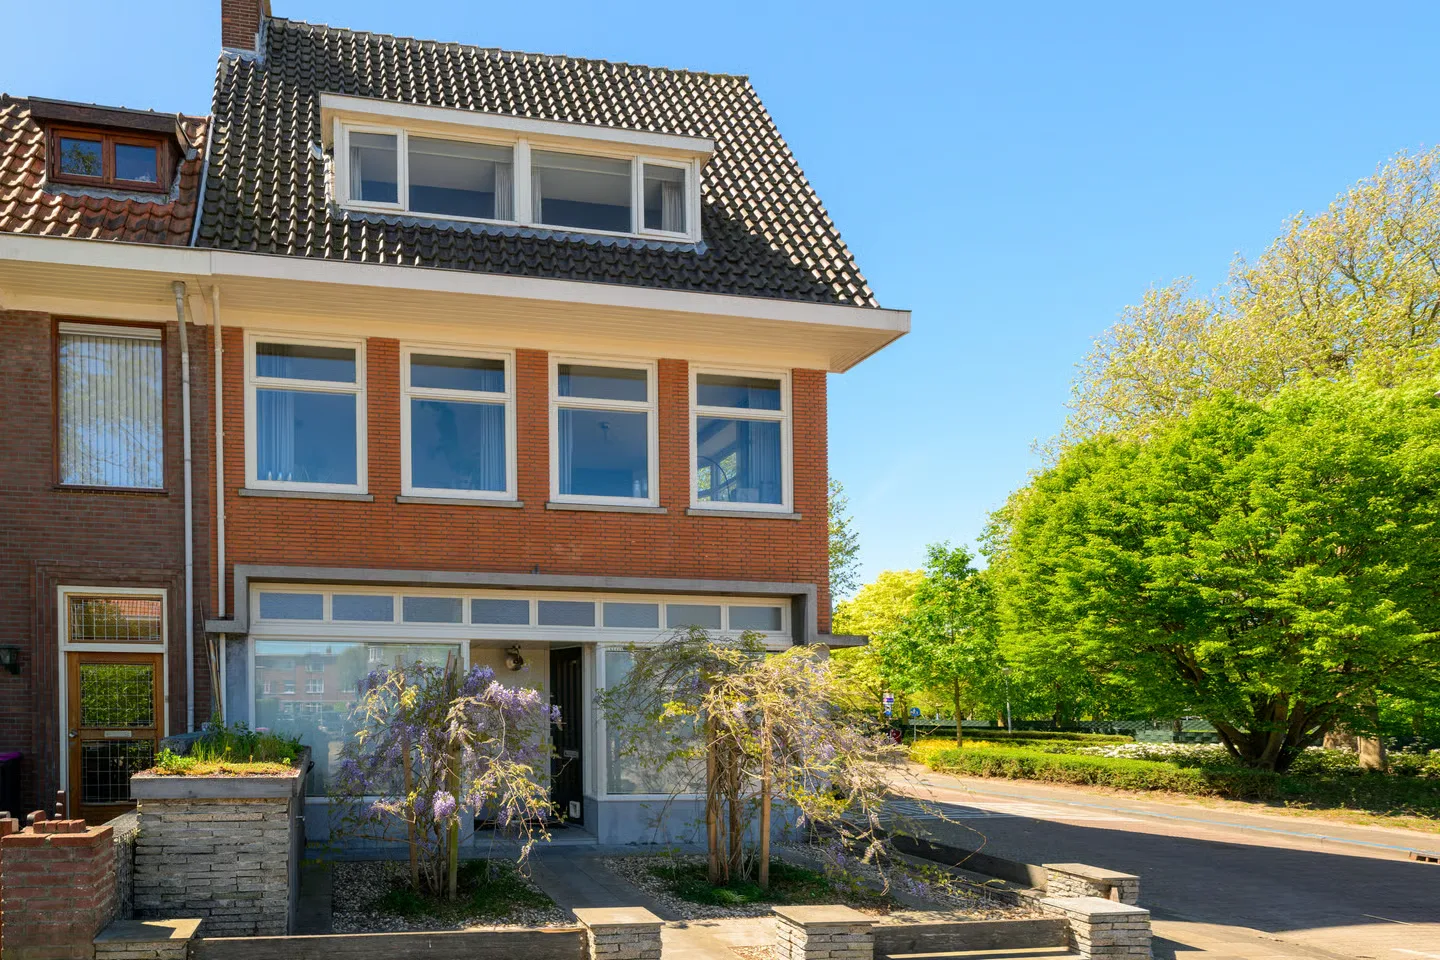
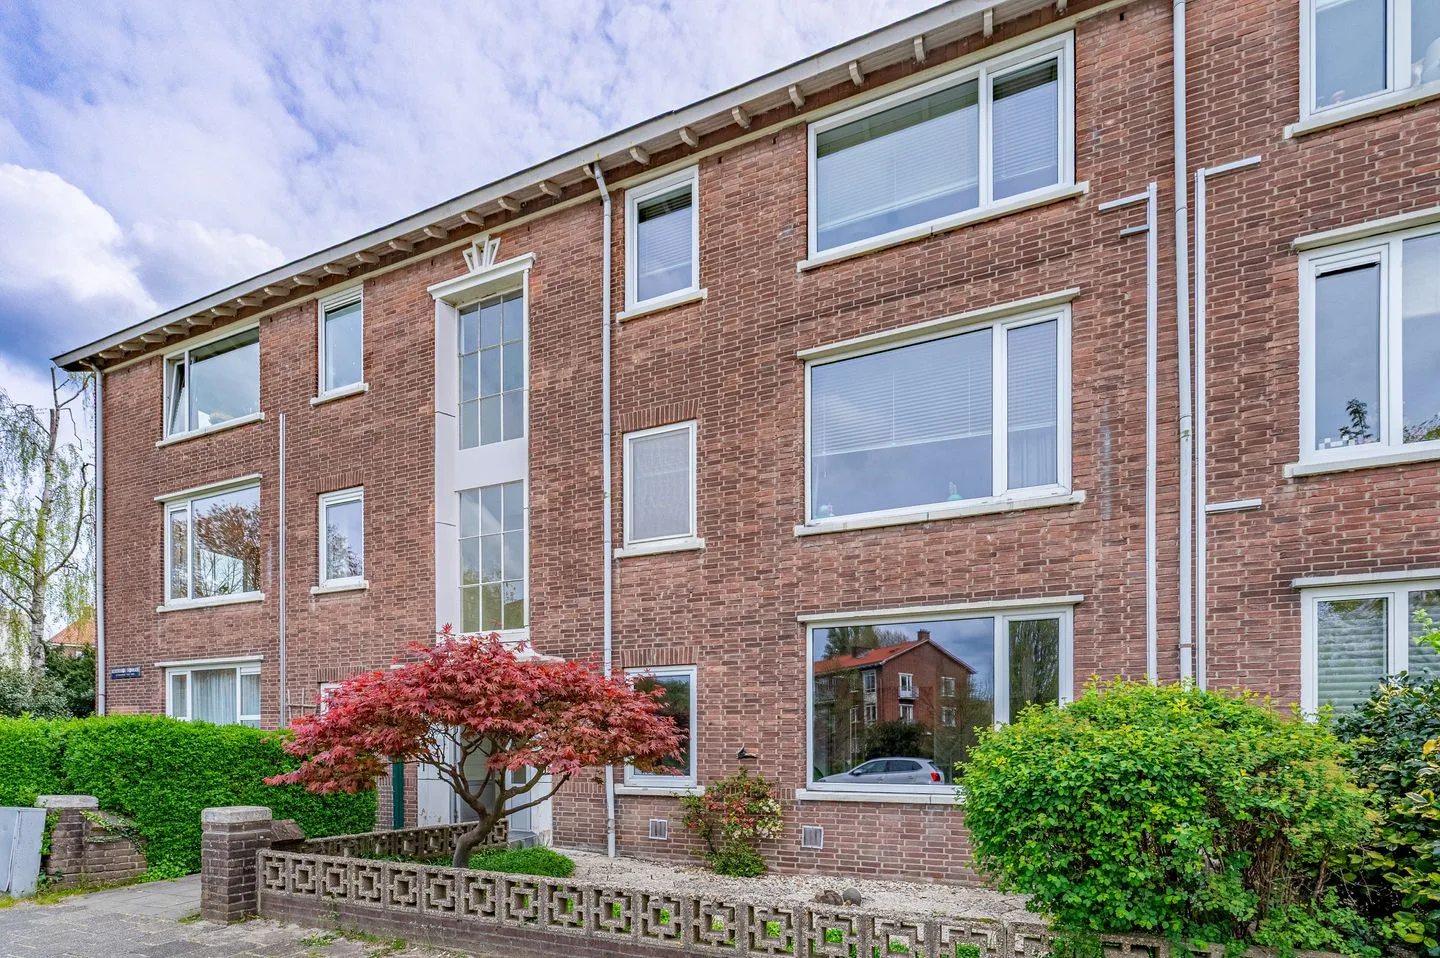
van Lodensteijnstraat 14
2274TZ Voorburg
€ 365.000 k.k.
CSave as favorite- Living area
- 81 m²
- Land area
- —
- Bedrooms
- 1
-
- Available
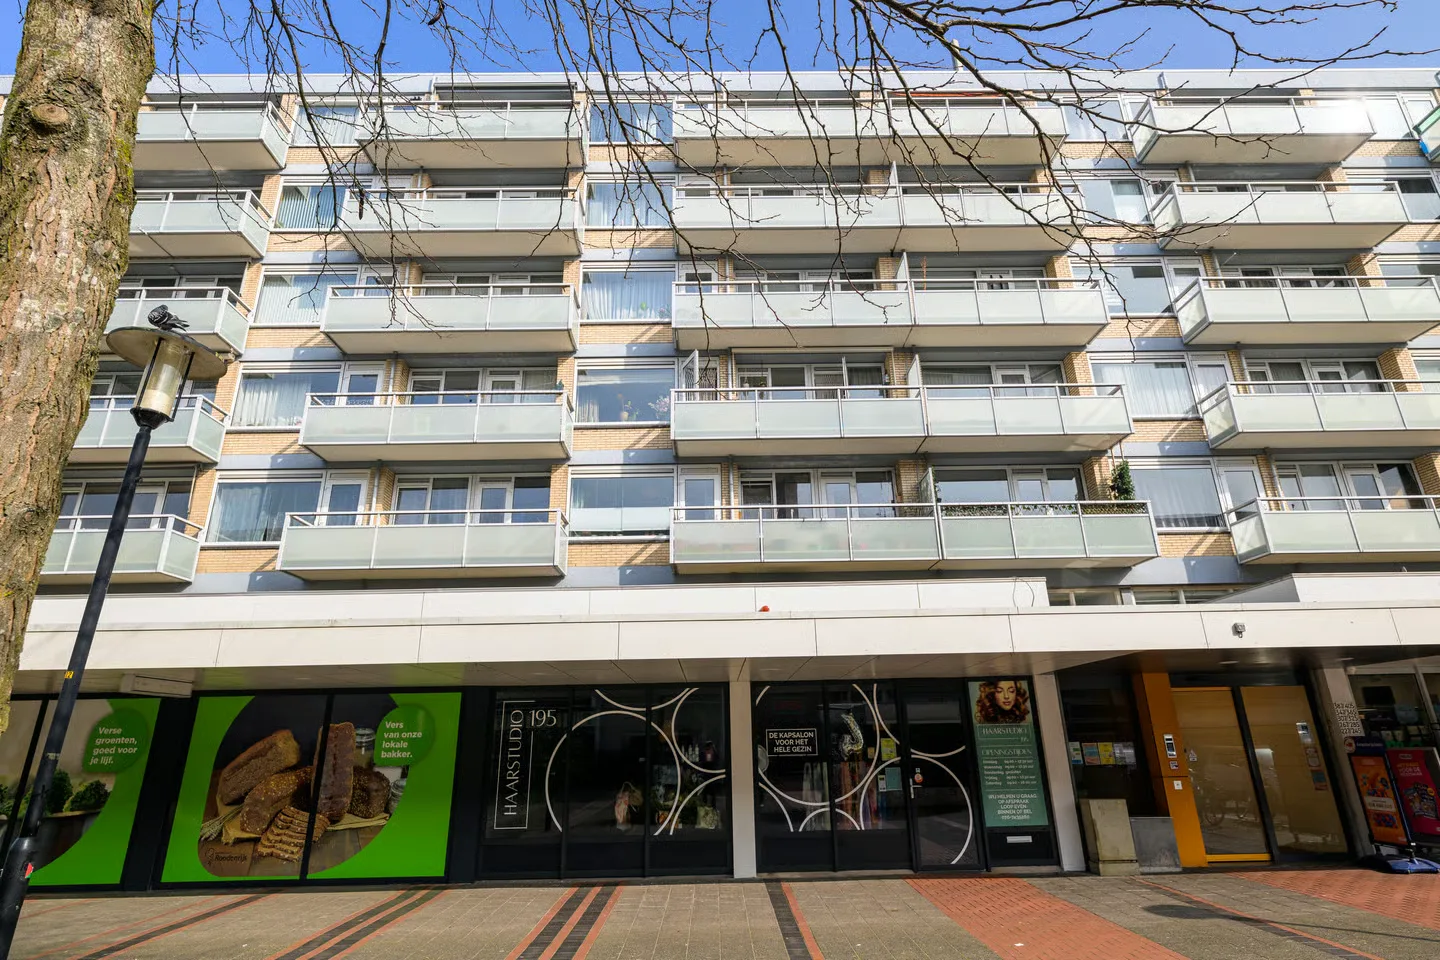
Prins Frederiklaan 275
2263HE Leidschendam
€ 295.000 k.k.
BSave as favorite- Living area
- 79 m²
- Land area
- —
- Bedrooms
- 2
-
- Available
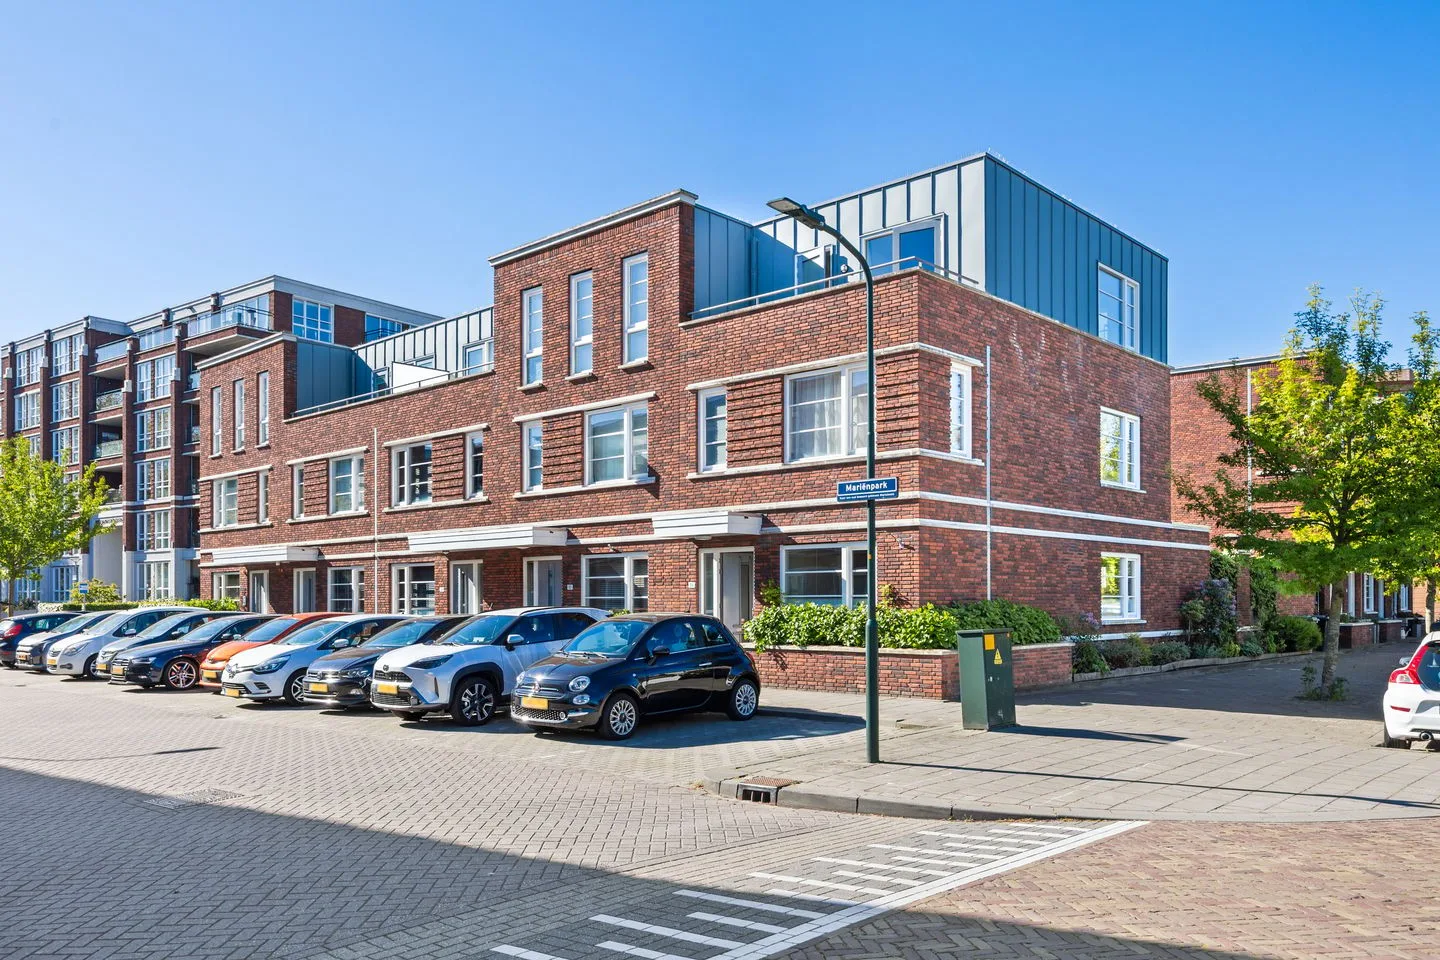
Mariënpark 156
2264CZ Leidschendam
€ 799.000 k.k.
€ 5.327/m²
ASave as favorite- Living area
- 150 m²
- Land area
- 159 m²
- Bedrooms
- 5
-
- Available
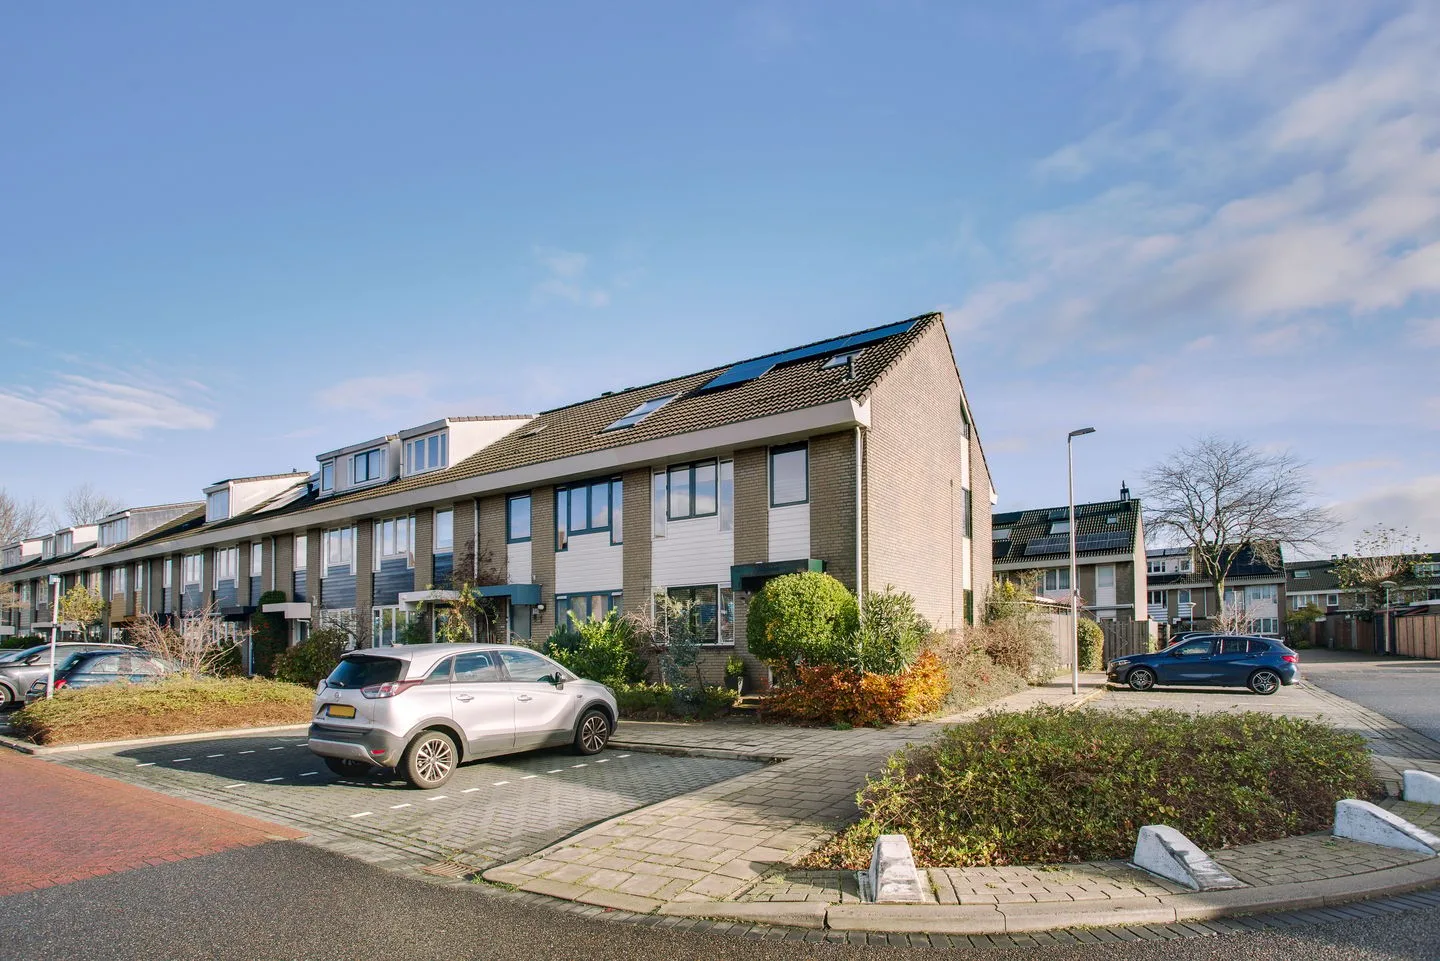
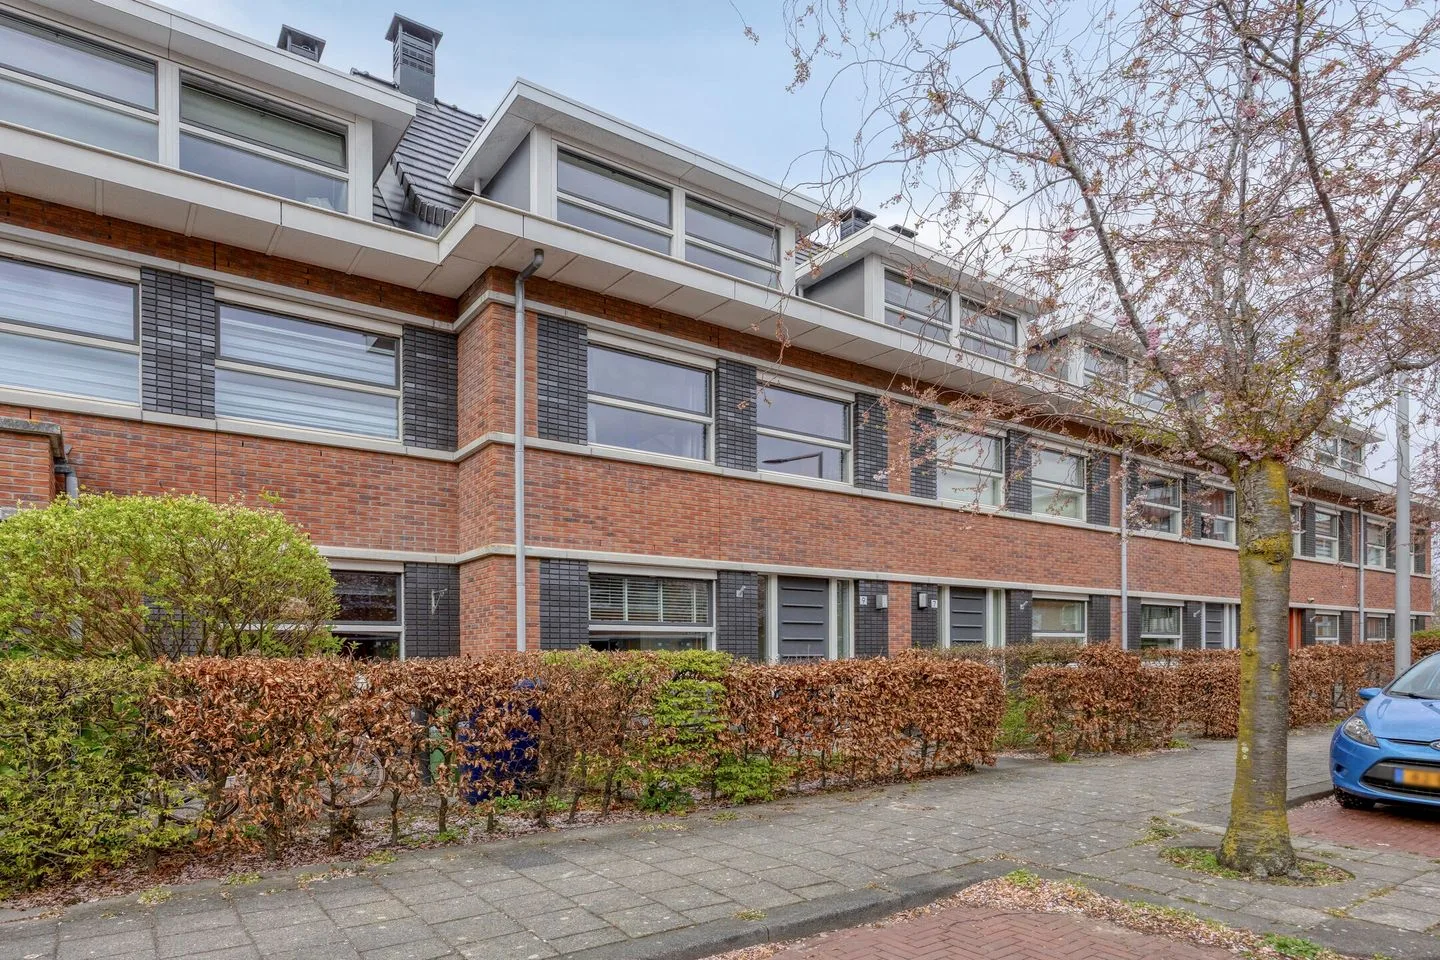
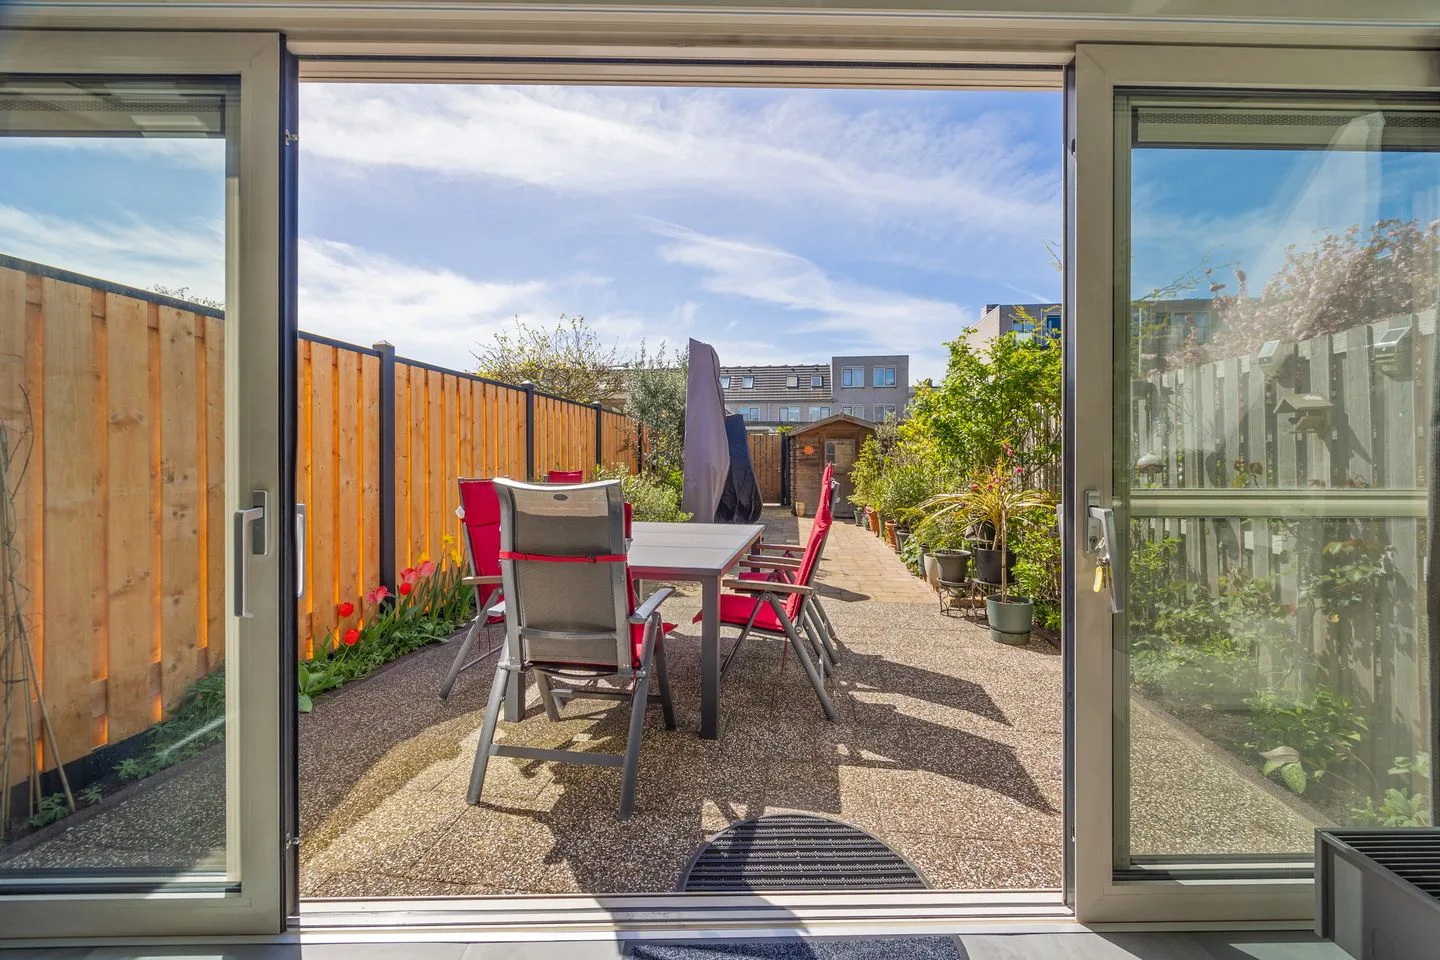
Remmersteinstraat 149
2532AZ Den Haag
€ 560.000 k.k.
€ 4.058/m²
ASave as favorite- Living area
- 138 m²
- Land area
- 154 m²
- Bedrooms
- 4
-
- Available
Alberdingk Thijmkade 6
2274XV Voorburg
€ 400.000 k.k.
€ 5.479/m²
CSave as favorite- Living area
- 73 m²
- Land area
- —
- Bedrooms
- 2
-
- Available
Johan Ringerskade 365
2521SL Den Haag
€ 765.000 k.k.
€ 4.752/m²
A+++Save as favorite- Living area
- 161 m²
- Land area
- 90 m²
- Bedrooms
- 4
Reviews (85)
Review platforms
BronscoresTotal score
85 total reviews

Funda
1 reviews on Funda

84 reviews on Google
-
Jan Zoutendijk
10Sander van Meerten heeft mij als makelaar ontzettend goed geholpen Sander van Smash makelaars ,voordat ik Sander als makelaar nam zat ik bij Expat-Real Estate die een grove fout in de advertentie van Funda maakte ,de erfpacht op de woning was eeuwigdurend afgekocht en de makelaar had onderin de advertentie vermeld dat de erfpacht niet eeuwigdurend afgekocht was ,ik had in bijna 1jaar 2 bezichtigen en geen bod en Sander heeft me op de fout gewezen en binnen 3 maanden het huis verkocht ,hij is deskundig ,alert zeker niet slordig en nog een heel fijn mens ,wat wil je nog meer ! ,beter bestaat niet (volgens mij ) 👍Jan Zoutendijk Oosteinde 68 A 2548 AL Den Haag
-
Jacqueline Hendriks
10Translated by AISmash real estate agent is a recommender. If you want a reliable and more accessible real estate agent, you must be with Smash real estate agent. Very customer-oriented, expert and thinks with you. Nothing is too much for him, gives good advice, and moreover always cheerful, which is also worth a lot. According to me, there is no better real estate agent than Jacqueline.
-
Sophie
2Translated by AIVery poorly helped by Alexandra, she lied to us and customers and made promises she did not keep.
-
frits frits
10Translated by AII am extremely satisfied with my experience with Smash Makelaars. From the first contact, everything felt professional, clear and personal. The communication was fast and clear, so I always knew where I stood. Everything was also well organized and guided, which has removed a lot of stress. Thanks to their dedication and market knowledge, everything went smoothly and successfully. I can therefore definitely recommend Smash Makelaars to anyone looking for a reliable and involved real estate agent!
-
M 50sch
10Translated by AISander has sold both our house and also assisted us in acquiring a new home. No effort is too much for him and he is always friendly and pleasant. We have bought and sold houses more often, but we have never had such a good real estate agent. We recommend him to everyone! MV
-
Judith NienkeMax
10Translated by AI'Sander, sells houses like no other,' we always said for fun when Sander called us. Secret: this is not a joke but reality. With an impressive expertise, flawless insight into the real estate market and a friendly way of dealing with people, Sander sold our house within no time for a top price. Smash real estate agents is therefore highly recommended. Our old house is now a beautiful nest for starters and thanks to Sander we can worry-free take our next step. Let Sander sell your house, follow his advice: guarantee for success! Thank you Sander!
-
Willem Timmerman
10Translated by AIWe bought our home in Voorburg through Smash Makelaar with Sander as the purchasing agent, and we are really extremely satisfied. The price-quality ratio is excellent: transparent, fair and without hidden surprises. From the beginning, the agreements were clear, what he would do, what we could expect and what it would cost. Sander is not only professional, but also personally involved. He thinks with us, asks the right questions and without hesitation takes an extra step when needed. Thanks to his commitment, we found the perfect home! What also greatly appealed to us was the aftercare. Even after the purchase, Sander remained involved, reachable and willing to think along. That's not seen often anymore. In short: exceptionally friendly service, genuine interest and a fantastic result. We wholeheartedly recommend Sander and Smash Makelaar to anyone looking for a (purchasing) agent.
-
Laura Chirea
10Translated by AISMASH Makelaars is the most helpful real estate agent in the Voorburg area. Their services go beyond just buying and selling property; they also offer advice on practical matters related to the home and arrange various contracts with contractors. Sander is a top professional with an enormous amount of experience and expertise.
-
Jesper Rook
10Translated by AIDuring the past period, we have experienced our buying and selling process under Alexandra's fine guidance. In this process, Alexandra has helped us in a professional and goal-oriented manner. She has reassured us at the right moments, came up with clear advice and was always available for this. This gives peace of mind and works very pleasantly. We definitely recommend Alexandra as a real estate agent!
-
Fabian Scheffers
10Translated by AISander has excellently supported us through the entire process of selling our house. He dives into your house, knows the surroundings well, adapts the sales strategy to the house and market, and is continuously involved. We had good conversations and discussions about the right sale. With good arguments, but also a listening ear, we came to the best method. Furthermore, he is not only involved during the sale, but also after the sale! And not entirely unimportant: he works together with a good photographer.
-
Luna Marchand
10Translated by AISander was our purchase agent when we bought our first home. He is very honest and will not try to get you into the first available house as quickly as possible so that he can make money fast. He is critical where necessary on homes and keeps your feet on the ground. We are very positive and have ended up with a super nice home!
-
Koen Vandongen
10Translated by AISmash was the selling agent of our new house in Pijnacker. We have communicated a lot with Sander and he has always helped us in a quick and correct way - combined with a good dose of humor. We are very happy with this and wholeheartedly recommend Sander!
-
Pirjo de Winkel
8Translated by AISander is skilled and pleasant to work with. We bought our house with/through him in 2018 and now sold it again...
-
René Smit
10Translated by AISander is an honest and reliable realtor without any frills. He also works with a fixed price for purchases, not a percentage, so he doesn't benefit from a higher price. He also responds quickly via Whatsapp or email.
-
Nick Steunenberg
10Translated by AIHad a good experience with the sale of our house on Klaverweide with Sander. Communication was smooth and enjoyable collaboration. Highly recommended as far as we're concerned!
-
Frank Aalbertsen
10Translated by AIReliable, involved and proactive real estate agent for our purchase of an apartment in 2018. Sander also sold this apartment again for us in 2023. He has also excellently assisted family and friends as a buyer's or seller's agent. We therefore highly recommend SMASH Makelaars!
-
Clariss Evangelista
10Translated by AIWe knew Sander through a colleague and we had heard how effective he is as an agent for his clients. So we didn't hesitate for a moment to involve him in the purchase of our first house and it was the best choice we ever made. He is very reliable in assessing whether a property is a good investment and what offer we should make based on his analysis. He is not only interested in buying a property, but also helps you find the best property that fits your wishes. I wholeheartedly recommend Sander van Meerten. Best of luck to SMASH MAKELAARS!
-
David Bokhorst
10Translated by AISander is simply a nice guy. Expert, reliable, thinks with you, not only for purchase, but also with tips for a possible renovation.
-
Elselien Breman
10Translated by AISander is an excellent real estate agent. He ensures that every step of the sales process flows smoothly and efficiently. His communication is always clear, quick, and professional, which gave me a lot of confidence throughout the entire process. Sander works quickly without compromising on quality and was always available to answer questions or provide advice. Thanks to his expertise and dedication, the sale went smoothly. I wholeheartedly recommend Sander to anyone who wants to sell their home.
-
Mohamad Ayoub
10Translated by AISander was our real estate agent when we sold our apartment. He is professional, honest and reliable. The entire sales process went very smoothly: from the moment the photos of the apartment were taken to the moment of signing the contract. Everything went quickly and organized, with virtually no hassle for us. If you are looking for a real estate agent who makes your life easier, I wholeheartedly recommend Sander from Smash Real Estate. And as a bonus, he speaks perfect English, in case you live abroad.