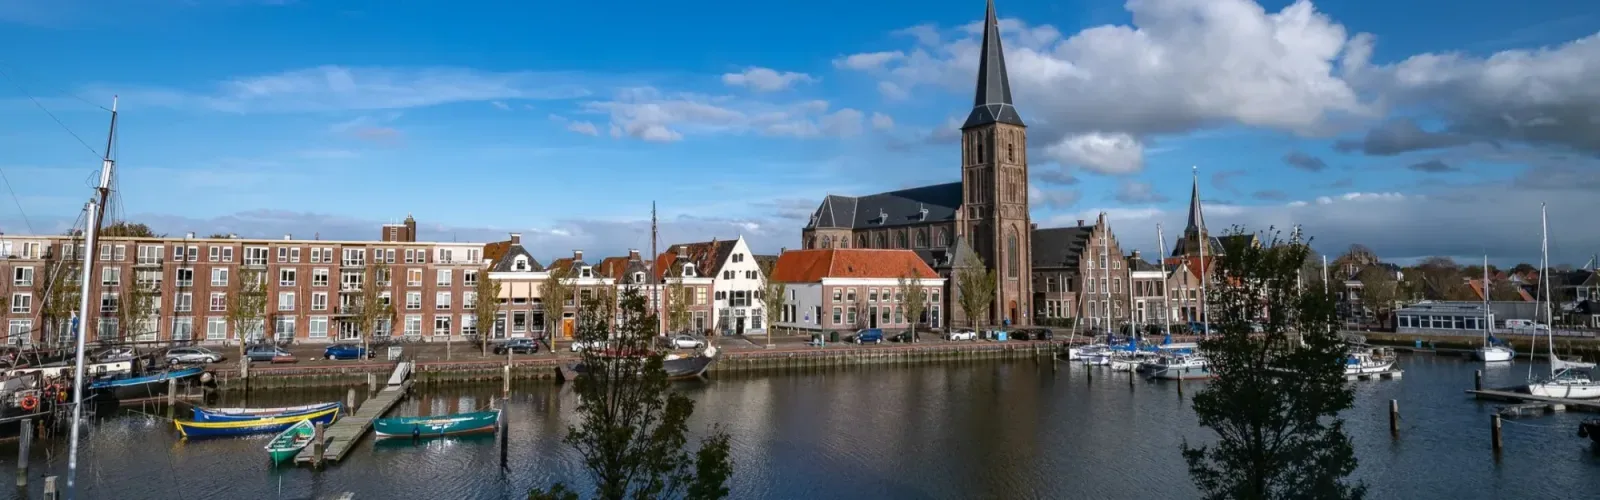
0517 Makelaars | Harlingen, Franeker en omgeving
0517 Makelaars is uw betrouwbare partner voor de verkoop en aankoop van woningen in Harlingen, Franeker en de omgeving. Wij staan voor persoonlijke begeleiding, transparante communicatie en een aanpak die op uw wensen is afgestemd. Wij bieden dienstverlening in verkoop, aankoop en financieel advies. Onze werkwijze is gericht op eerlijkheid, professionaliteit en een persoonlijke benadering. Wij spreken Nederlands, Engels en Fries, waardo...
Current housing stock
-
- Available
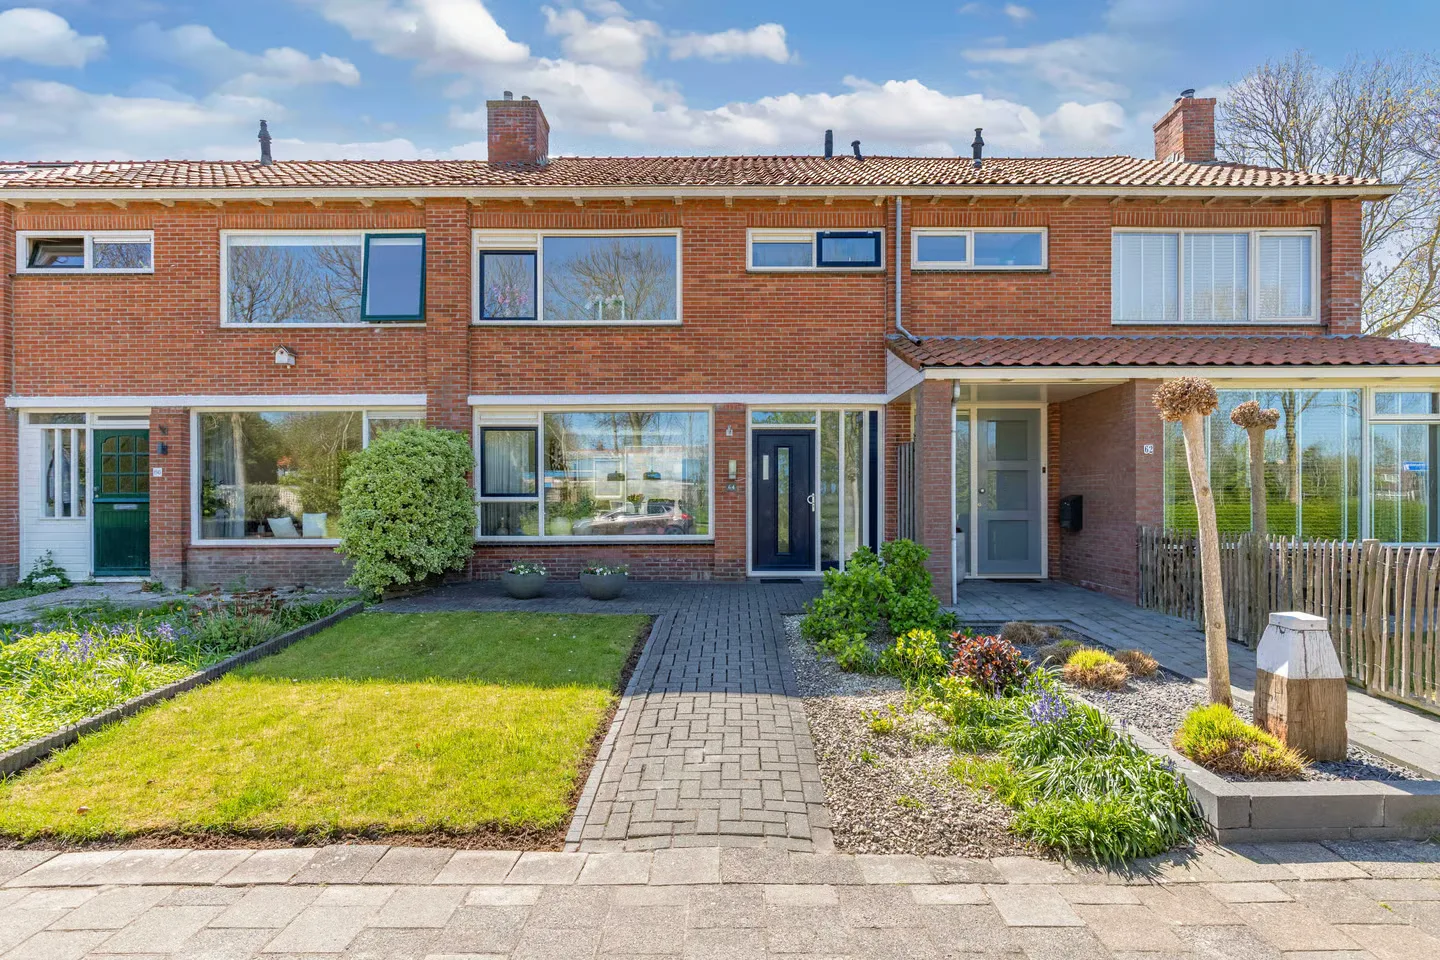
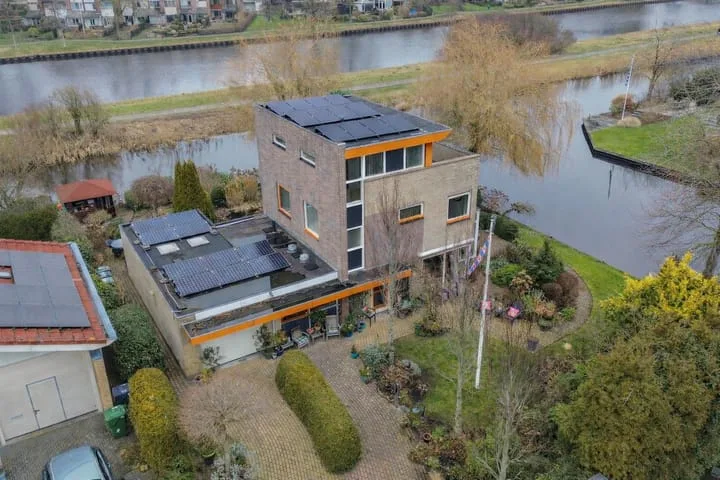
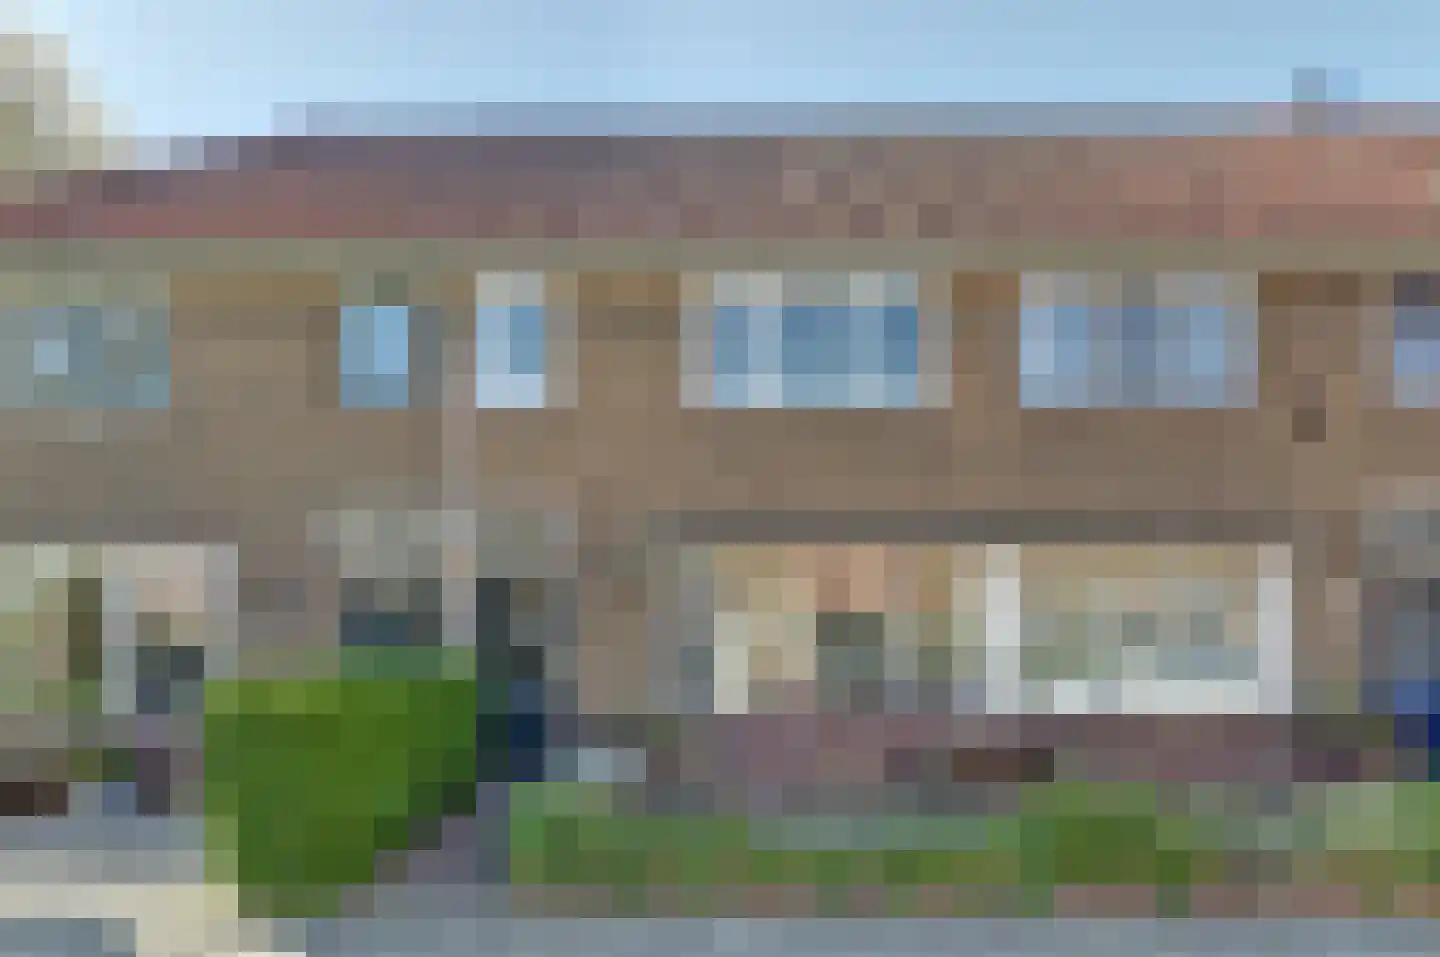
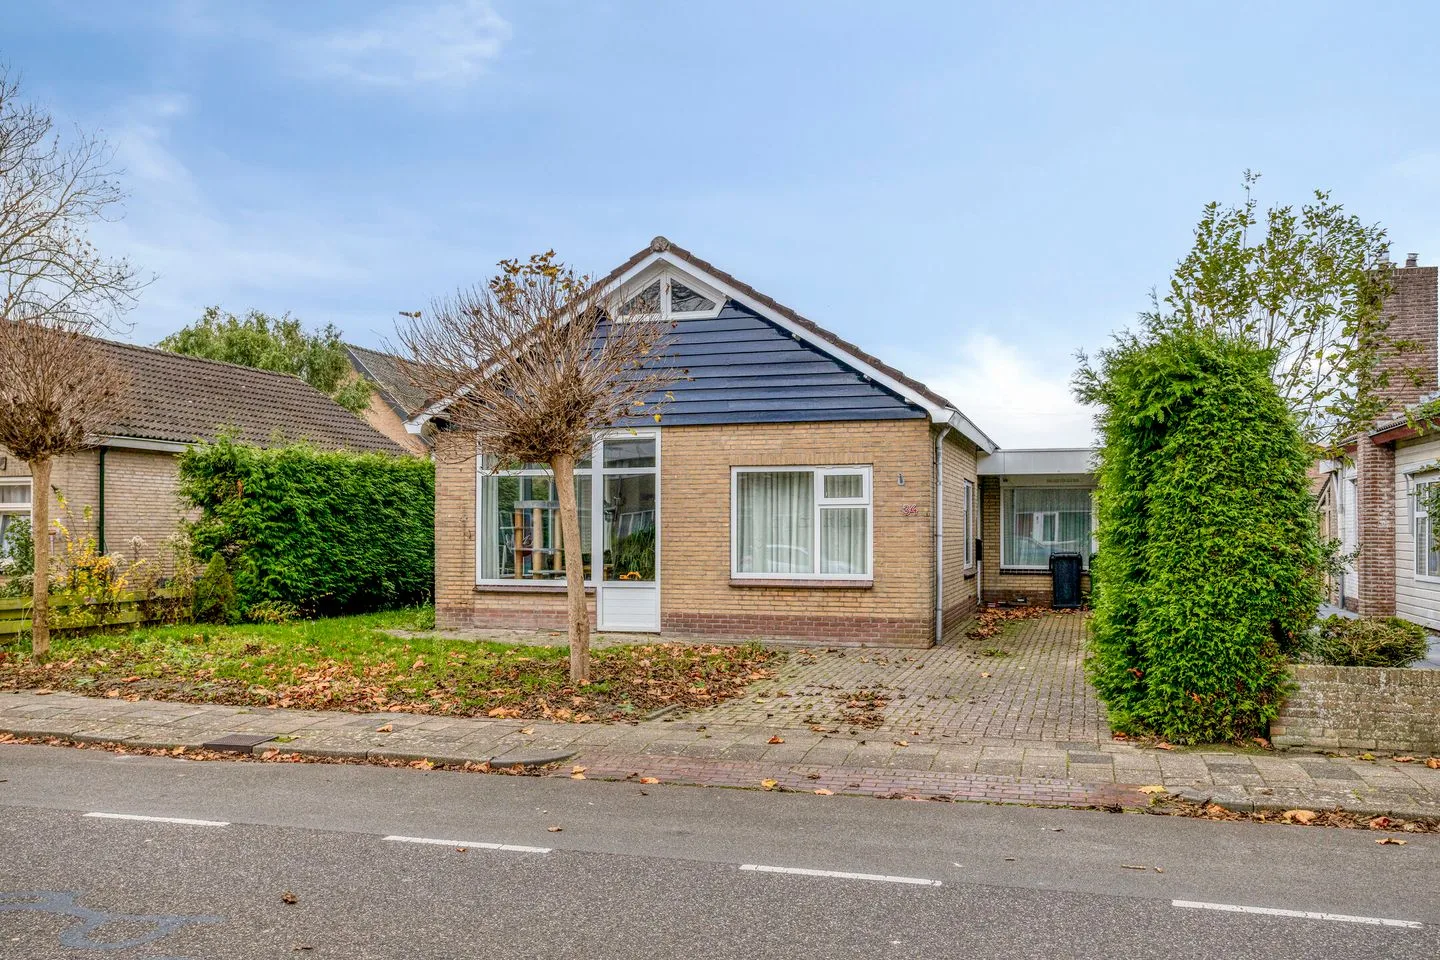
De Arend 8
8862TV Harlingen
€ 289.000 k.k.
€ 2.513/m²
ASave as favorite- Living area
- 115 m²
- Land area
- 171 m²
- Bedrooms
- 3
-
- Available
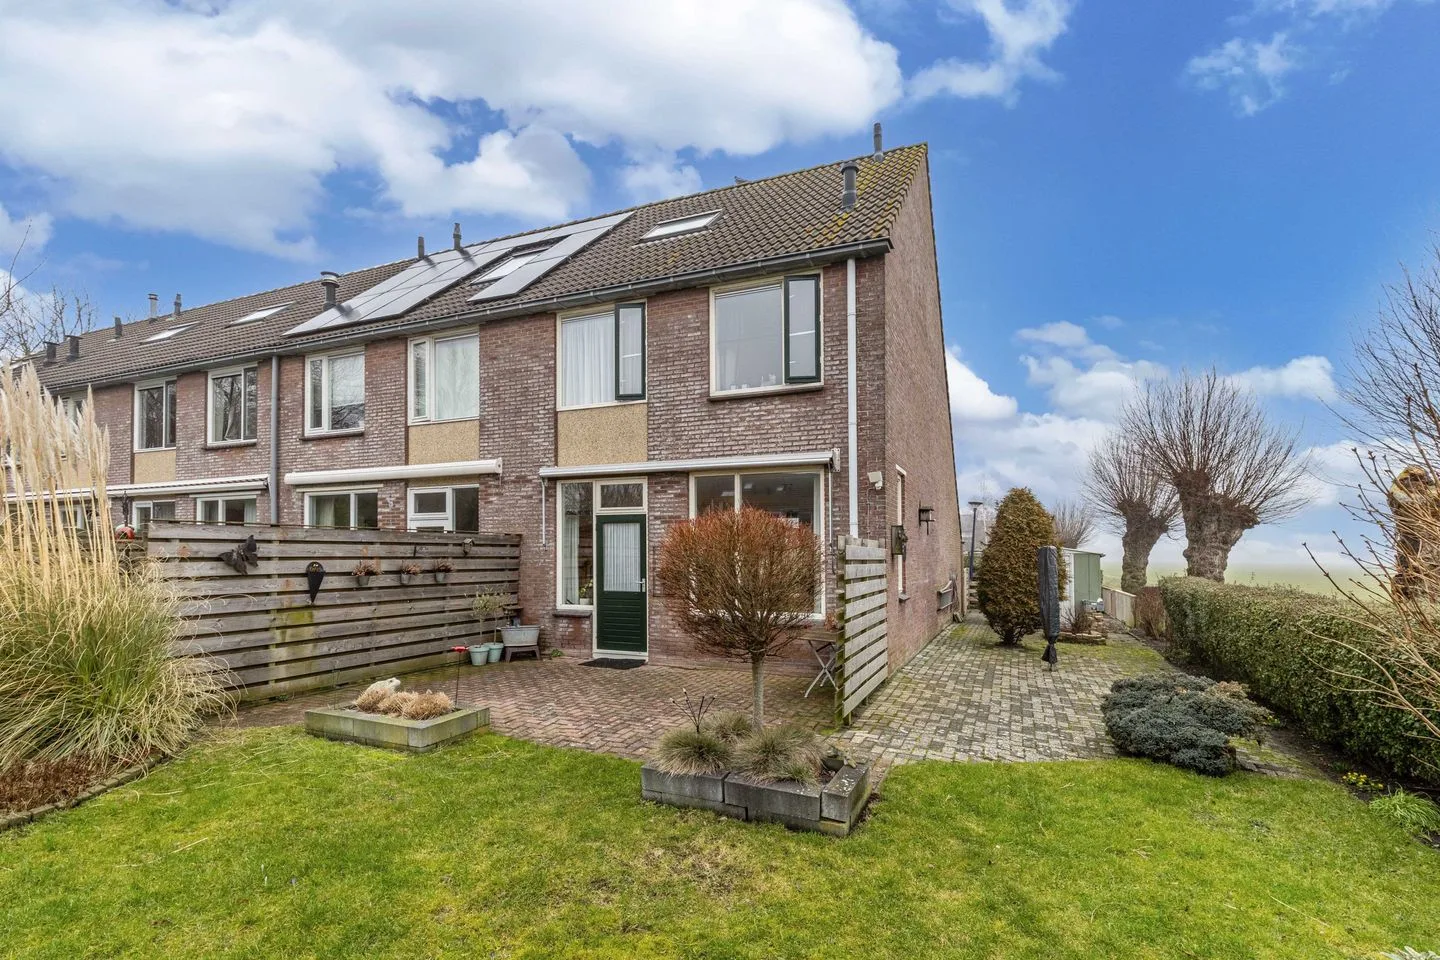
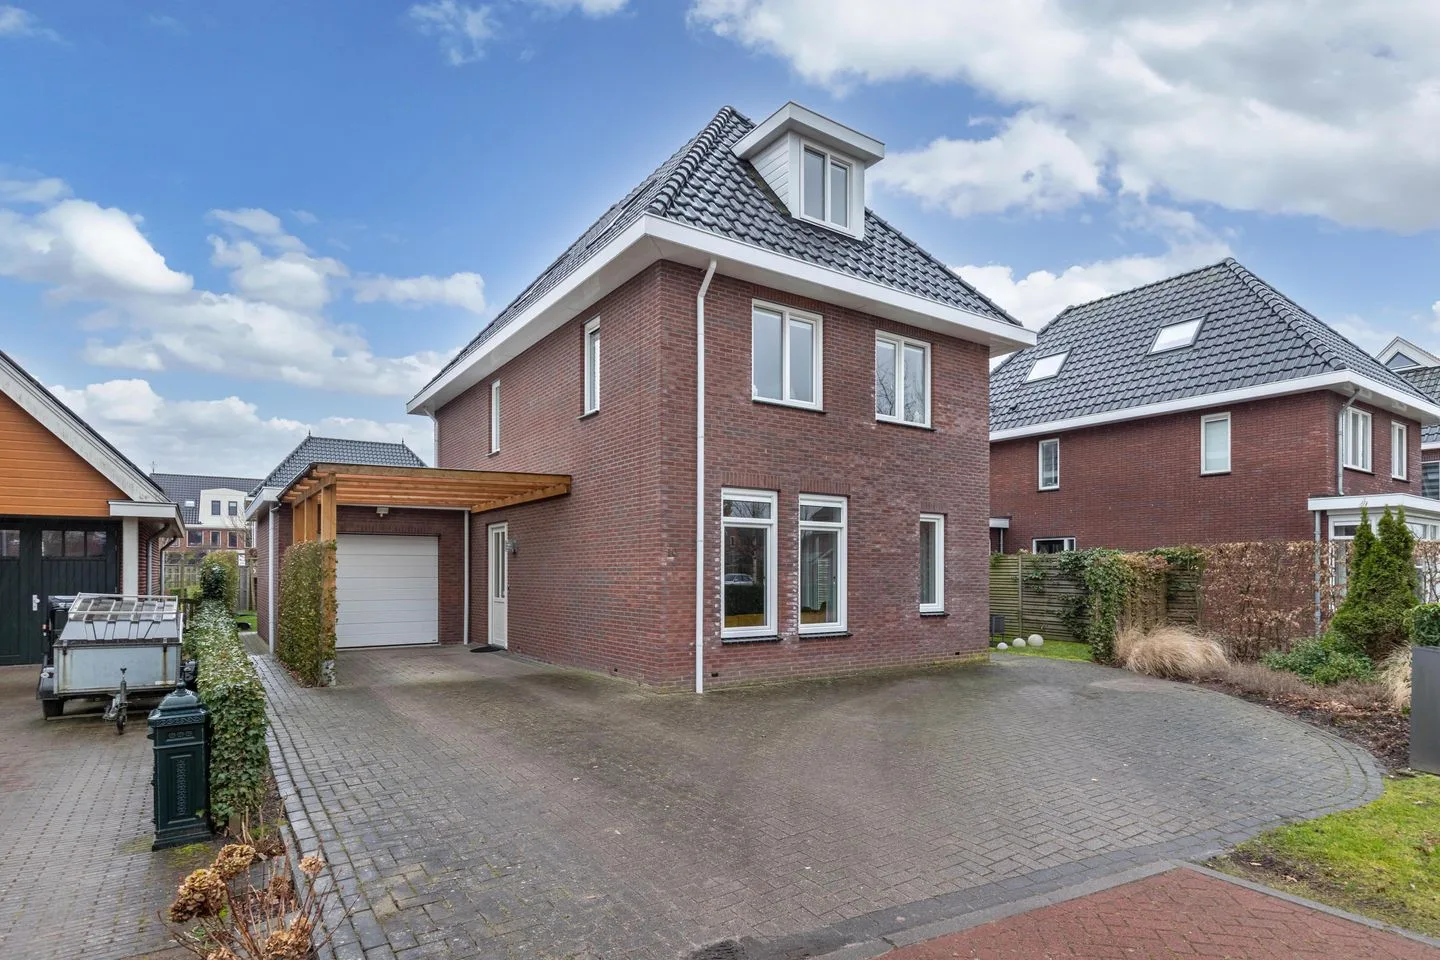
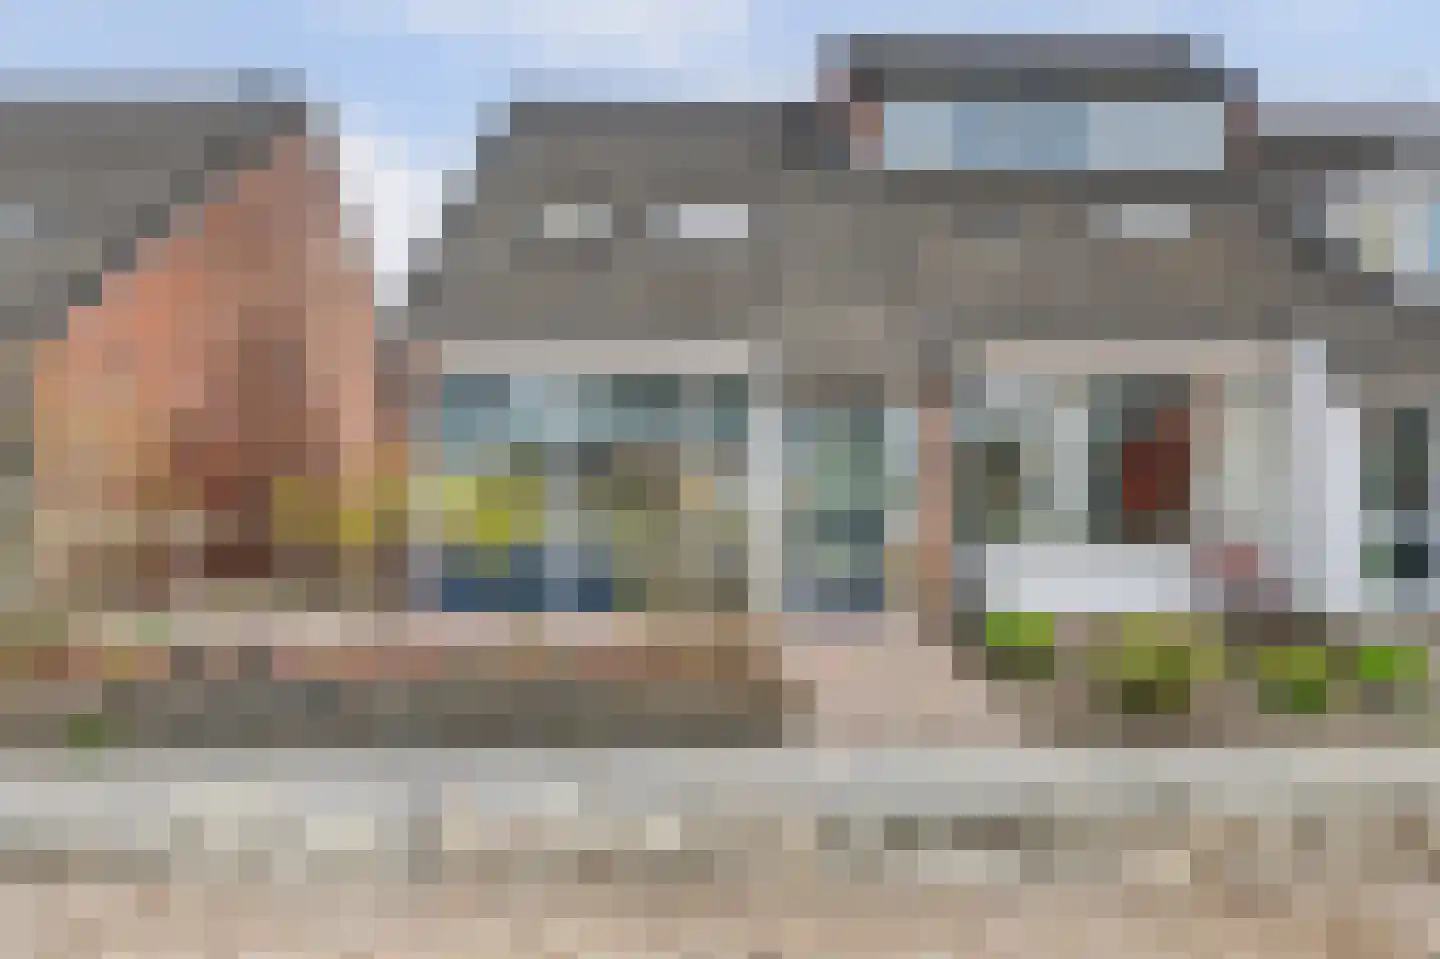
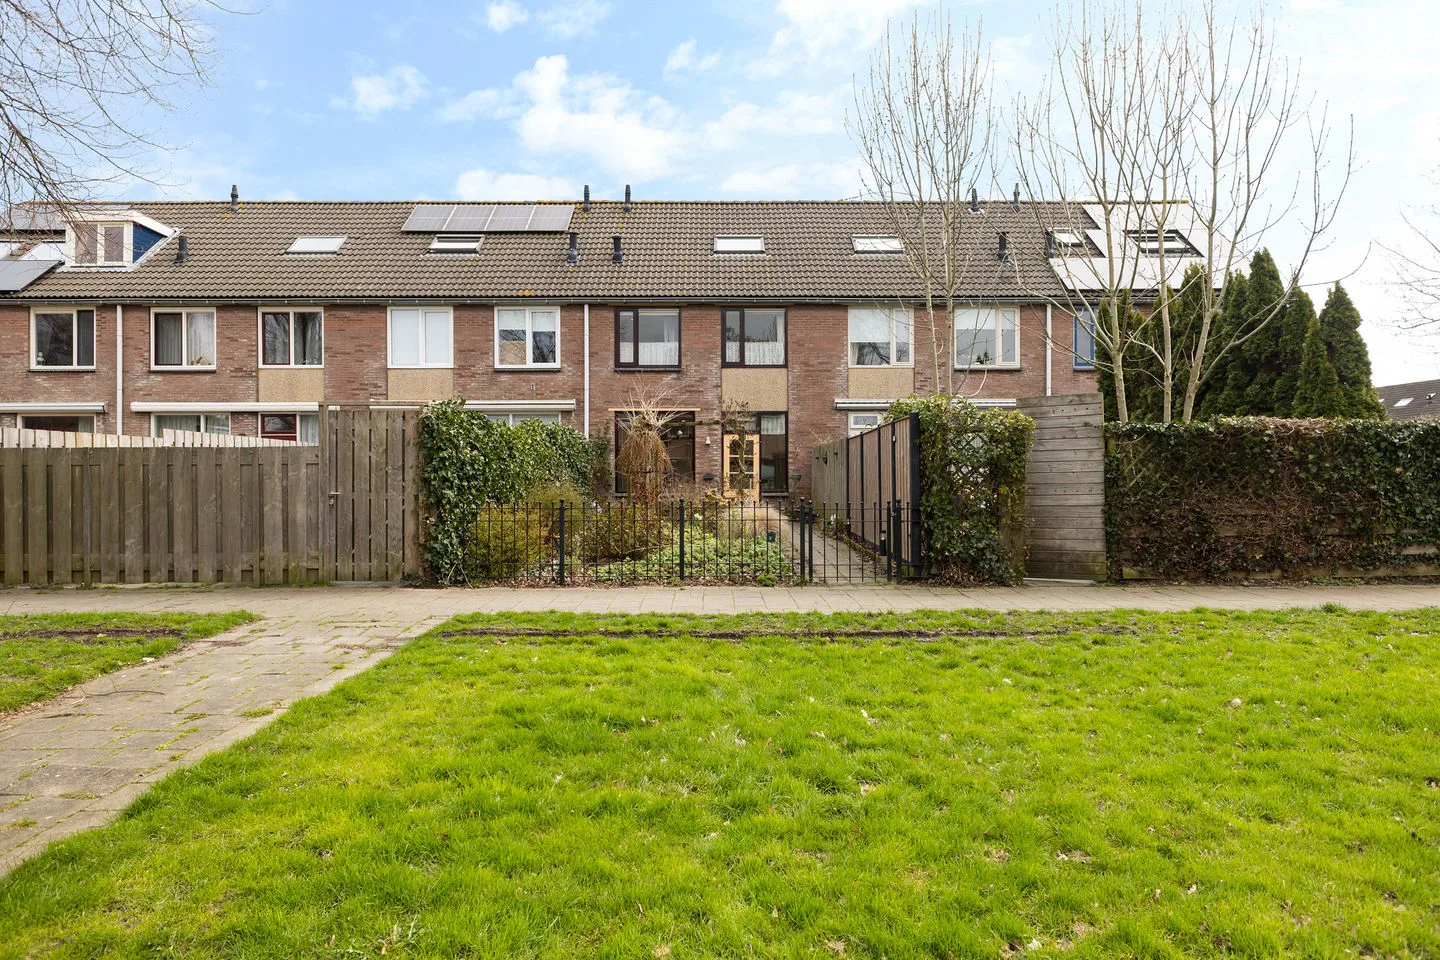
Hoekerhof 48
8862PJ Harlingen
€ 255.000 k.k.
€ 1.932/m²
CSave as favorite- Living area
- 132 m²
- Land area
- 151 m²
- Bedrooms
- 4
-
- Available
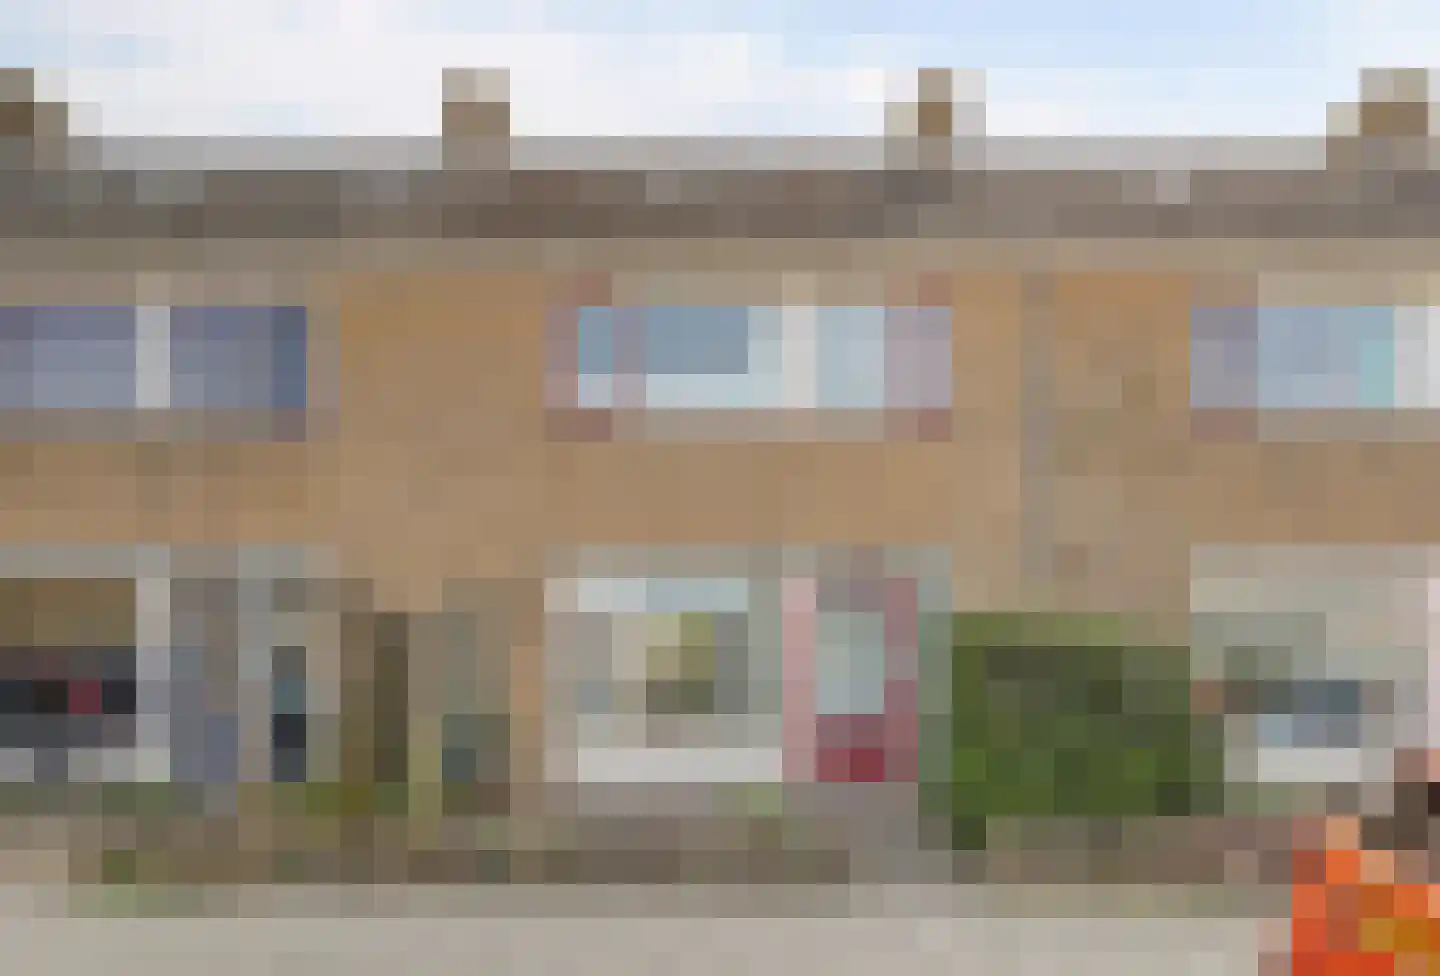
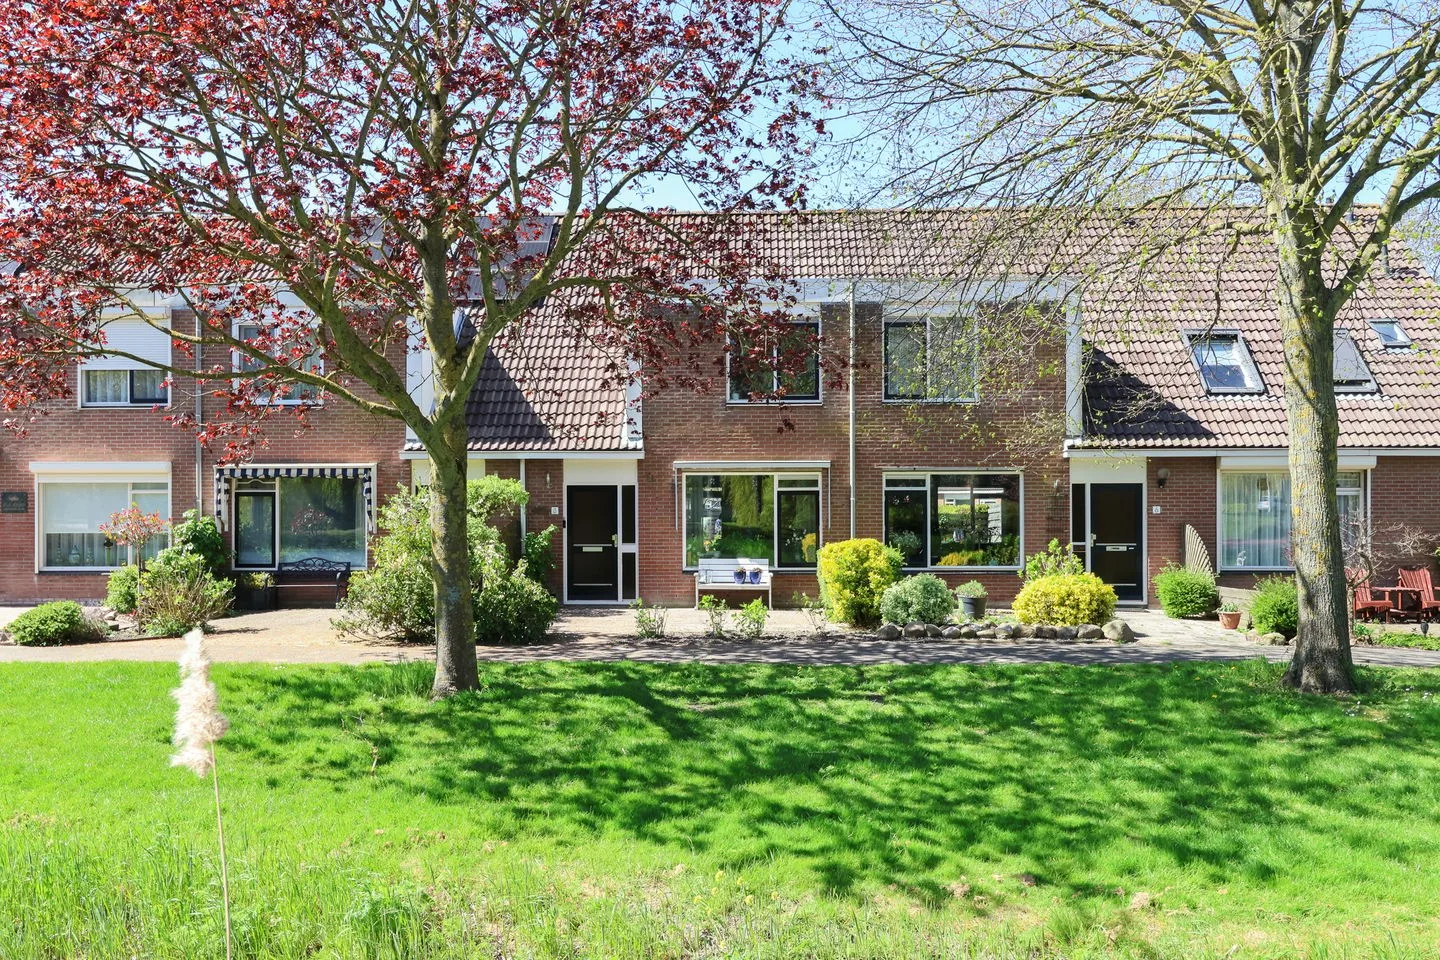
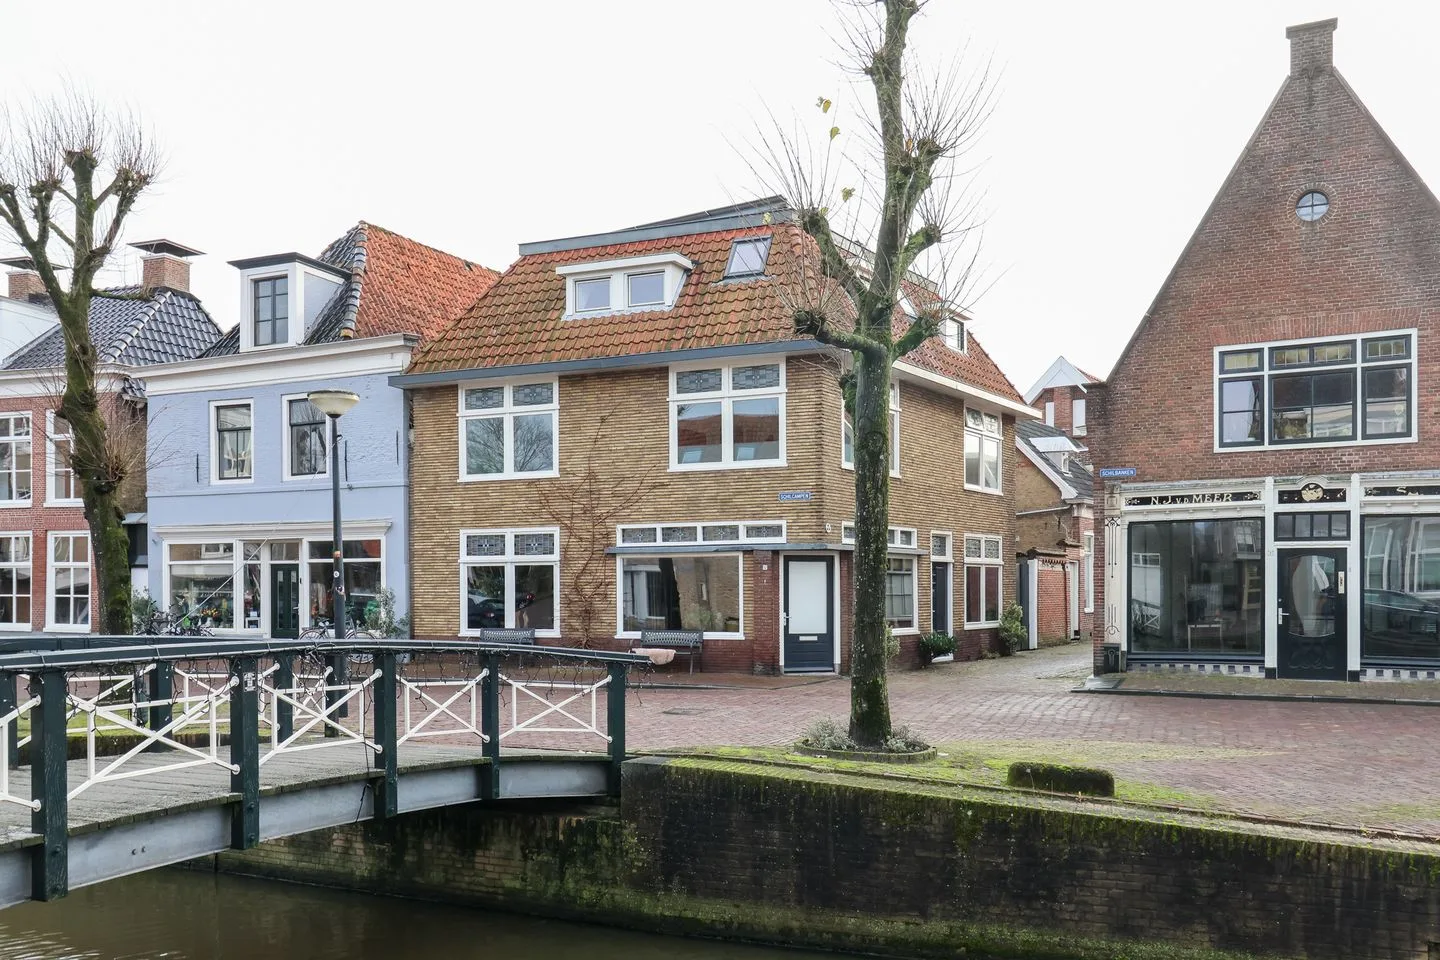
Schilcampen 52
8801ME Franeker
€ 499.500 k.k.
€ 2.291/m²
BSave as favorite- Living area
- 218 m²
- Land area
- 175 m²
- Bedrooms
- 4
-
- Available
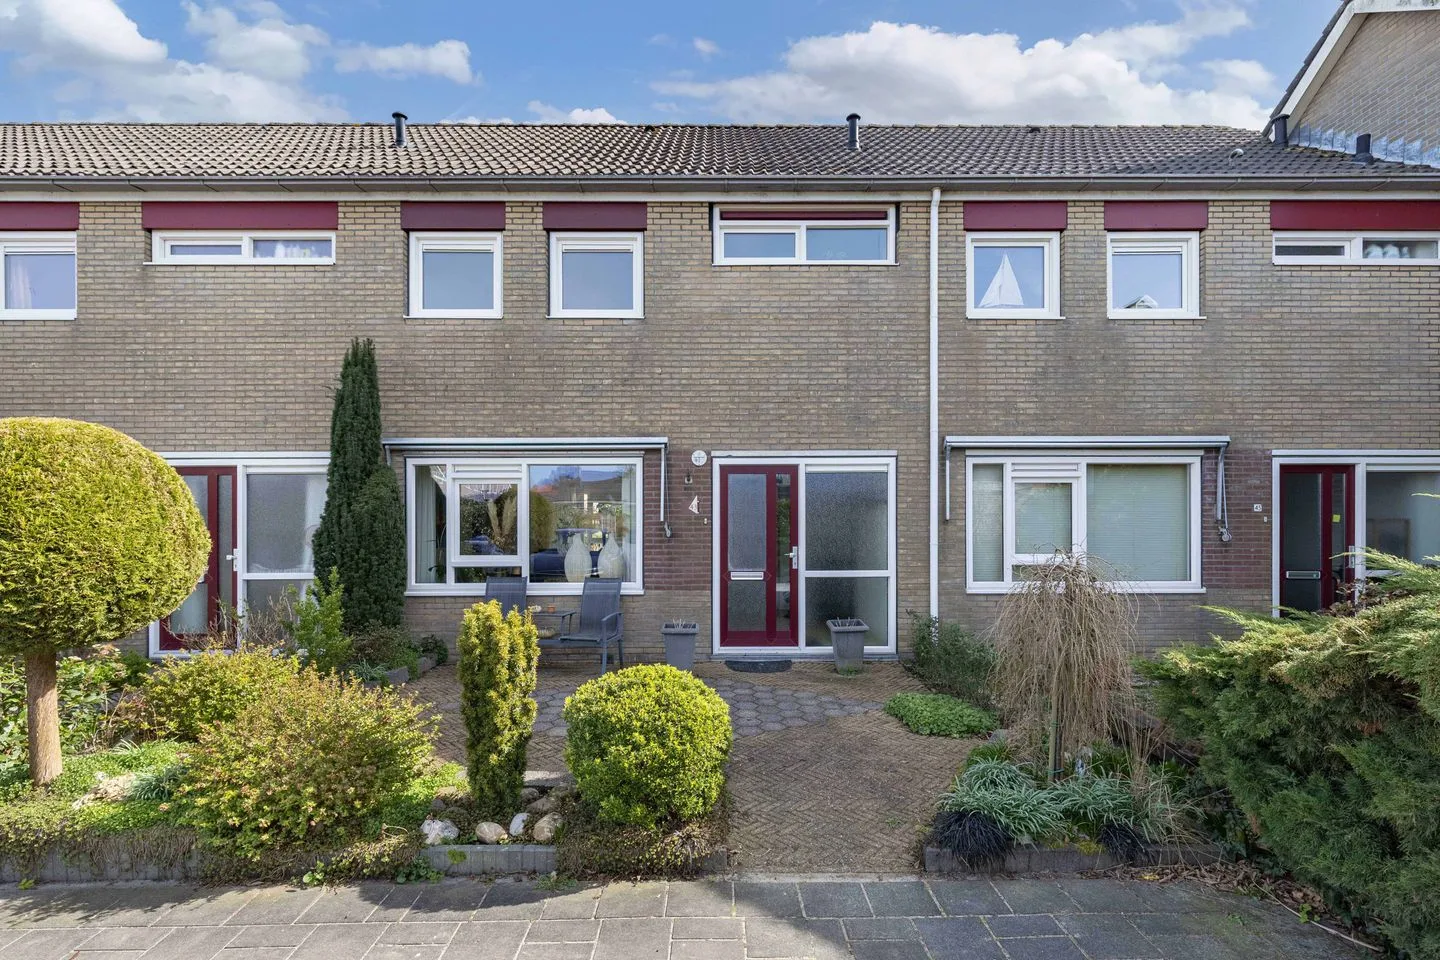
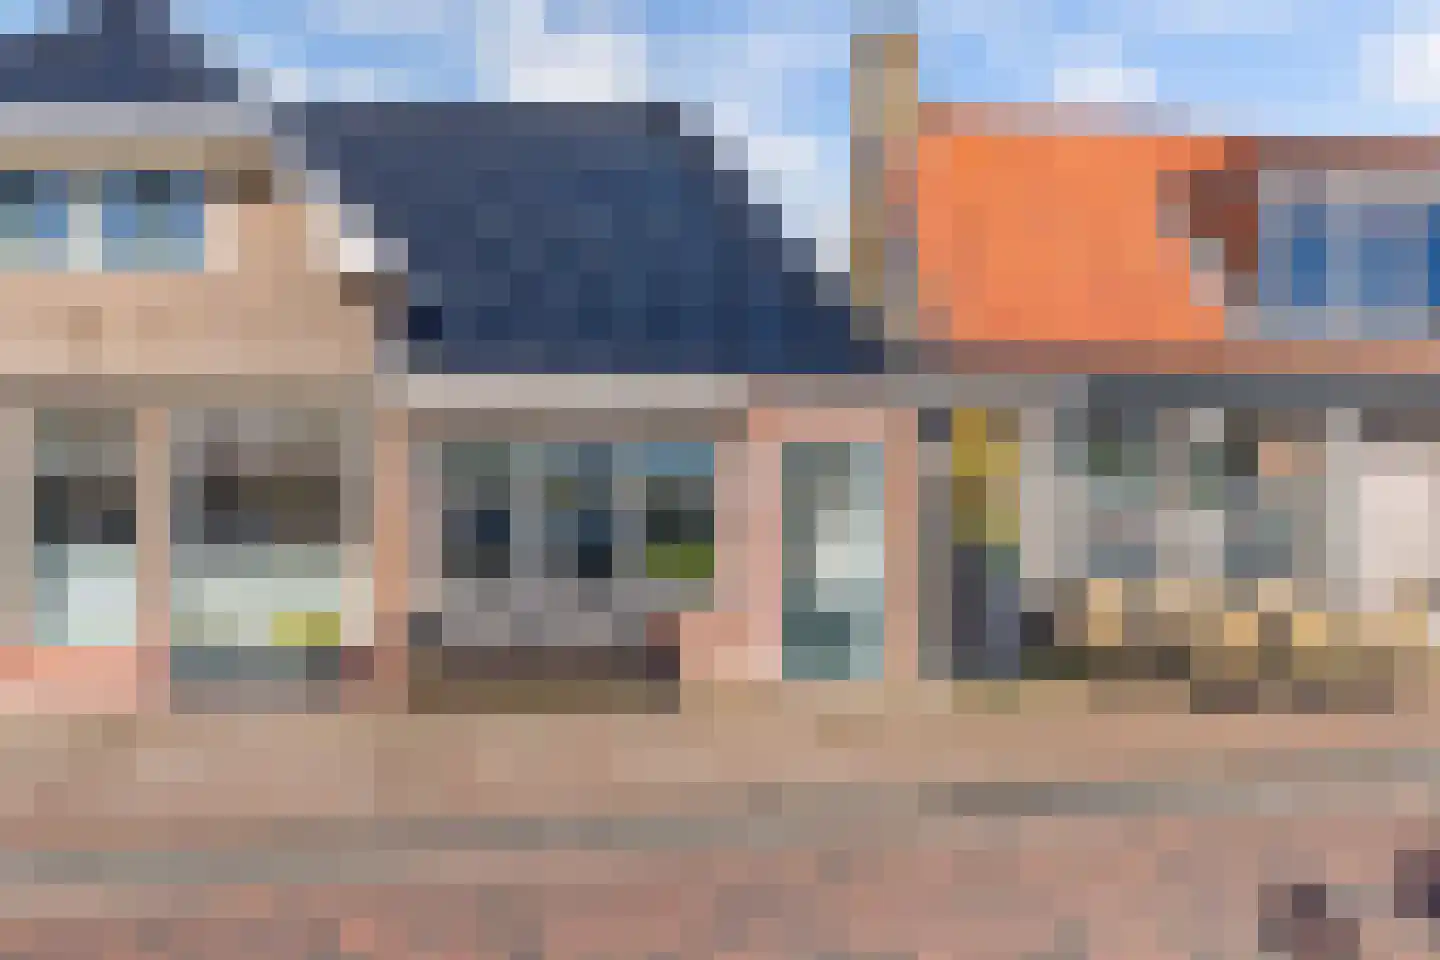
F. Domela Nieuwenhuisstraat 34
8862WD Harlingen
€ 345.000 k.k.
€ 3.255/m²
DSave as favorite- Living area
- 106 m²
- Land area
- 358 m²
- Bedrooms
- 3
-
- Available
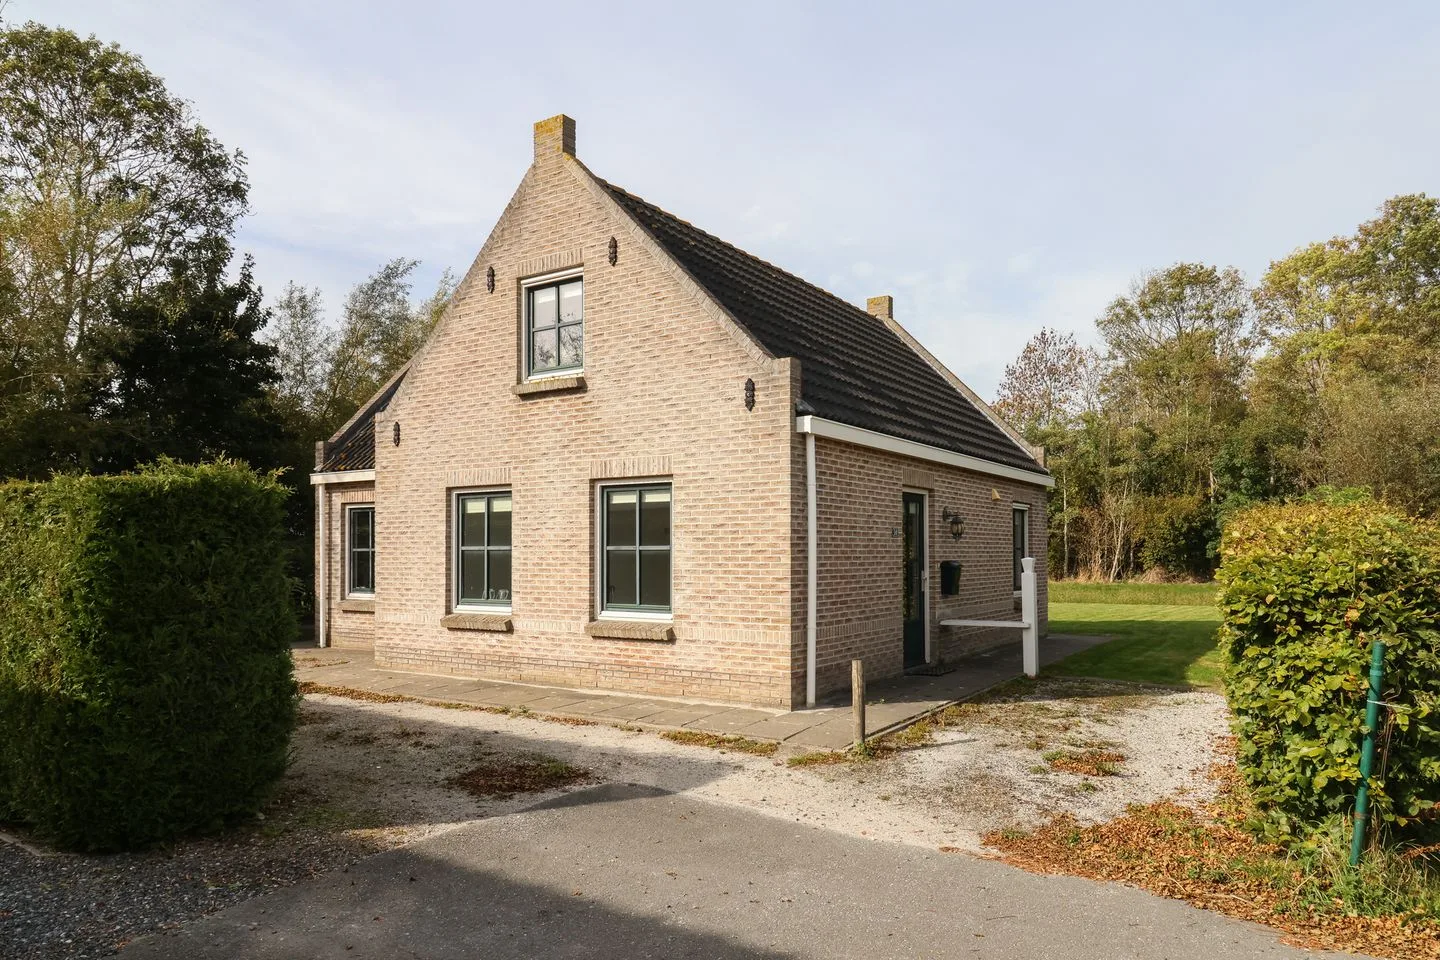
Bargereed 50
8851RB Tzummarum
€ 335.000 k.k.
€ 3.563/m²
BSave as favorite- Living area
- 94 m²
- Land area
- 1076 m²
- Bedrooms
- 4
-
- Available
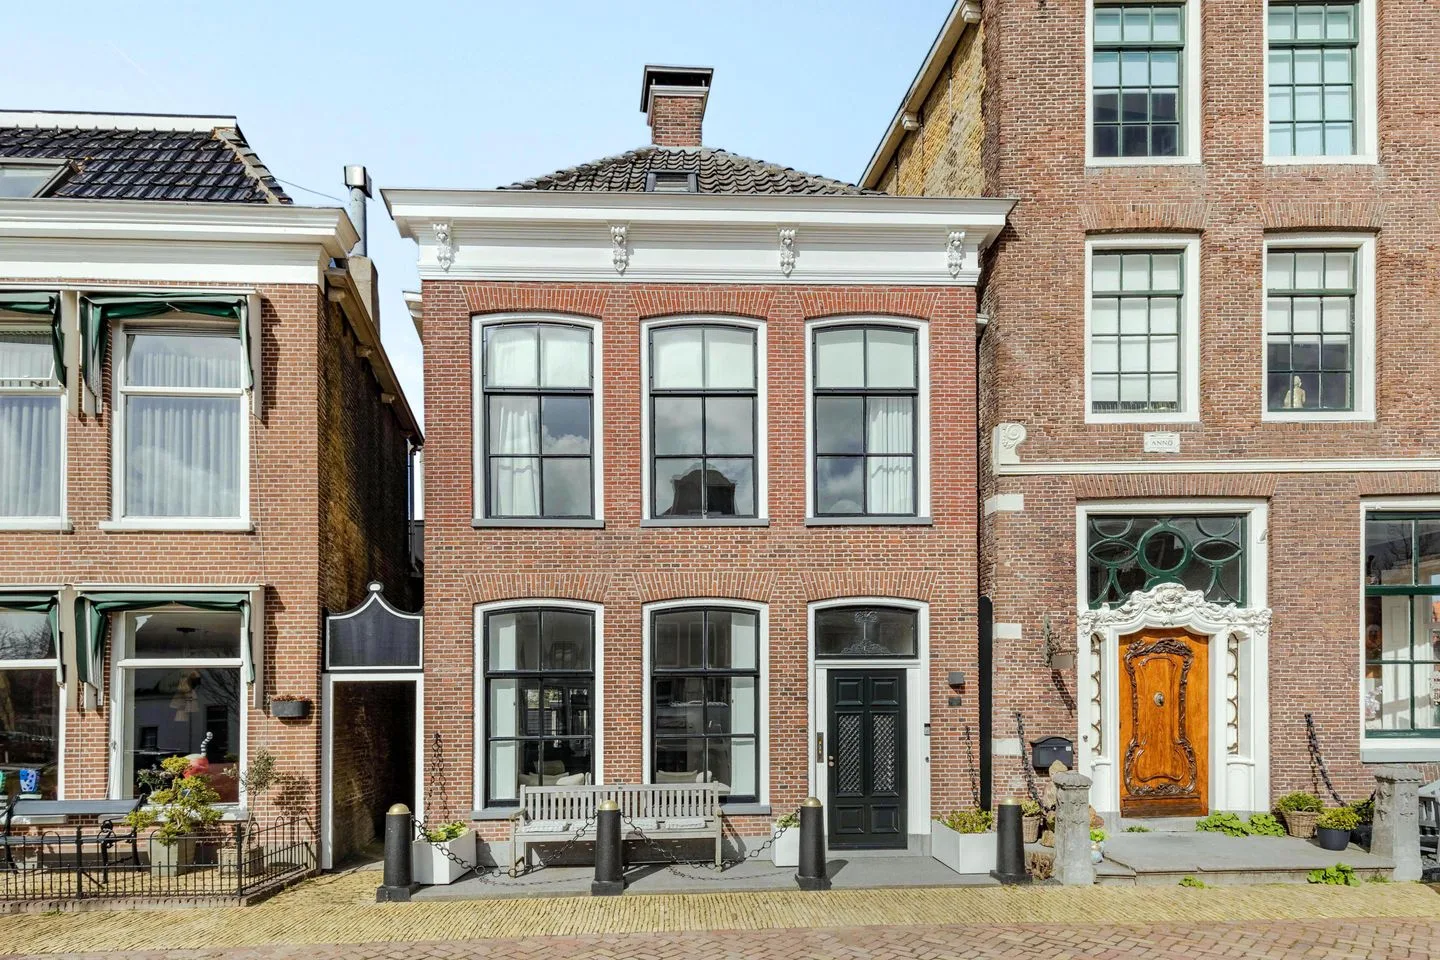
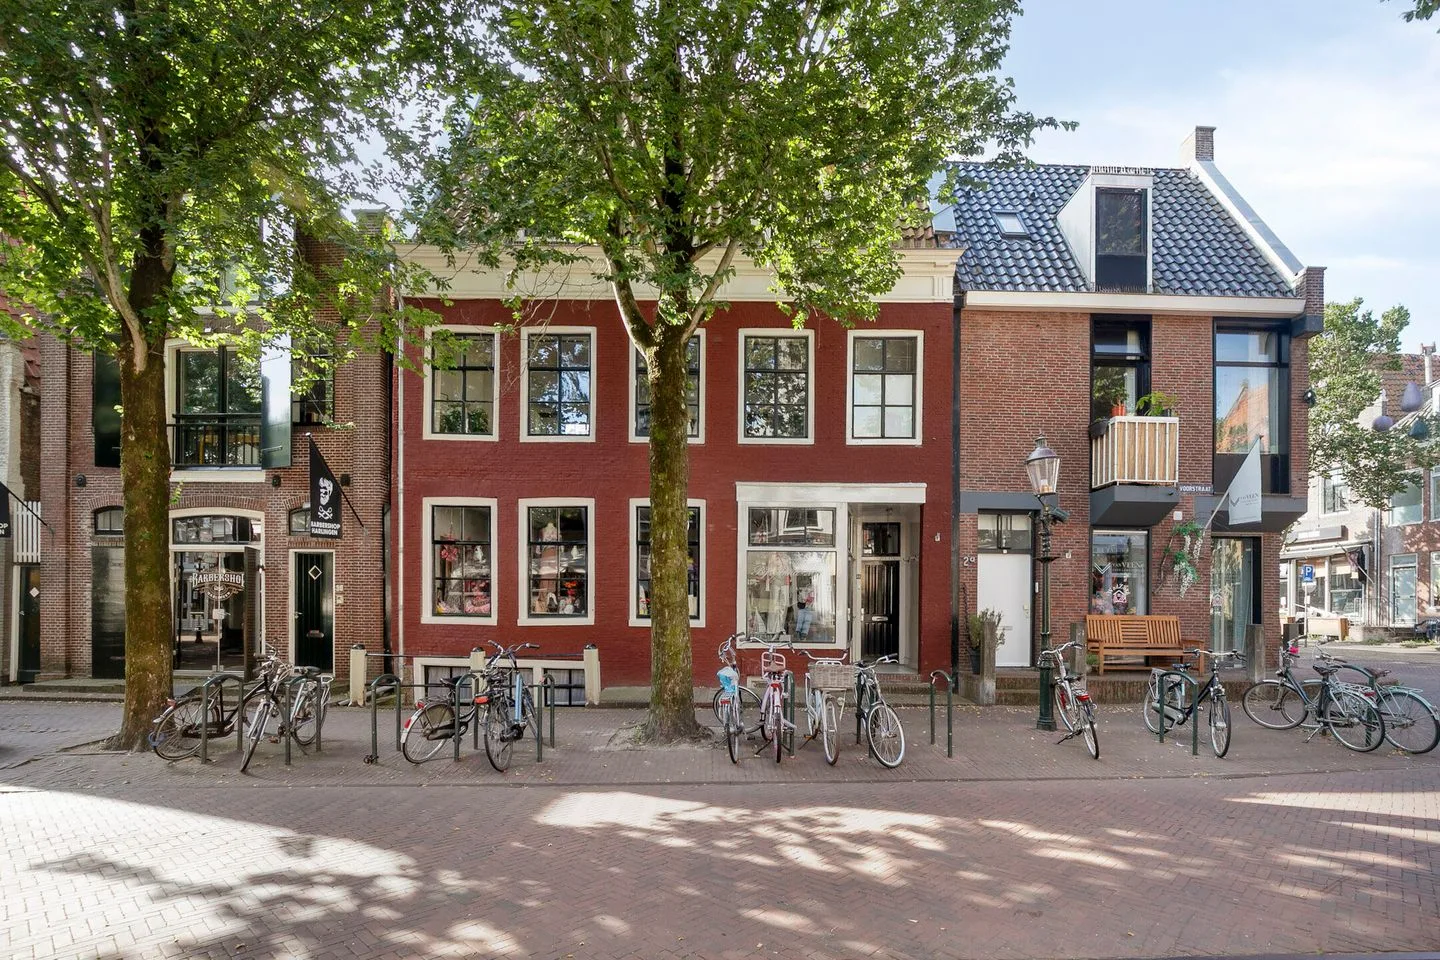
Voorstraat 4 A
8861BK Harlingen
€ 339.500 k.k.
€ 3.031/m²
Save as favorite- Living area
- 112 m²
- Land area
- —
- Bedrooms
- 3
Reviews (60)
Review platforms
BronscoresTotal score
60 total reviews

Funda
31 reviews on Funda

29 reviews on Google
-
Boontjes 4
10Translated by AIIt went great. Good service and good guidance. Friendly and glad that we chose them.
-
Meester Klaas Douwesstraat 12
10Translated by AIThis was the 2nd house he sold for us. He is super friendly and professional. Kept good contact with you and was always available in case something came up. Just top notch.
-
De Fortuin 2
10Raymond is fijn in de omgang , ons huis werd op kerstavond verkocht door omstandigheden. Hij bleef professioneel en beschikbaar , ook voor de aankomende partij. Gewoon goede en betrouwbare makelaar.
-
Molepaed 35
8Translated by AIFine real estate agent who is always reachable. He thinks along and gives good advice. The contact is personal and he works very quickly. Why did I choose him? He calls (or apps) back immediately, is also available on weekends and takes into account your availability and wishes as a customer. So that works really fine. In addition, it is easy to arrange everything digitally via 0517 Makelaars. Raymond is really a top performer, flexible, reliable and he makes good on what he says. So…
-
Antje Schikker
10Translated by AIVery nice real estate agent.....very good/pleasant guidance.....everything top organized....always reachable for questions
-
Monique Soares
10Translated by AIExtremely satisfied with 0517 Makelaar, both when buying and selling our house. Raymond was always available, we could approach him with all our questions. In addition, he actively thought along with us, which not only gave confidence but also ensured a pleasant and smooth process. Definitely a recommendation!
-
Barend Visserstraat 3
10Translated by AIVery satisfied with our real estate agent 0517 real estate agents very good and pleasant guidance and responds quickly to my questions.
-
De Velduil 41
10Translated by AIIn my opinion, this is the best real estate agent in Harlingen and surrounding areas. He was always on time, kept to the appointments and had creative solutions given the number of parties (32!) who wanted to view it.
-
Botterweg 14
10Translated by AIA good real estate agent with market knowledge. Very satisfied with the sale of our house. Would recommend this real estate agent.
-
Joost van den Vondelstraat 4
9Translated by AIGood real estate agent with local knowledge. Sold my house within 5 days. Good communication and he worked well with us.
-
Marnehiem 37
10Translated by AIIt went excellent, pleasant way of collaborating and he was very clear and transparent, so great
-
Noorderbolwerk 23
10Translated by AICommunication with the real estate agent went smoothly and effortlessly. We were kept informed about the status in between, which was very nice. The property sold quickly, so we are also very happy!
-
Van der Bildtstraat 34
10Translated by AIFast sale of our house, pleasant and good communication. Always available for any questions or uncertainties, all in all very satisfied with 0517 Realtors.
-
Noorderbleek 7
10Translated by AIVery pleasant contact. Accessible and professional. The real estate agent listened carefully to our wishes and helped us realize them.
-
Patrimoniumstraat 17
10Translated by AIDue to the enthusiasm of the real estate agent, we gained a lot of confidence in the sales process. Actions were taken quickly, which meant our house came onto the market swiftly. He was easily accessible to answer all our questions. All in all very satisfied.
-
Rozengracht 35
9Translated by AIA clear, pleasant realtor Keeps his appointments Delivers requested and unrequested all the correct information We are very satisfied with the collaboration with Raymond van der Heide of Makelaardij Harlingen
-
Rode Hert Studio
10Translated by AIRaymond van der Heide provided excellent guidance and support during the sale of our house in Midlum. Pleasant communication and very accommodating. Highly recommended!
-
Jelle Althuis
10Translated by AIGood service, I sold my property through Harlingen Real Estate Agency and it was sold very quickly. My new home also purchased through Harlingen Real Estate Agency - this was a fantastic experience!
-
Oostmeep 27
10Translated by AIRaymon is a kind and pleasant realtor. He thinks along with you and provides good help. We have never experienced such a pleasant realtor.
-
Tjerk Hiddesstrjitte 4C-4D 0 ong
9Translated by AIExpert advice and quickly found potential buyers and closed deals. Smooth communication and everything arranged quickly for the transfer.