Mark Makelaardij
Mark Makelaardij is a young real estate agent in the region that chooses a different approach. Instead of following the old pattern, we choose a personal and transparent way of working. We emphasize trust, direct communication and a clear approach. With years of experience in the housing sector, Mark is ready for you to take your wishes seriously and set the right course. Mark knows the people in the region, and the people know him. He...
Current housing stock
-

- Available
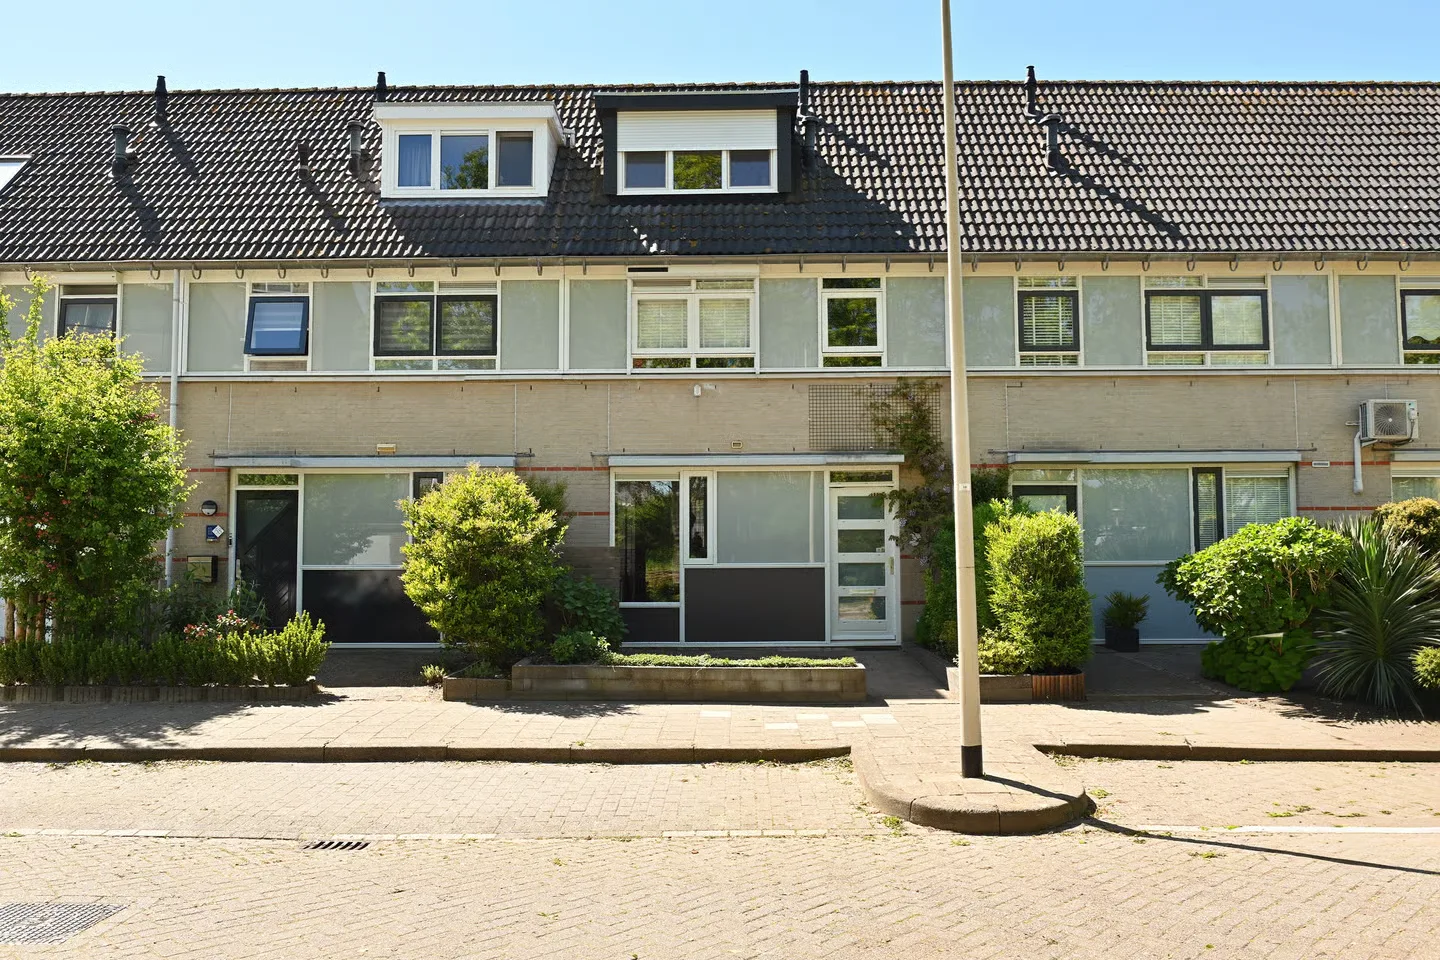
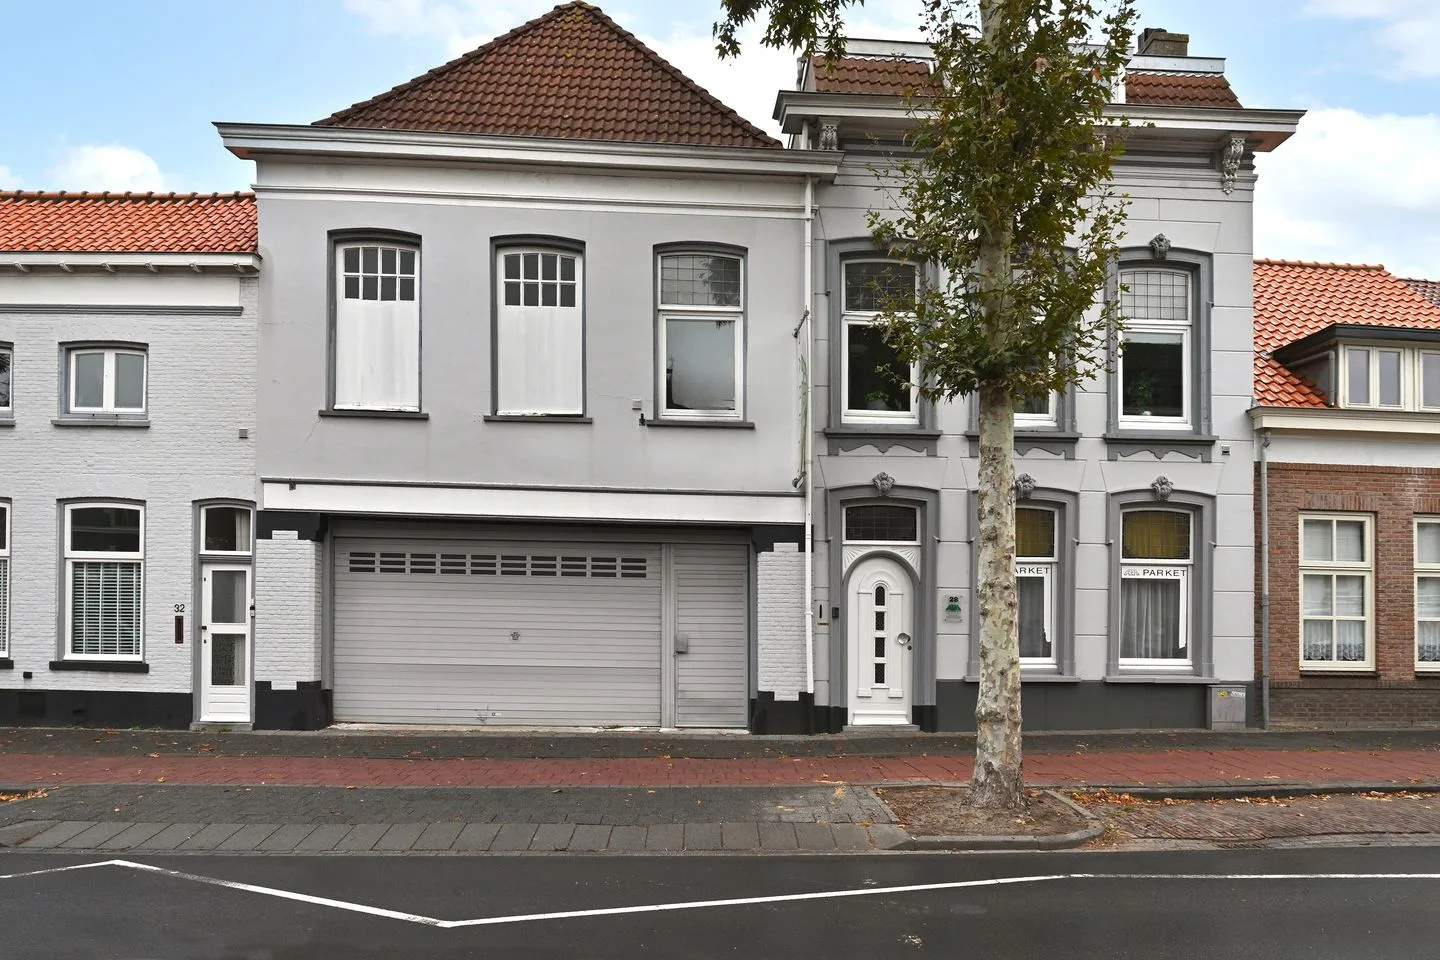
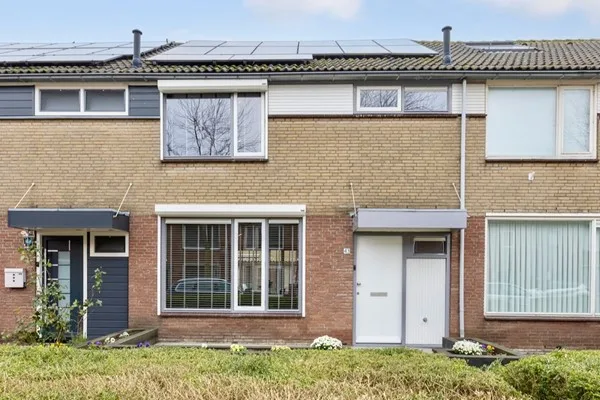
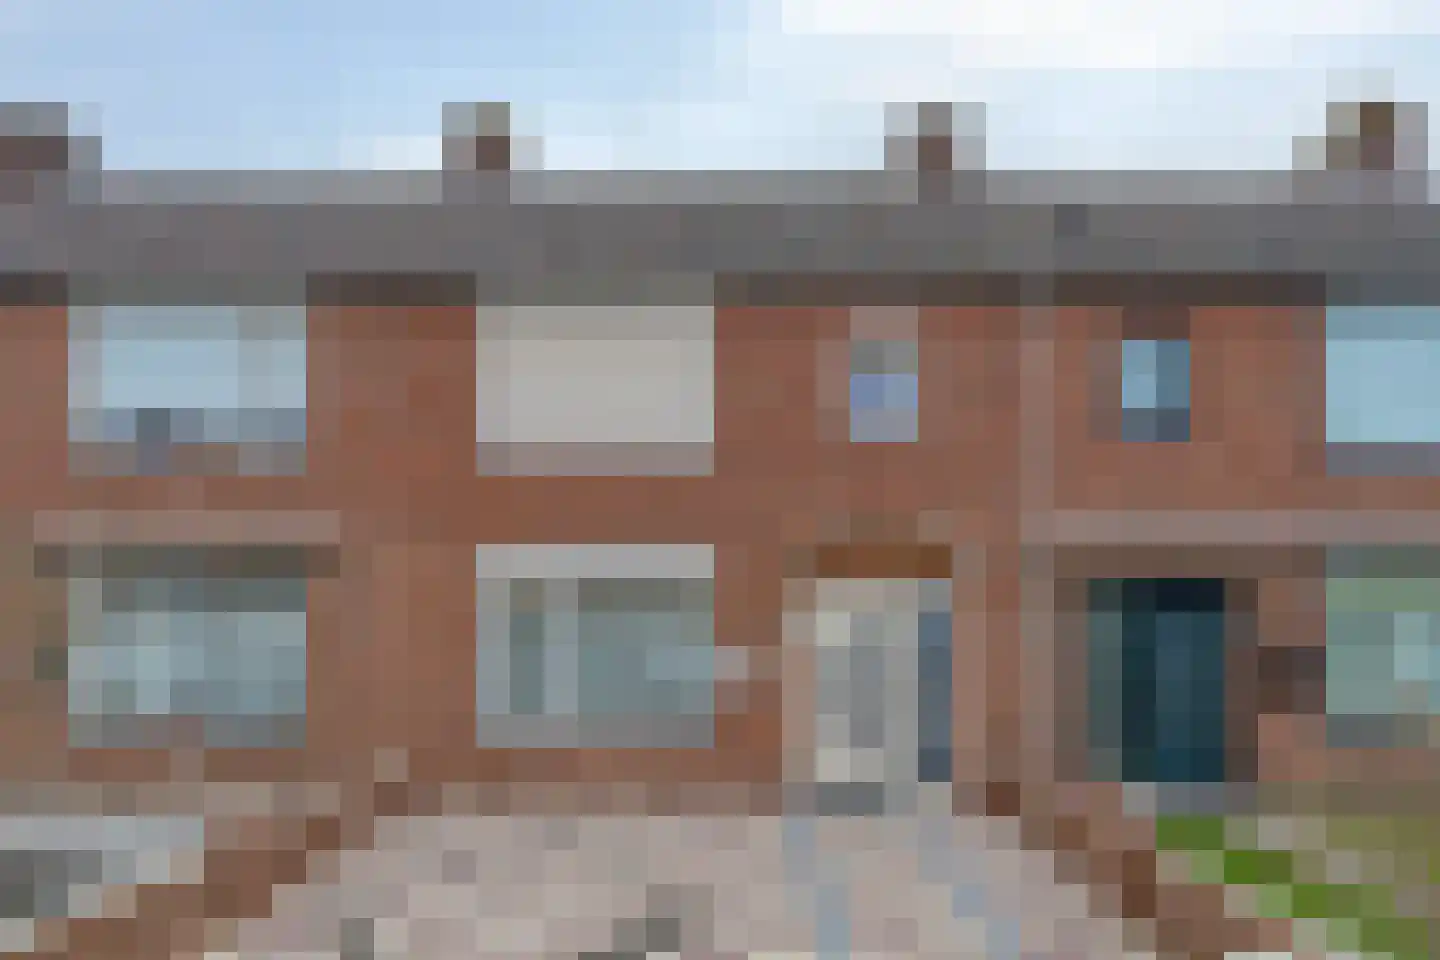
Schoolstraat 22
4697CL Sint-Annaland
€ 385.000 k.k.
€ 4.425/m²
CSave as favorite- Living area
- 87 m²
- Land area
- 340 m²
- Bedrooms
- 3
-

- Available
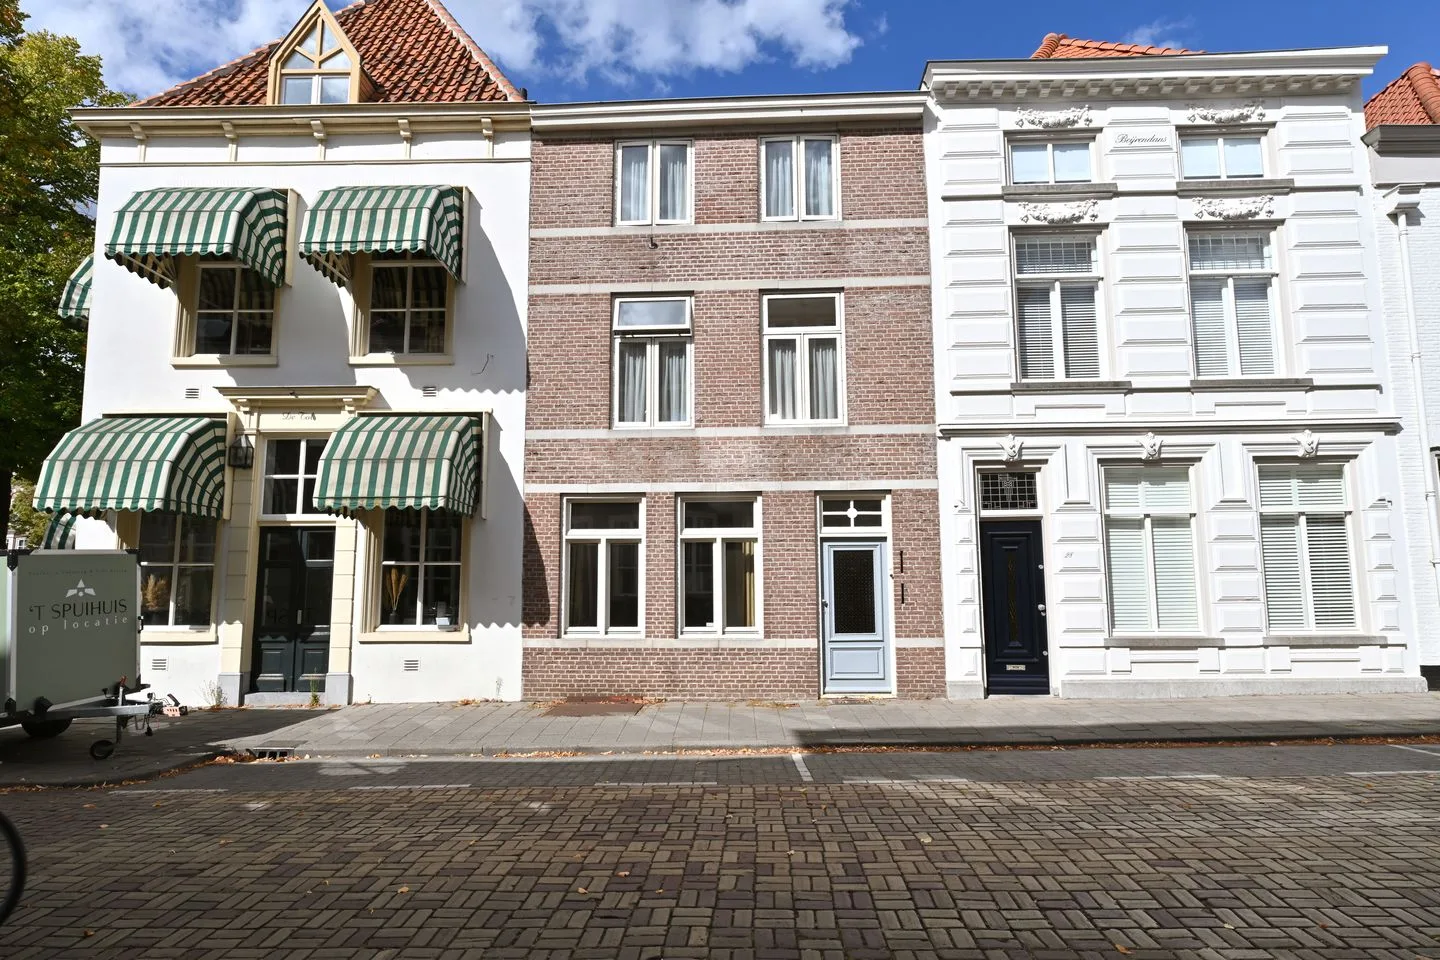
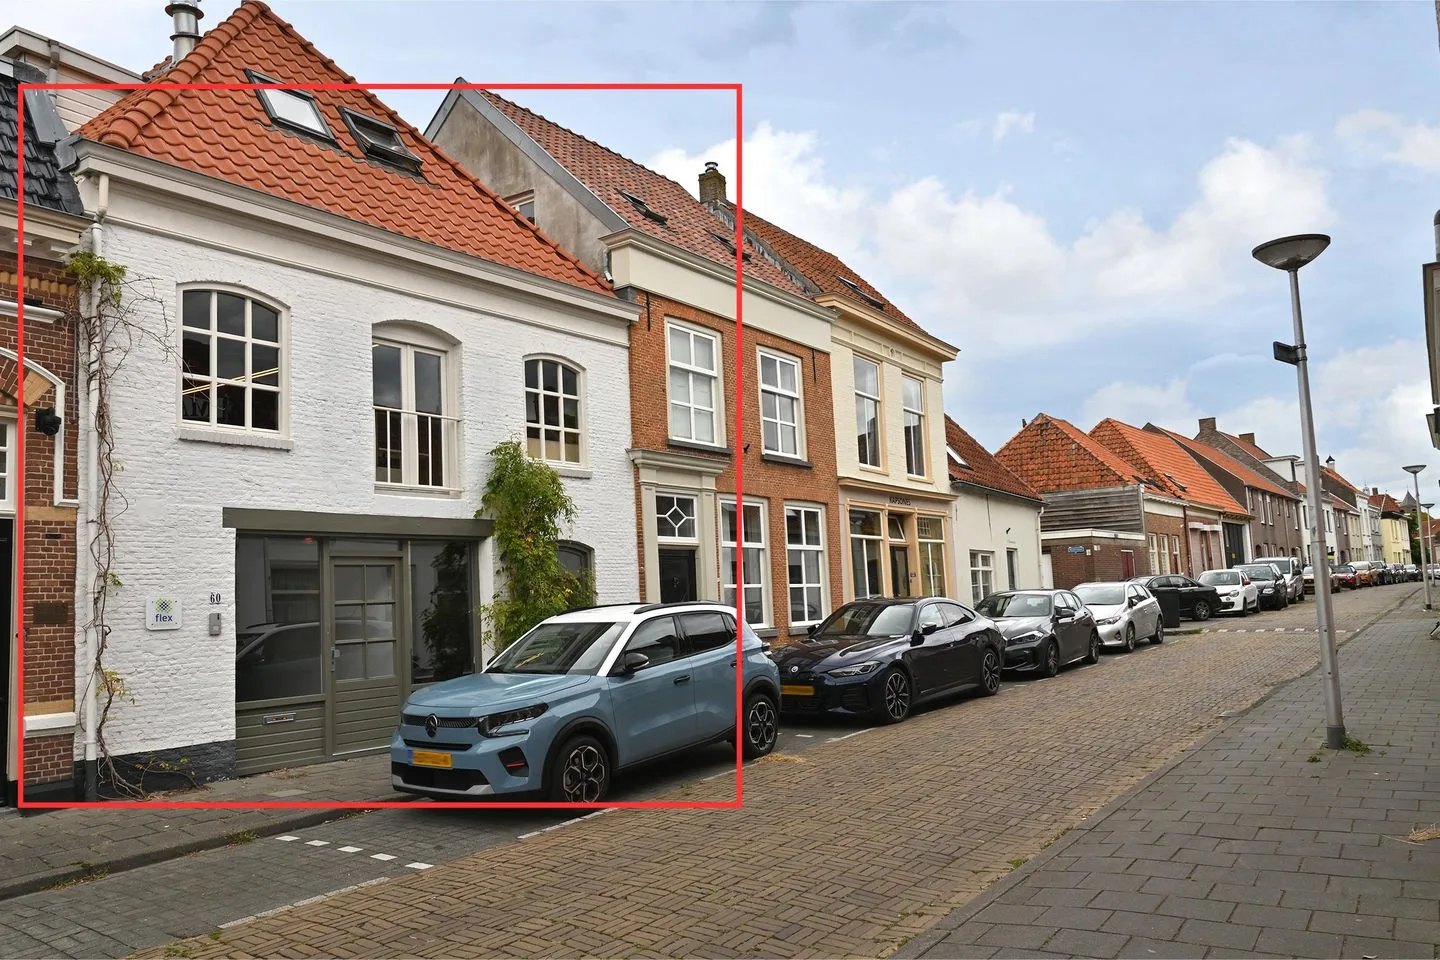
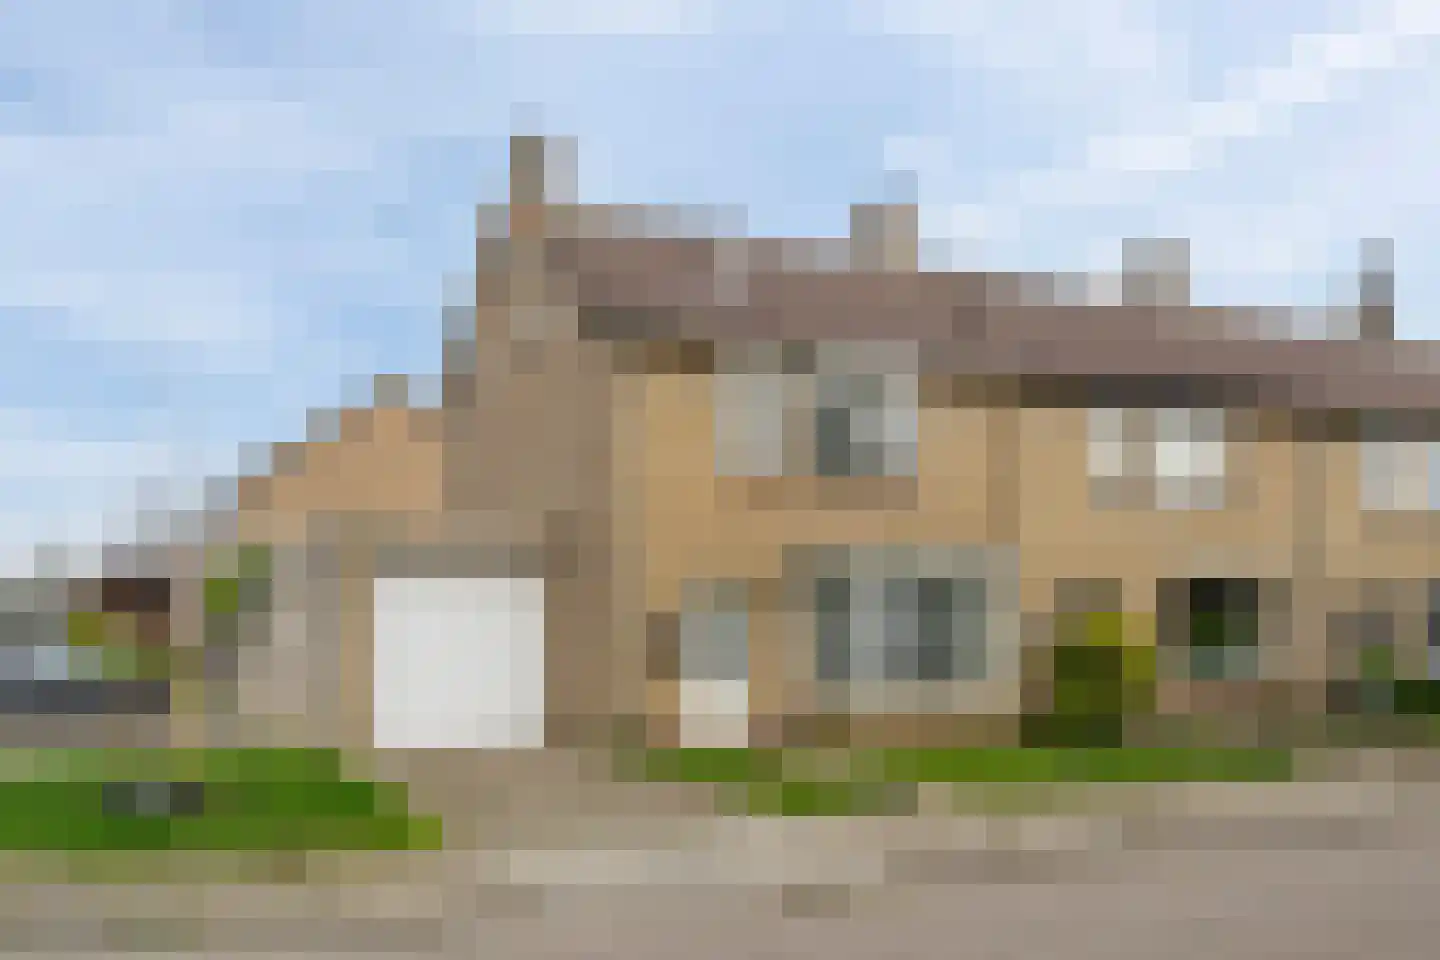
Brugstraat 31
4691EB Tholen
€ 445.000 k.k.
CSave as favorite- Living area
- 164 m²
- Land area
- 260 m²
- Bedrooms
- 3
-

- Available
Heermanstraat 8
4698DA Oud-Vossemeer
€ 487.500 k.k.
A+++Save as favorite- Living area
- 135 m²
- Land area
- 218 m²
- Bedrooms
- 3
-
- Available
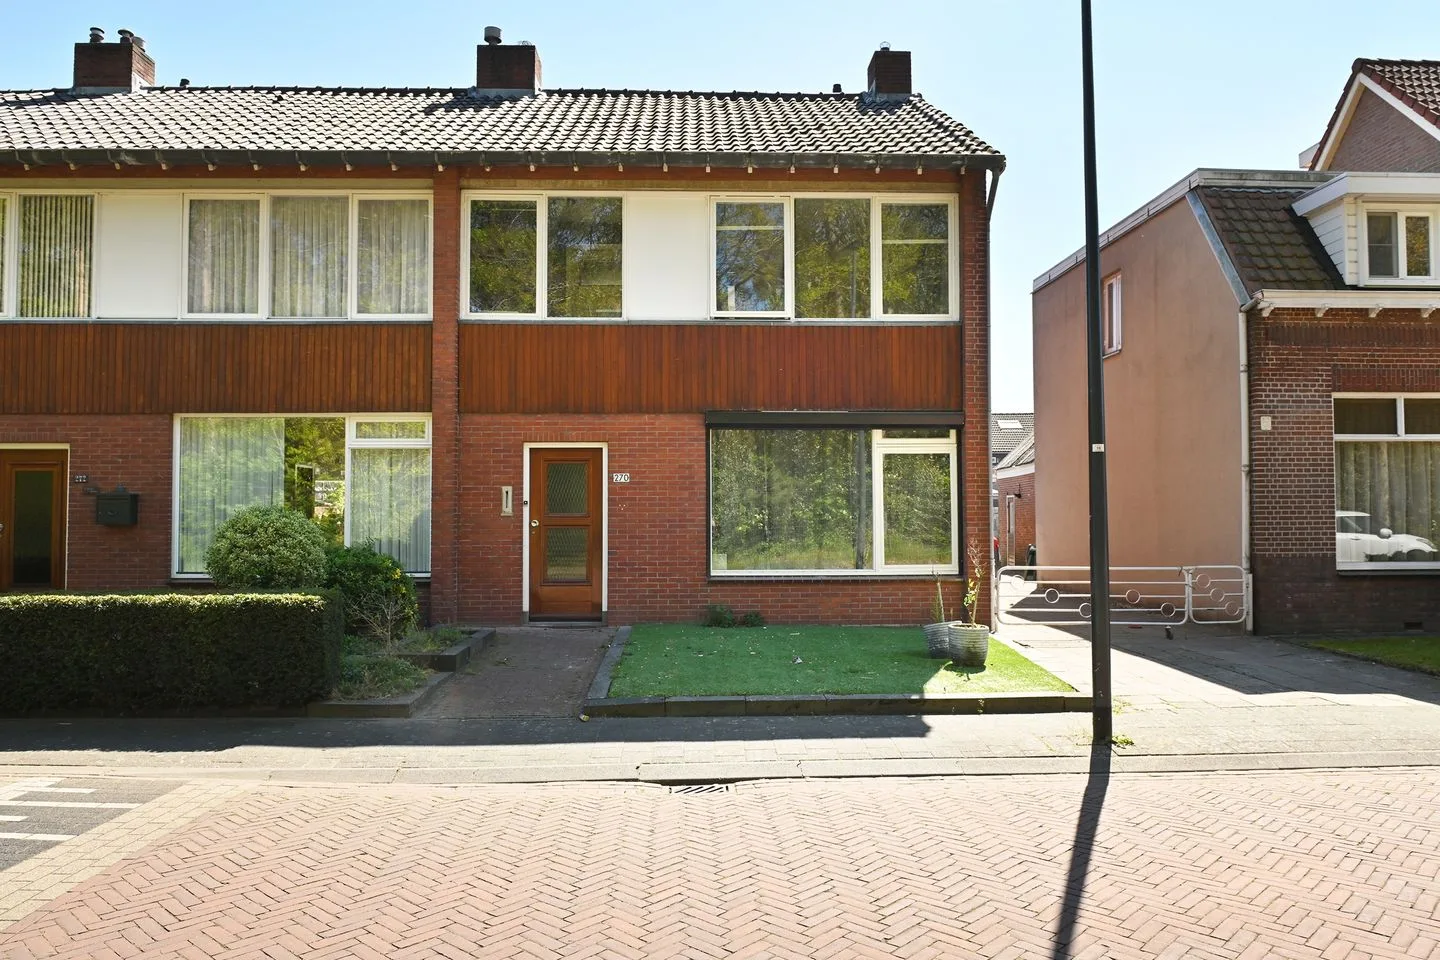
Dokter Renesstraat 34
4698CD Oud-Vossemeer
€ 393.000 k.k.
€ 3.541/m²
ESave as favorite- Living area
- 111 m²
- Land area
- 223 m²
- Bedrooms
- 3
-

- Available
Oostdijk 23
4675CD Sint Philipsland
€ 285.000 k.k.
€ 3.476/m²
CSave as favorite- Living area
- 82 m²
- Land area
- 150 m²
- Bedrooms
- 2
-

- Available
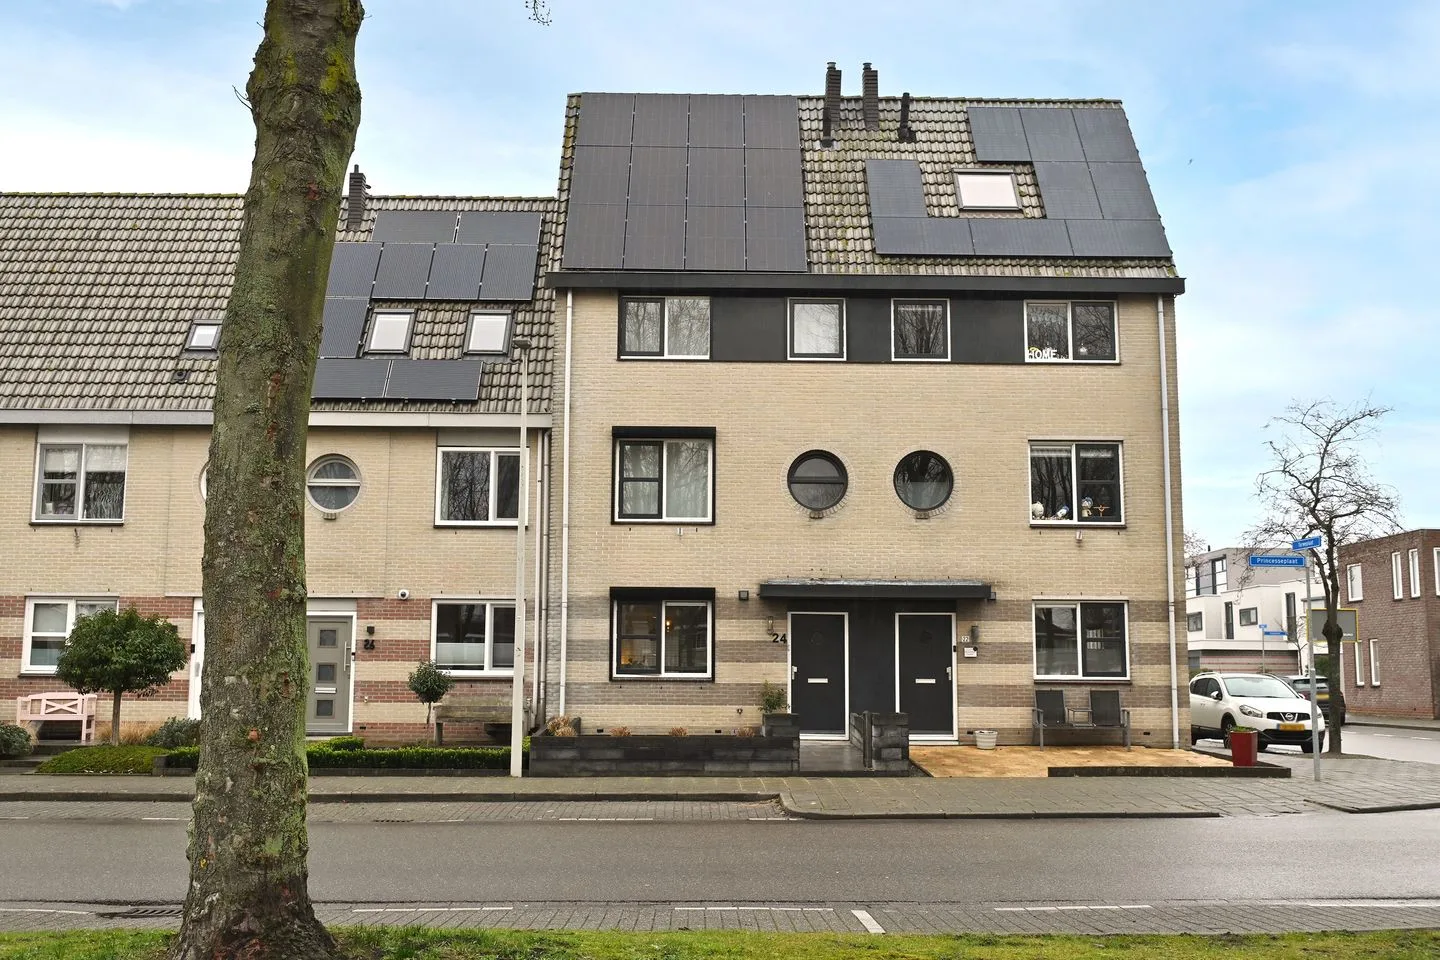
Bastion 13
4691ER Tholen
€ 519.500 k.k.
€ 3.510/m²
ASave as favorite- Living area
- 148 m²
- Land area
- —
- Bedrooms
- 4
Reviews (131)
Review platforms
BronscoresTotal score
131 total reviews

Funda
102 reviews on Funda

29 reviews on Google
-
Zijpestraat 8
9Het contact met mark makelaardij verliep altijd goed en snel. Hadden we een vraag, dan reageerden ze hier snel op.
-
Frank van Borselenstraat 34
10Translated by AIVery nice and competent real estate agent, went through everything well with us. The sale went smoothly, and we were kept well informed.
-
Vossemeersepoort 26
8Translated by AIWe have experienced the cooperation with this real estate agent as very pleasant and professional. From the first moment of contact, there was open, clear and honest communication. The real estate agent took the time to fully understand our wishes and actively thought along with us, which created trust and calm throughout the entire process. What was especially noticeable is the good market knowledge. The real estate agent was able to realistically assess the situation and has met our expectations in a pleasant and clear manner…
-
Admiraal de Ruyterweg 13
10Translated by AIFor the 3rd time, our home has been sold through Mark Real Estate! Very fast and transparent communication. Think with us and are experts. Our home was sold within 2 weeks, Mark and his friendly team deserve a thick 10 +
-
Dominiek De Smit
10Translated by AIPrettige ervaring with this real estate agent and their employees. After a long search for a house, we finally got back on track thanks to the dedication and involvement of this real estate agent. Leendert has been very helpful for us, and the overall experience with their service has pleased us greatly. In this tight housing market, they know how to find the way. Our gratitude is great and we are happy with people like them. :-)
-
Meanderlaan 214
10Translated by AIWhat a great involved real estate agent. Also when we were not yet any customers, but still thought along in the search for another house. And ultimately the sale of our house was superbly arranged by a very nice team.
-
Kerkstraat 64
10Translated by AIVery friendly, honest and helpful. All our questions were perfectly answered and Arie was even reachable via the app on a Sunday. Really a top real estate office with very knowledgeable people.
-
Burgemeester Bouwensestraat 54
10Translated by AIGood advice, smooth processing. Calls back quickly. Also handy that a group app is created via WhatsApp.
-
Noordstraat 19
9Translated by AIGreat contact with Mark, short lines and everything is negotiable. In a very short time we can sell our house well!
-
Westkerkseweg 53
10Translated by AIEverything went very quickly and when I look back, I am very glad that I had a professional real estate agent by my side. Helped with everything I asked for. Thanks MARK !!!
-
Oesterstraat 50
9Translated by AIVery pleasant and professional contact. All questions were quickly responded to and considered. Nice cooperation!
-
Wal 35
9Translated by AIGood local market knowledge, prime expertise, service and guidance were good, price/quality is ok
-
Schoolstraat 10
9Translated by AIThe contact with the real estate agent proceeded entirely according to expectations. Mark Real Estate is expert and customer-friendly.
-
Oude Werf 72
10Translated by AIIt went all top.. Within 1 week there was contact with the buyer who ultimately bought. The presentation was perfect.
-
Oude Werf 14
10Translated by AINo regrets about the cooperation. Smooth and considerate. Fast sales. Contact and availability perfect
-
Ilonka Esser
10Translated by AIA really nice experience with Mark Makelaardij. Knows what he's talking about. The staff are also very friendly. If there are any questions, they respond quickly. Think with you. Big plume for Mark and his team. Thank you all.
-
Langestraat 28
10Translated by AIWe are very satisfied with Mark Makelaardij. Good real estate agent, good business sense, nice team who kept us well informed and friendly. really nice to recommend.
-
Schoolstraat 7 a
9Translated by AIContact is very good, business sense. When questions arise, they are quick with their answers and are also reachable after office hours for questions.
-
Prinses Beatrixstraat 11
10Translated by AIReally a top real estate agent! Everything went very smoothly and as desired. Our house was sold so quickly! If we move again, we know where to knock :)
-
Voorstraat 6
8Translated by AISmoothly processed procedure. Next steps well taken over. Sold directly after listing on funda. Settlement with buyer is well handled.