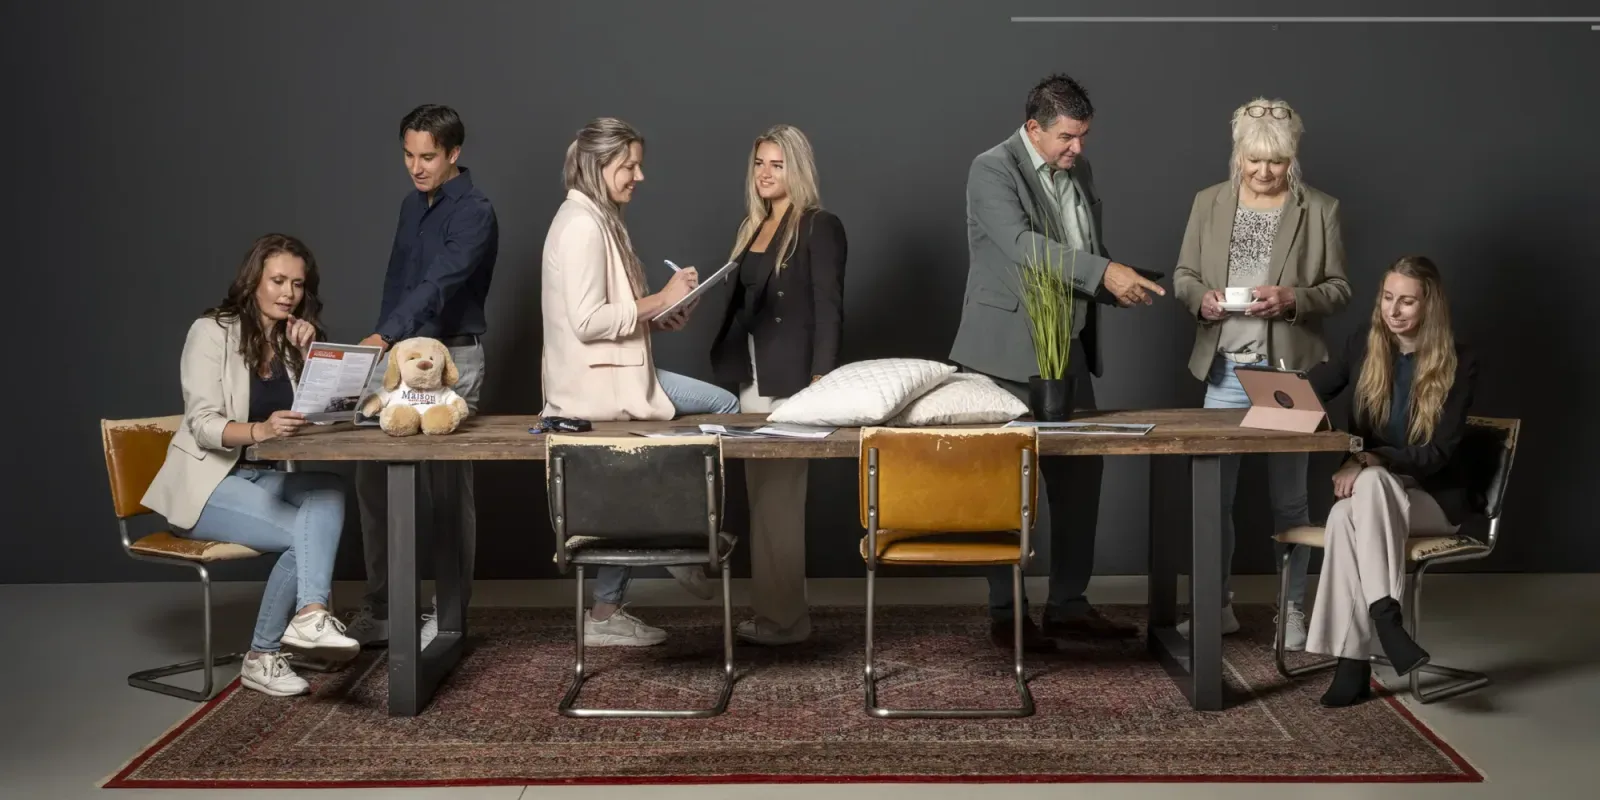

Homevision Makelaardij staat voor persoonlijk advies en een uitgebreid aanbod in de regio Roermond, Weert, Venlo en omgeving. Wij combineren woning- en bedrijfsmakelaardij met taxaties, hypotheekadviezen en marktanalyse. Onze klanten staan centraal, met een aanpak die aansluit bij hun individuele wensen en doelen. Of u nu op zoek bent naar een nieuw huis, wilt verkopen of investeren in vastgoed: wij bieden de juiste ondersteuning. Met e...
Current housing stock
-

- Available
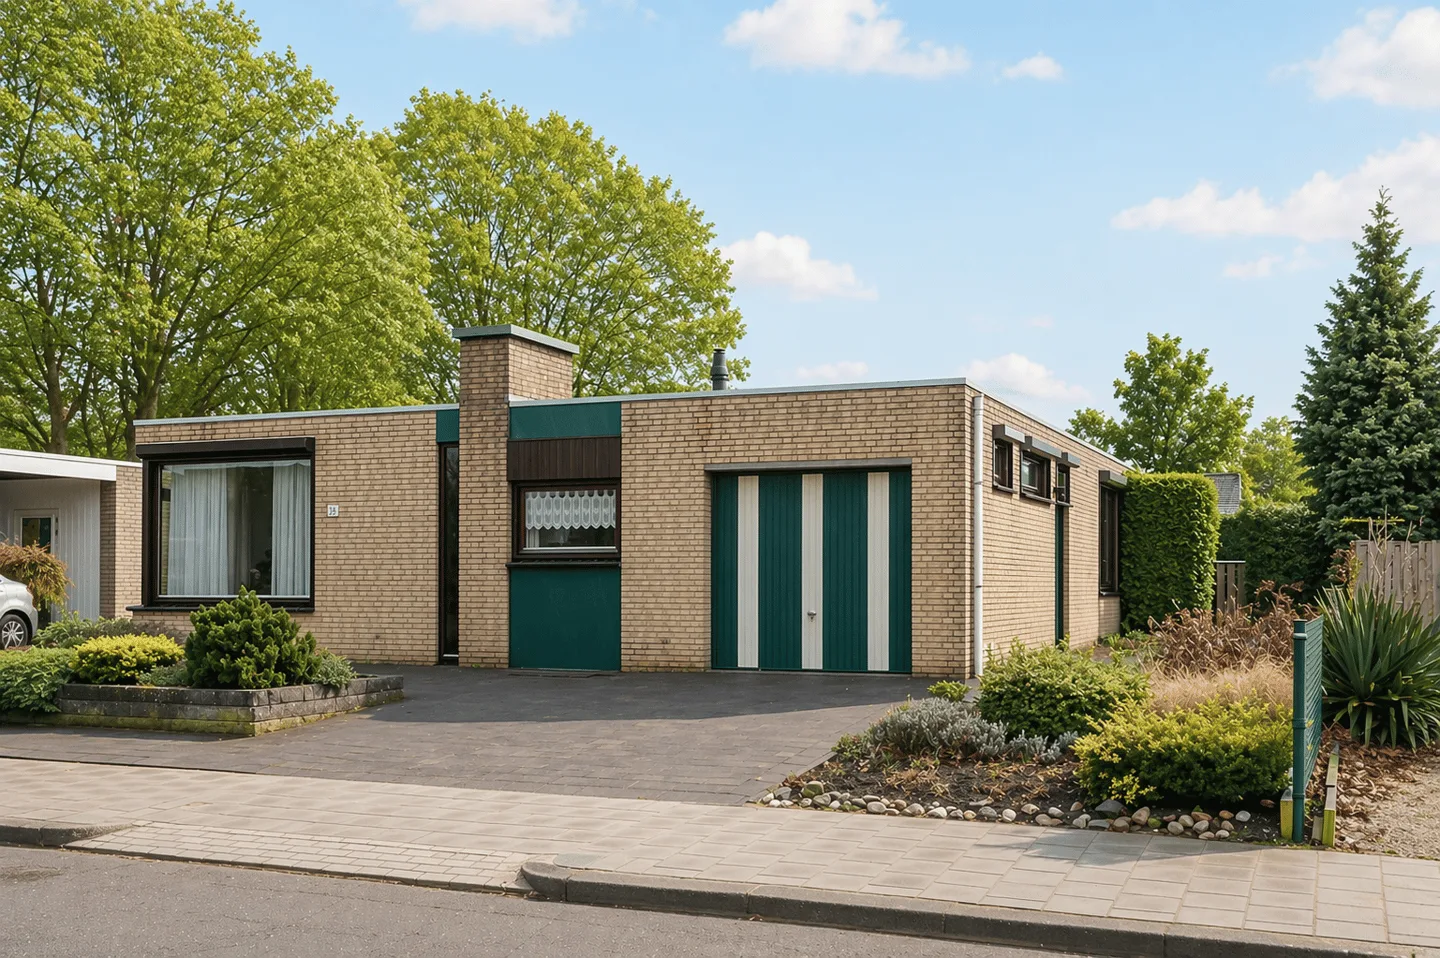
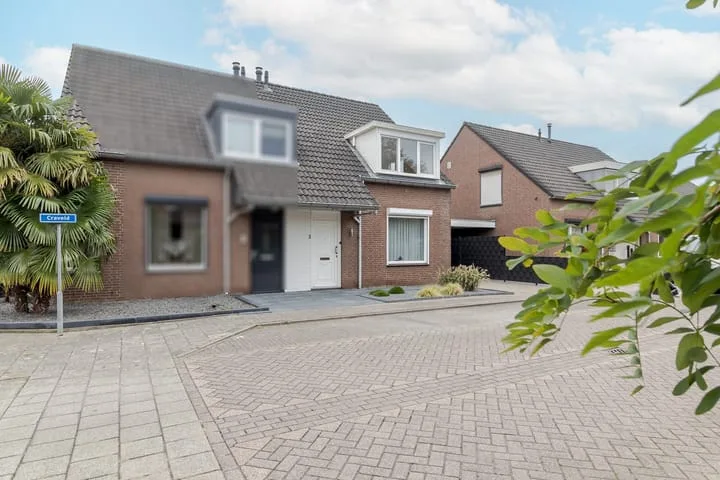
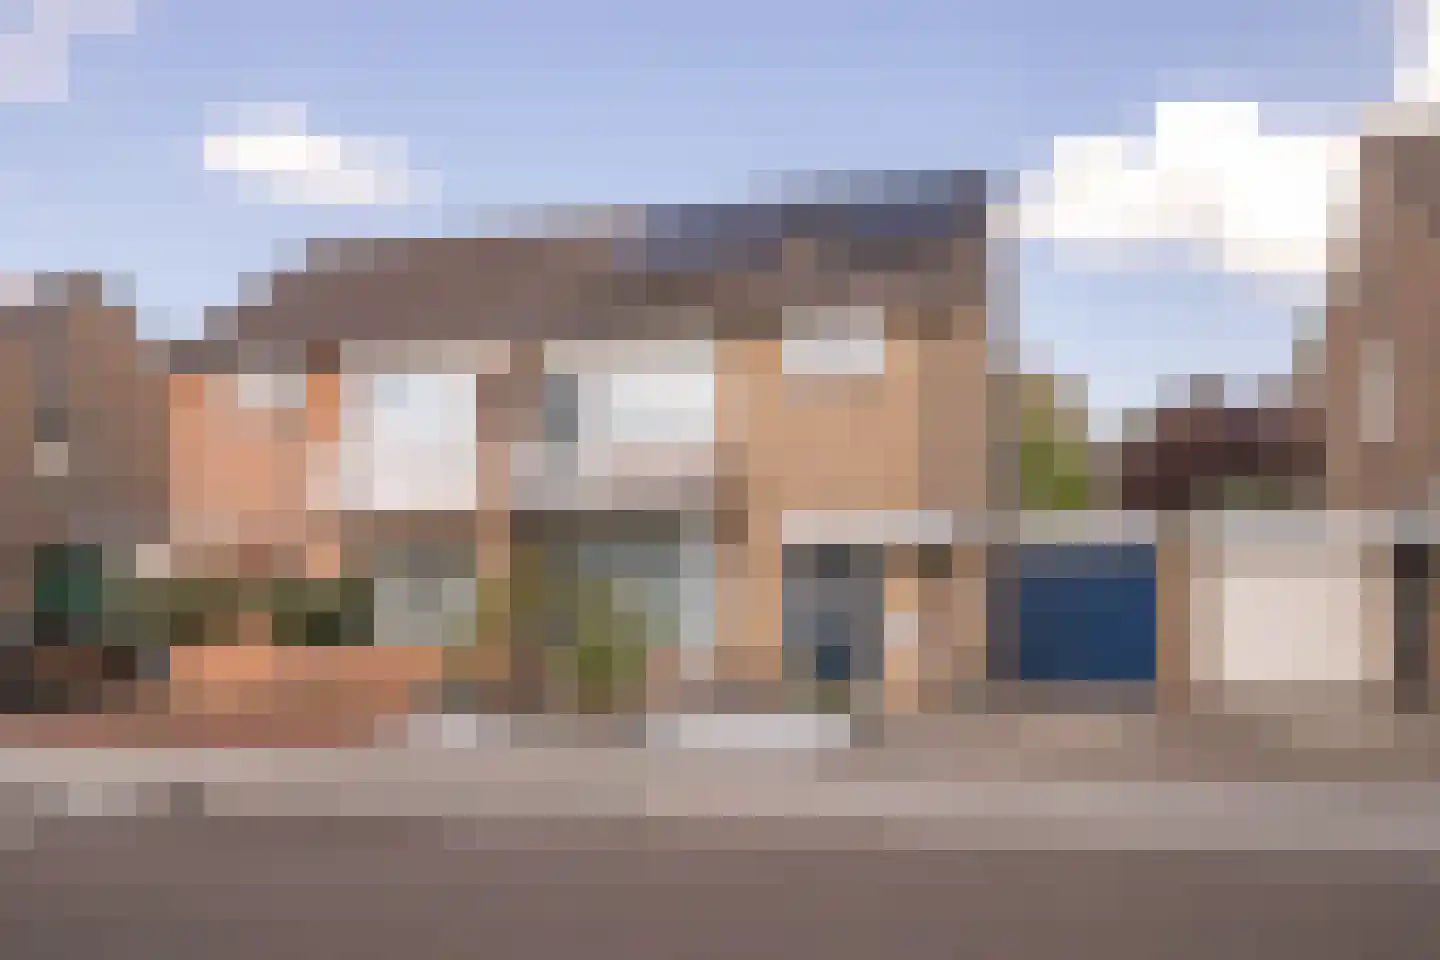
Boshoverweg 5
6002AL Weert
€ 339.000 k.k.
€ 5.381/m²
GSave as favorite- Living area
- 63 m²
- Land area
- 589 m²
- Bedrooms
- 3
-

- Available
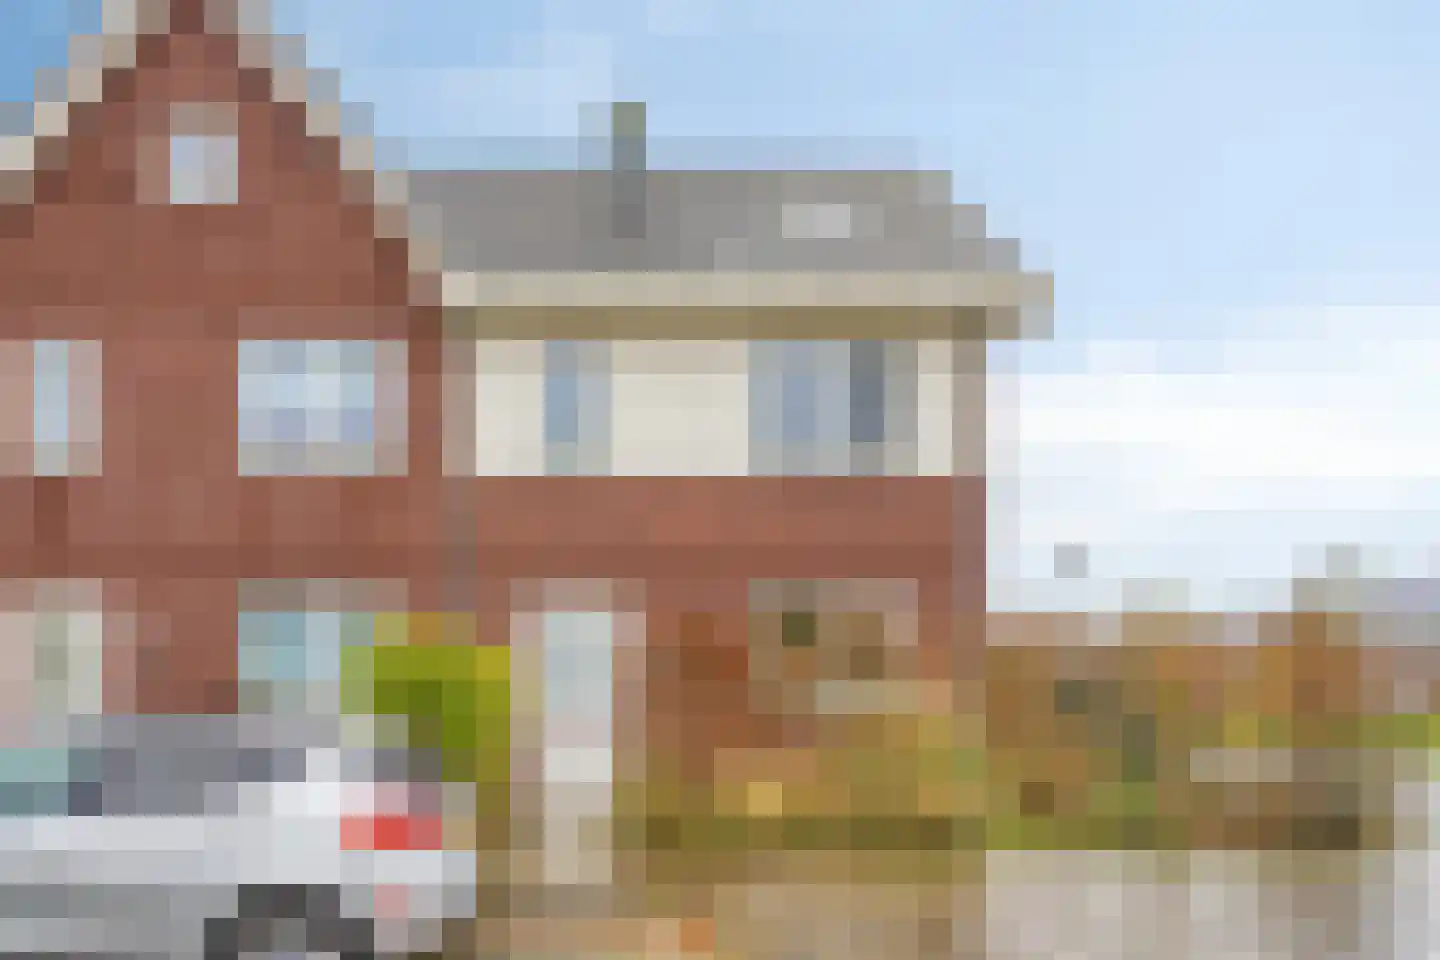
Zwembadweg 2 B165
6061EZ Posterholt
€ 179.900 k.k.
CSave as favorite- Living area
- 78 m²
- Land area
- 547 m²
- Bedrooms
- 3
-

- Available
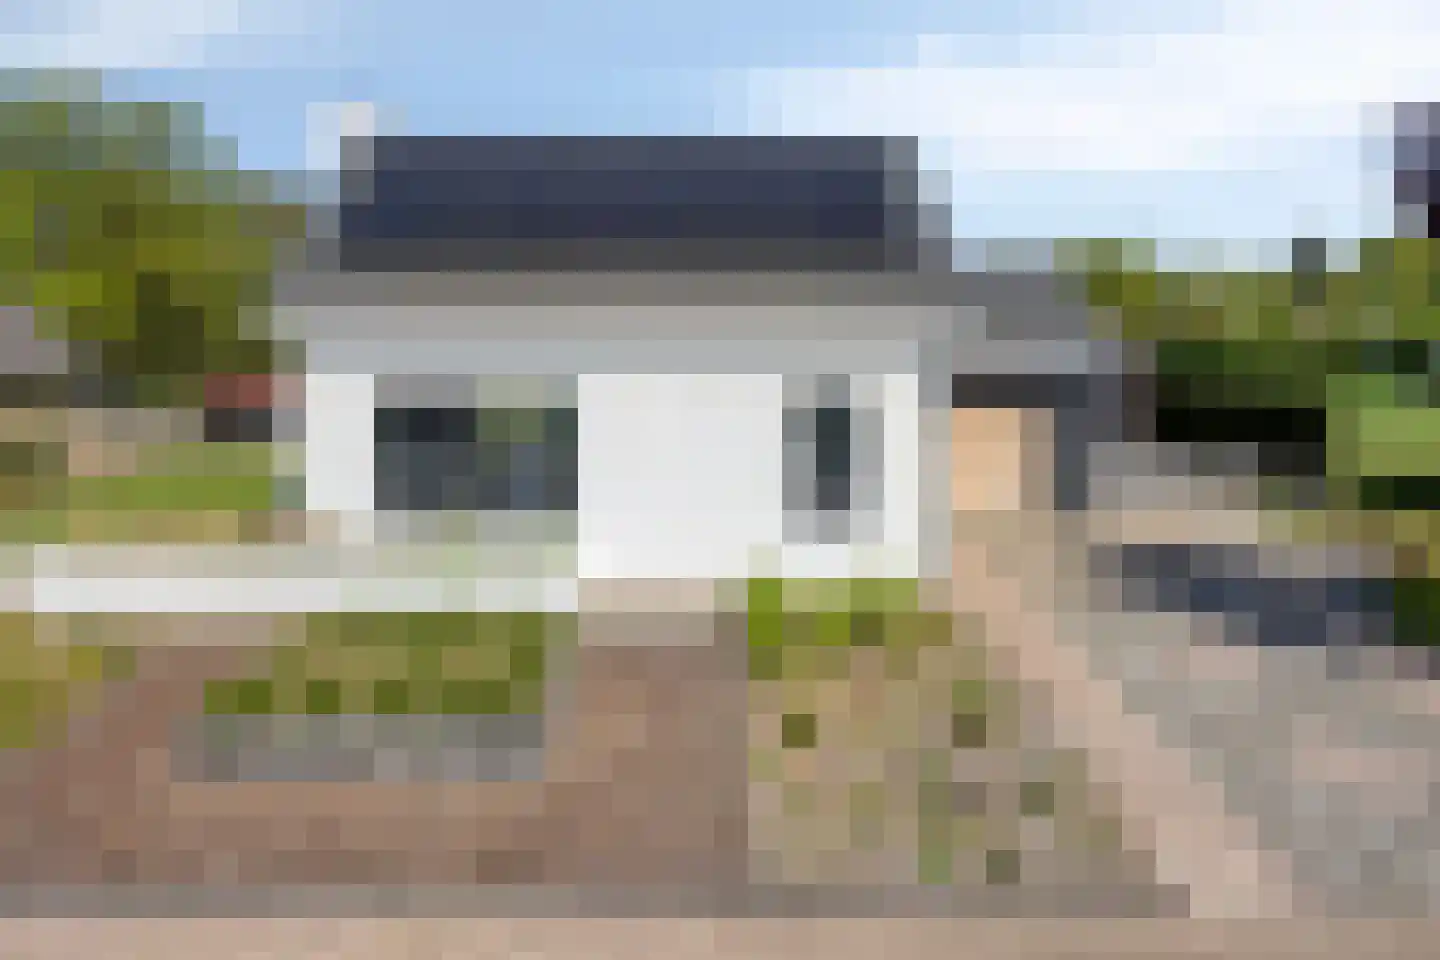
Zwembadweg 2 BG6
6061EZ Posterholt
€ 95.000 k.k.
CSave as favorite- Living area
- 46 m²
- Land area
- 140 m²
- Bedrooms
- 3
-

- Available
Zwembadweg 2 W 114
6061EZ Posterholt
€ 169.000 k.k.
CSave as favorite- Living area
- 69 m²
- Land area
- 428 m²
- Bedrooms
- 2
-

- Available
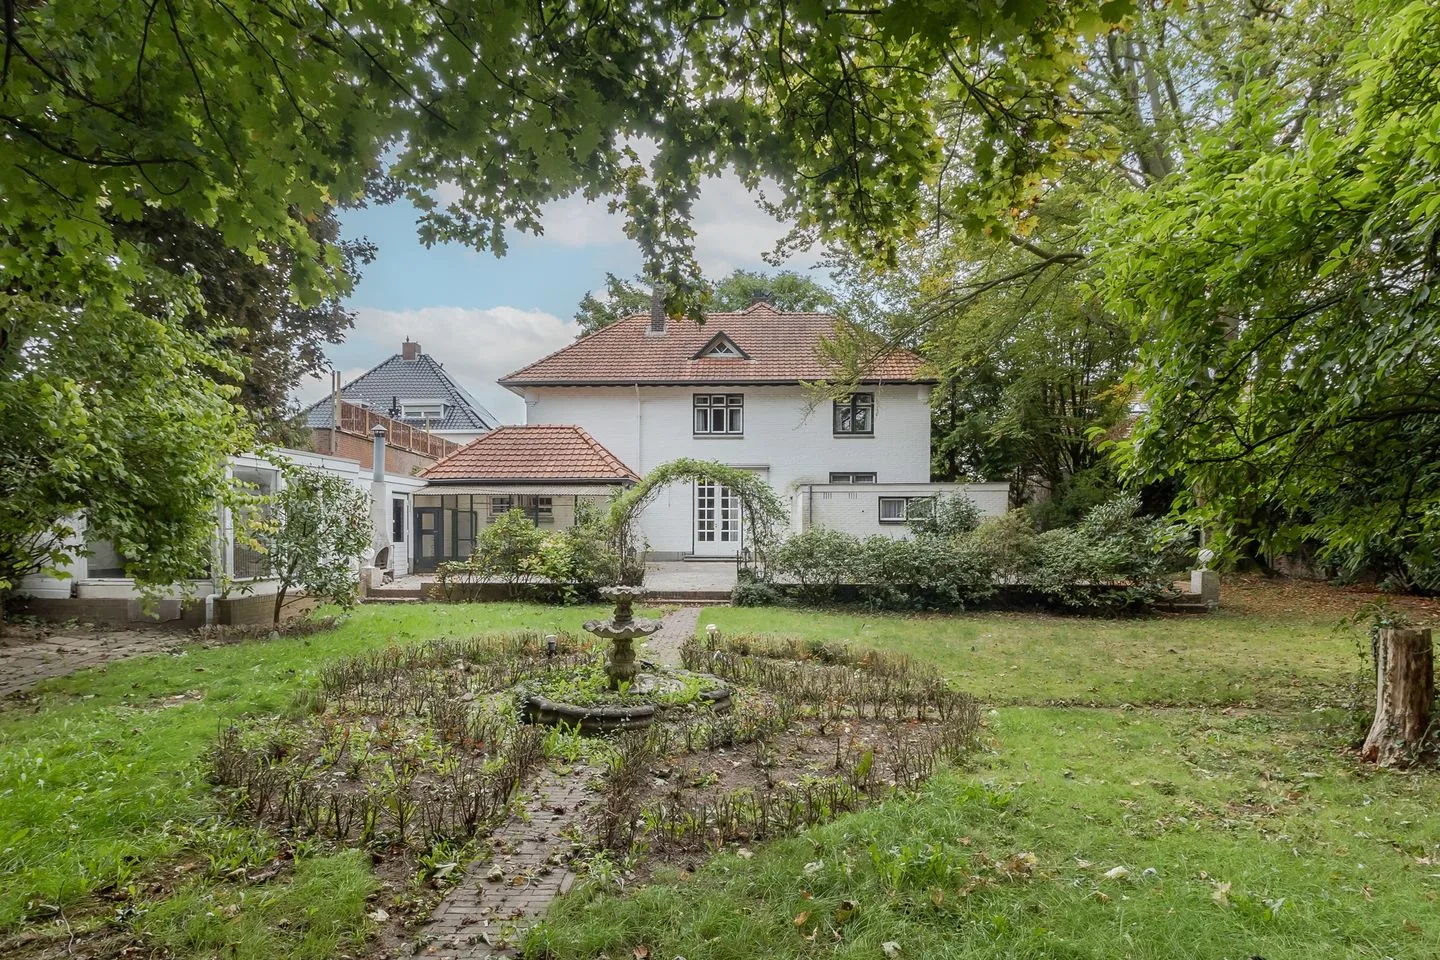
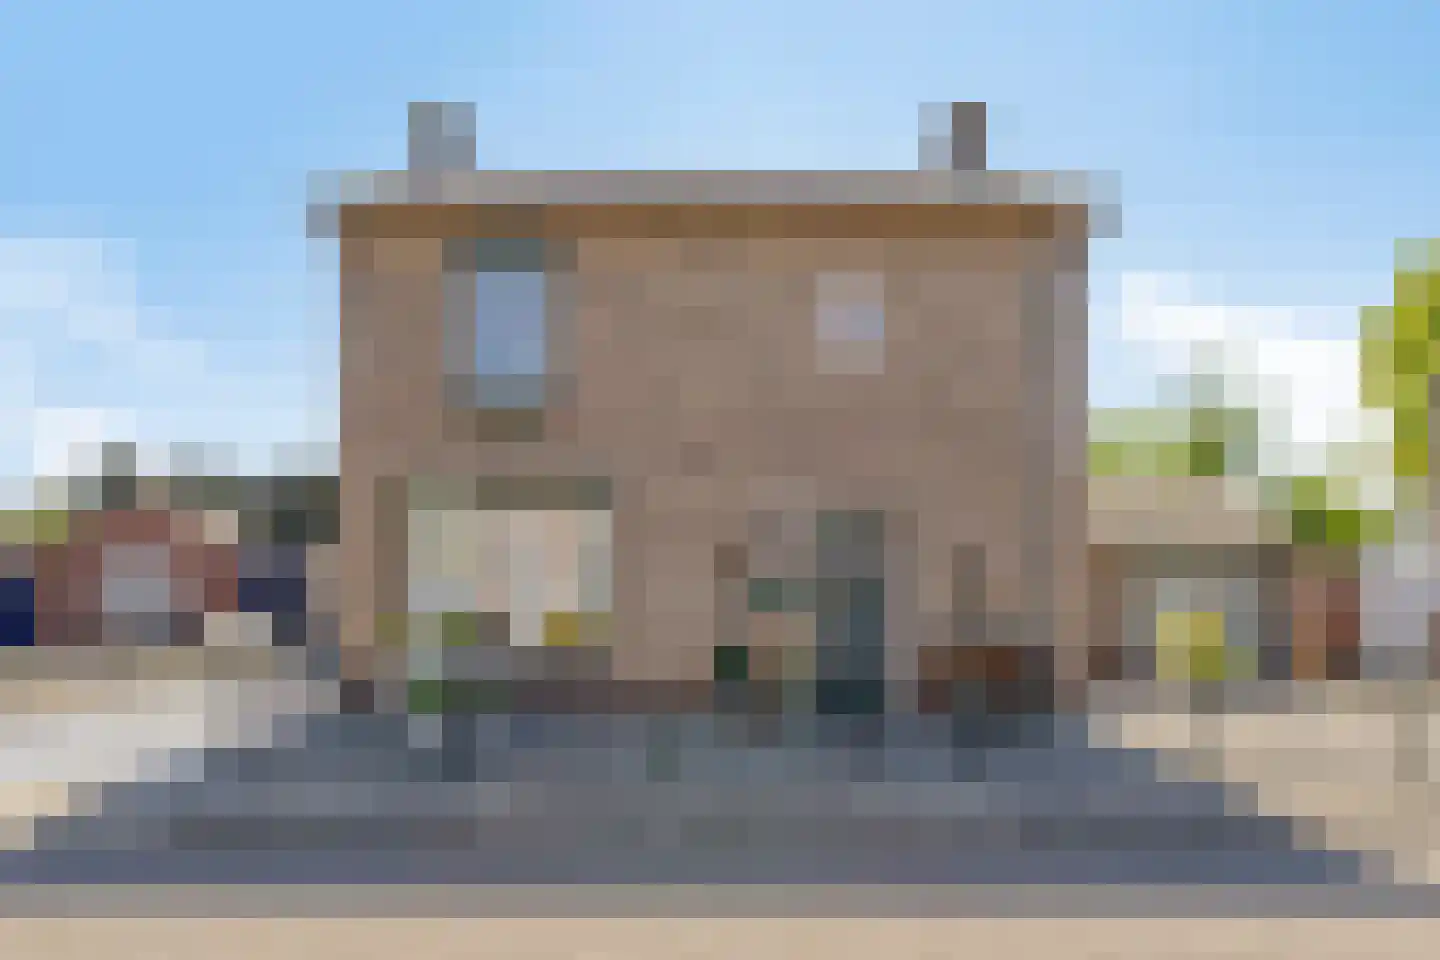
Leliestraat 5
6041GZ Roermond
€ 299.000 k.k.
€ 2.600/m²
FSave as favorite- Living area
- 115 m²
- Land area
- 68 m²
- Bedrooms
- 3
-

- Available
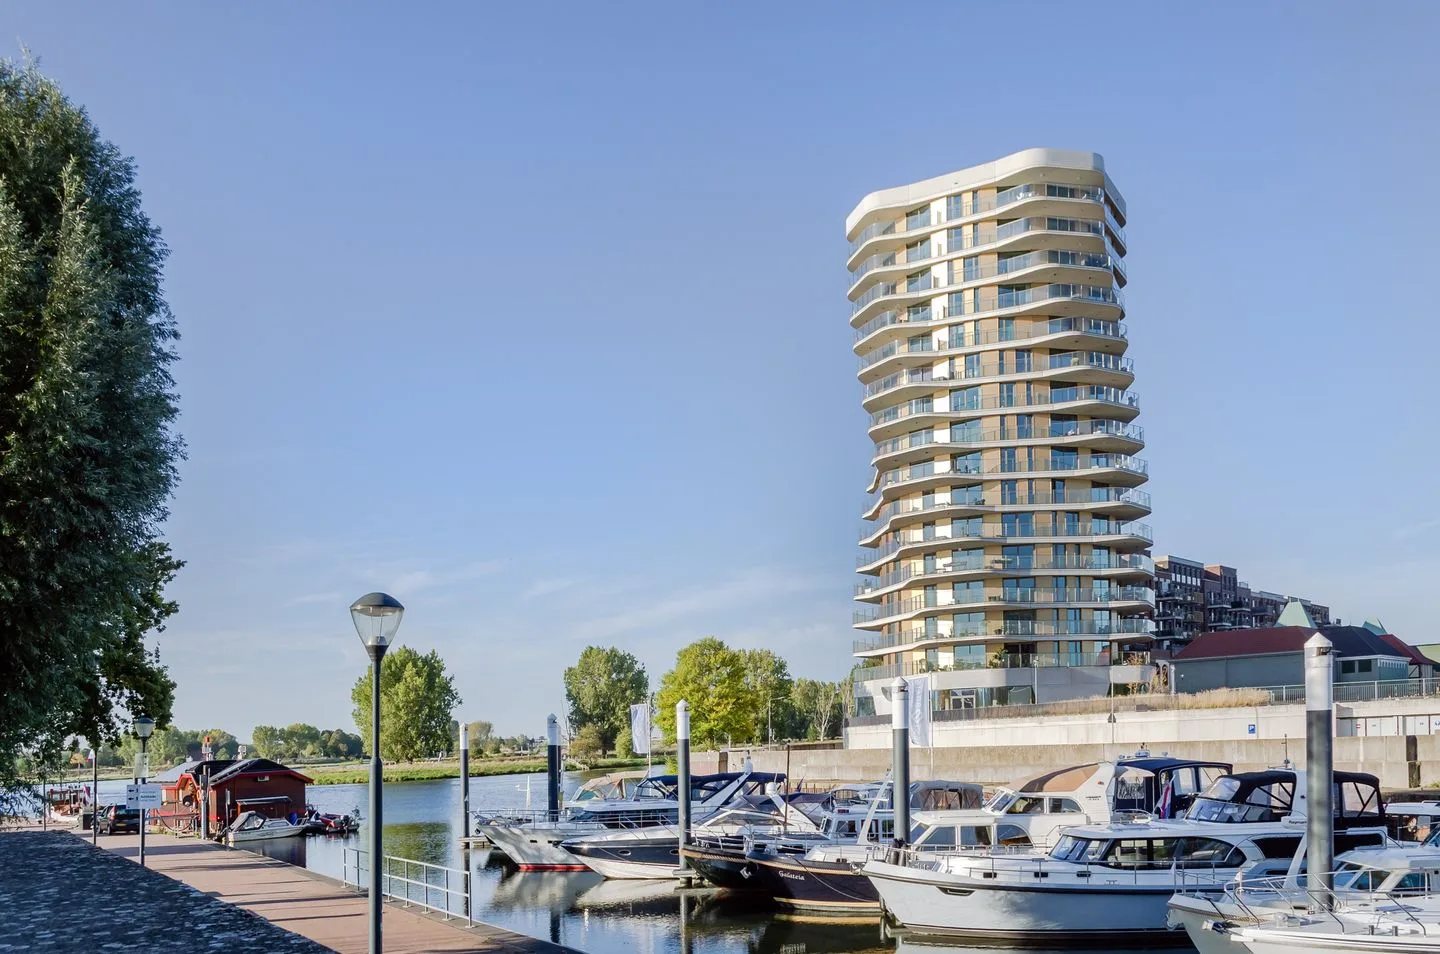
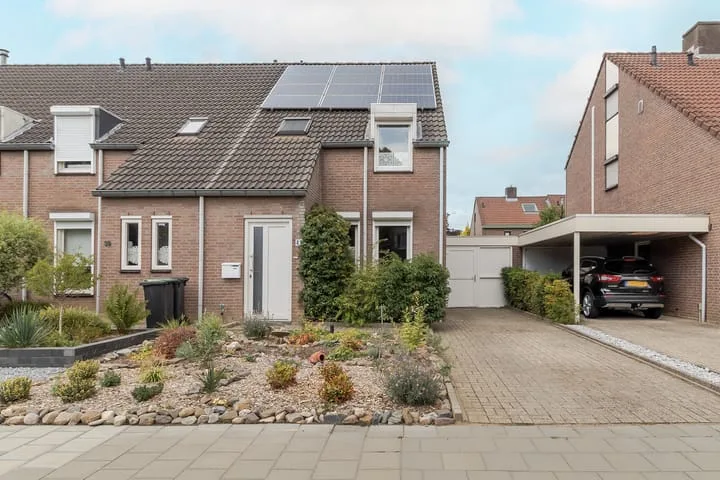
Watermunt 1
5931TK Tegelen
€ 420.000 k.k.
€ 5.122/m²
ASave as favorite- Living area
- 82 m²
- Land area
- —
- Bedrooms
- 2
Reviews (144)
Review platforms
BronscoresTotal score
144 total reviews

Funda
109 reviews on Funda

35 reviews on Google
-
Burgemeester Janssenstraat 3
10Duidelijke communicatie en geen enkele vraag van onze kant was teveel voor hun. We voelden ons echt meegenomen in het verkoopproces
-
Sint Jozefslaan 127
10Ik heb met meerdere makelaars gewerkt, maar HomeVision is veruit de beste. Zeer nauwkeurig, proactief, vriendelijk en betrokken.
-
Wilhelminasingel 243
9Zeer betrouwbaar , efficient en spontaan .Zeer duidelijk inzicht in het verkopen van het huis. Afspraken werden altijd nagekomen. Erg tevreden over deze werkwijze van deze makelaar.
-
Nellie Vantijk
10Het contact was zeer positief. De makelaars en secretaressen of collega's zijn heel erg behulpzaam bij het invullen en op weg helpen van alles wat nodig is om de verkoop zo gemakkelijk mogelijk te laten verlopen. Ze helpen en assisteren zoveel mogelijk om dingen uit handen te nemen. De fotoreportage en de brochure van het te verkopen pand ziet er zeer verzorgd en professioneel uit. De contacten verlopen erg warm en hartelijk. Altijd bereikbaar en oplossingsrichtingen. Top
-
Kortmannstraat 20
10Hele fijne ervaring met deze makelaar. Een vriendelijke en goede begeleiding bij verkoop van het huis. Je wordt goed geïnformeerd en kunt met vragen altijd bij hen terecht . Deze worden snel en adequaat beantwoord.
-
Schaapsweg 33
9Het informatie gesprek was duidelijk en prettig ook het afsluiten van de overeenkomst ging fijn. Verslag na elke bezichtiging was prettig.
-
Maasnielderweg 1
9Homevision verkocht jaren geleden onze woning, binnen 6 dagen!. Deze keer moest de woning van onze overleden ouders verkocht worden. Homevision heeft echt mega veel regelwerk moeten verrichten bij deze woning. Dus we zijn heel blij en dankbaar hiervoor!
-
Leenhof 80
10Het contact was zeer positief. De makelaars en secretaressen of collega's zijn heel erg behulpzaam bij het invullen en op weg helpen van alles wat nodig is om de verkoop zo gemakkelijk mogelijk te laten verlopen. Ze helpen en assisteren zoveel mogelijk om dingen uit handen te nemen. De fotoreportage en de brochure van het te verkopen pand ziet er zeer verzorgd en professioneel uit. De contacten verlopen erg warm en hartelijk. Altijd bereikbaar en oplossingsrichtingen. Top …
-
Sebaldusstraat 6
10Heldere en duidelijke uitleg van het verkoopplan en vervolgens steeds duidelijke communicatie. Na iedere bezichtigingsronde werd ik gebeld en kreeg ik informatie over de mensen die zijn komen bezichtigen.
-
Bosscher-ven 61
9Super fijne makelaar! Persoonlijk advies en duidelijke communicatie. Professionele fotografie en online presentatie.
-
Helena Post
10Prettig en persoonlijk contact. Goede afstemming op persoonlijke situatie van ons als verkoper. Uitgebreide uitleg over markt en prijs ontwikkeling in relatie tot woning. Zeer uitgebreide en kwalitatieve presentatie van de woning (incl. brochure). Efficiënte organisatie bezichtigingen. Goede terugkoppeling bezichtigingen. Echt ontzorgd.
-
Herungerstraat 176 A
10Perfect .
-
Begijnenpeelweg 5
9Prettig en persoonlijk contact. Goede afstemming om persoonlijke situatie van ons als verkoper. Uitgebreide uitleg over markt en prijs ontwikkeling in relatie tot woning. Zeer uitgebreide en kwalitatieve presentatie van de woning (incl. brochure). Efficiënte organisatie bezichtigingen. Goede terugkoppeling bezichtigingen. Echt ontzorgd.
-
Louis Beerenbrouckstraat 29
10Betrokken en zeer kundig makelaar waar we direct een klik mee hadden. Toch belangrijk; je geeft je waardevol bezit, je huis, in hun handen! Mijn huis werd dan ook snel verkocht, zoals al hun huizen in hun portefeuille. Fijn , om deze afsluitende periode met Homevision te hebben gedaan. Ik zou altijd weer bij Homevision mijn huis te koop aanbieden!
-
Fred Reitsma
10Translated by AIthe real estate agents were friendly and helpful in answering the questions i had. they also thought along with the situation i was in and came up with solutions. there was good listening and they also anticipated well. the communication was good and they were always easy to reach. it is a young dynamic team that is committed to the sellers.you are kept well informed by the real estate agents regarding the developments around the sale. i would definitely recommend the real estate agents to others who want to sell their house.
-
Anita Heymans
10 -
Raadhuisplein 5
9De communicatie met de makelaar verliep uiterst prettig. Na elke bezichtiging werd contact opgenomen over de gang van zaken..
-
Hubert Cuyperslaan 47
9Wij zijn zeer tevreden, de communicatie was altijd snel en duidelijk waardoor we steeds goed op de hoogte waren over de stand van zaken. We hebben eerlijk en deskundig advies gekregen, wat ons veel vertrouwen gaf in het proces. Daarnaast was de samenwerking erg prettig en persoonlijk, alles verliep soepel en professioneel. We raden Homevision dan ook zeker aan.
-
Ophovenstraat 30
10Wij zijn zeer tevreden over de hele gang van zaken. We werden steeds in stapjes meegenomen in het hele proces, zelfs aan huis hulp gehad bij het invullen van alle digitale documenten. Ook het tekenen van het concept verkoopcontract werd bij ons thuis gedaan. Niets was teveel gevraagd, zoals per app en e-mail werd snel gereageerd. Wij zouden deze makelaar aan iedereen aanbevelen!!
-
Esdoornstraat 3
9Top makelaar alles is top Verlopen. Echt een aanrader als makelaar. Eerlijk en goed advies en kundige mensen