
In Schoonhoven, HV-Makelaardij offers reliable and personal real estate services. We combine knowledge with passion for the neighborhood and are ready to help you, whether you want to sell a property, buy one or have it appraised. Our customer-oriented approach ensures a calm and reassuring experience in the world of real estate. We provide service in the areas of sales, purchases and appraisals. Our approach is transparent, detailed an...
Current housing stock
-

- Available
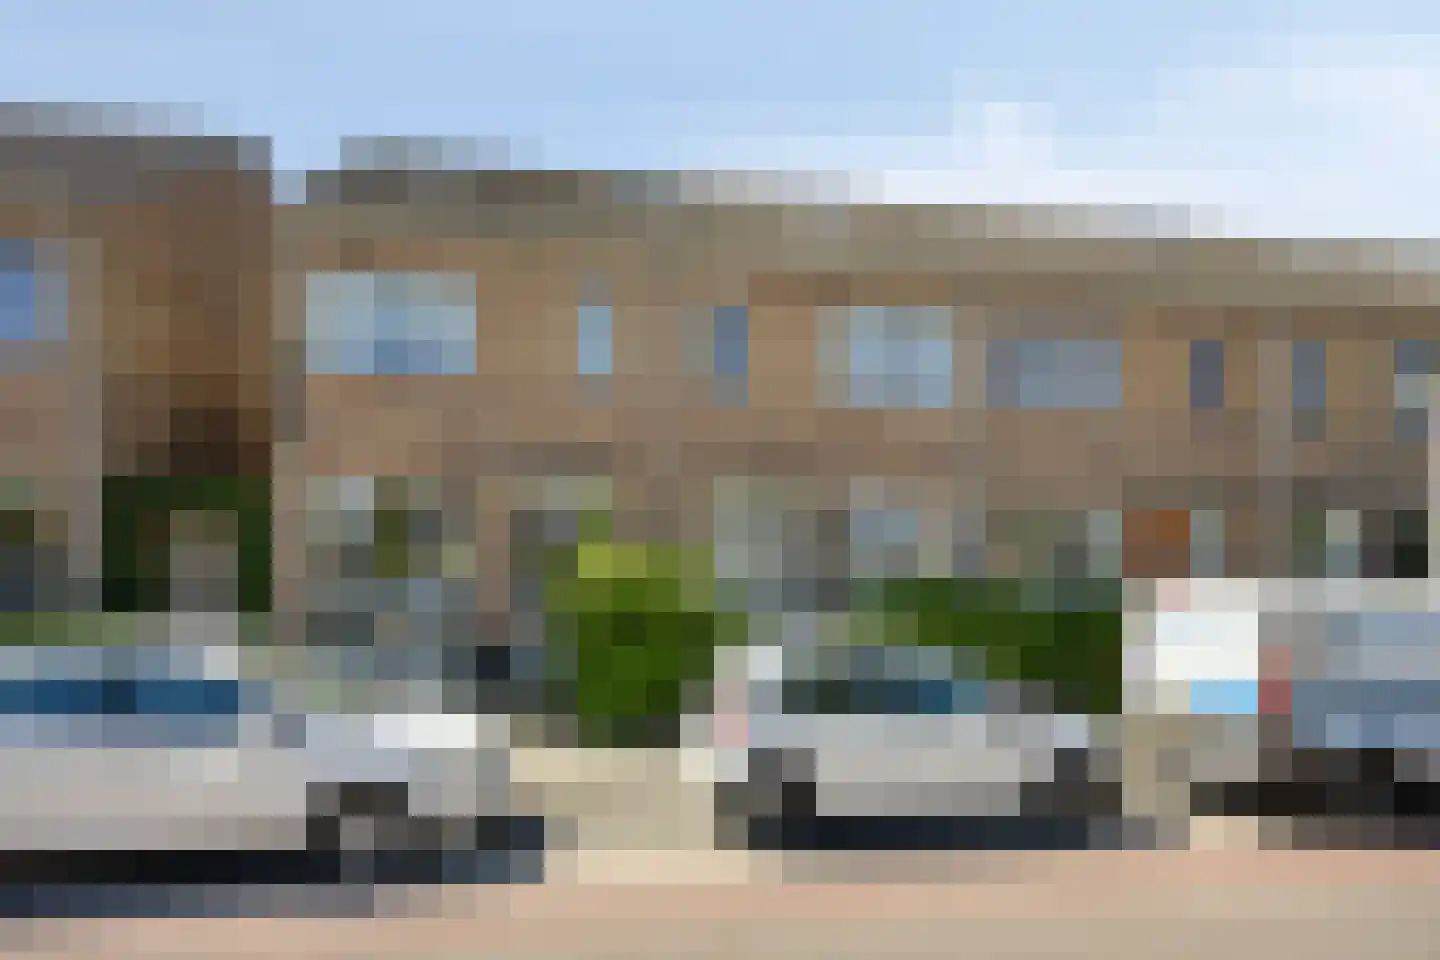
Koestraat 109 c
2871DP Schoonhoven
€ 375.000 k.k.
€ 4.310/m²
ESave as favorite- Living area
- 87 m²
- Land area
- —
- Bedrooms
- 2
-
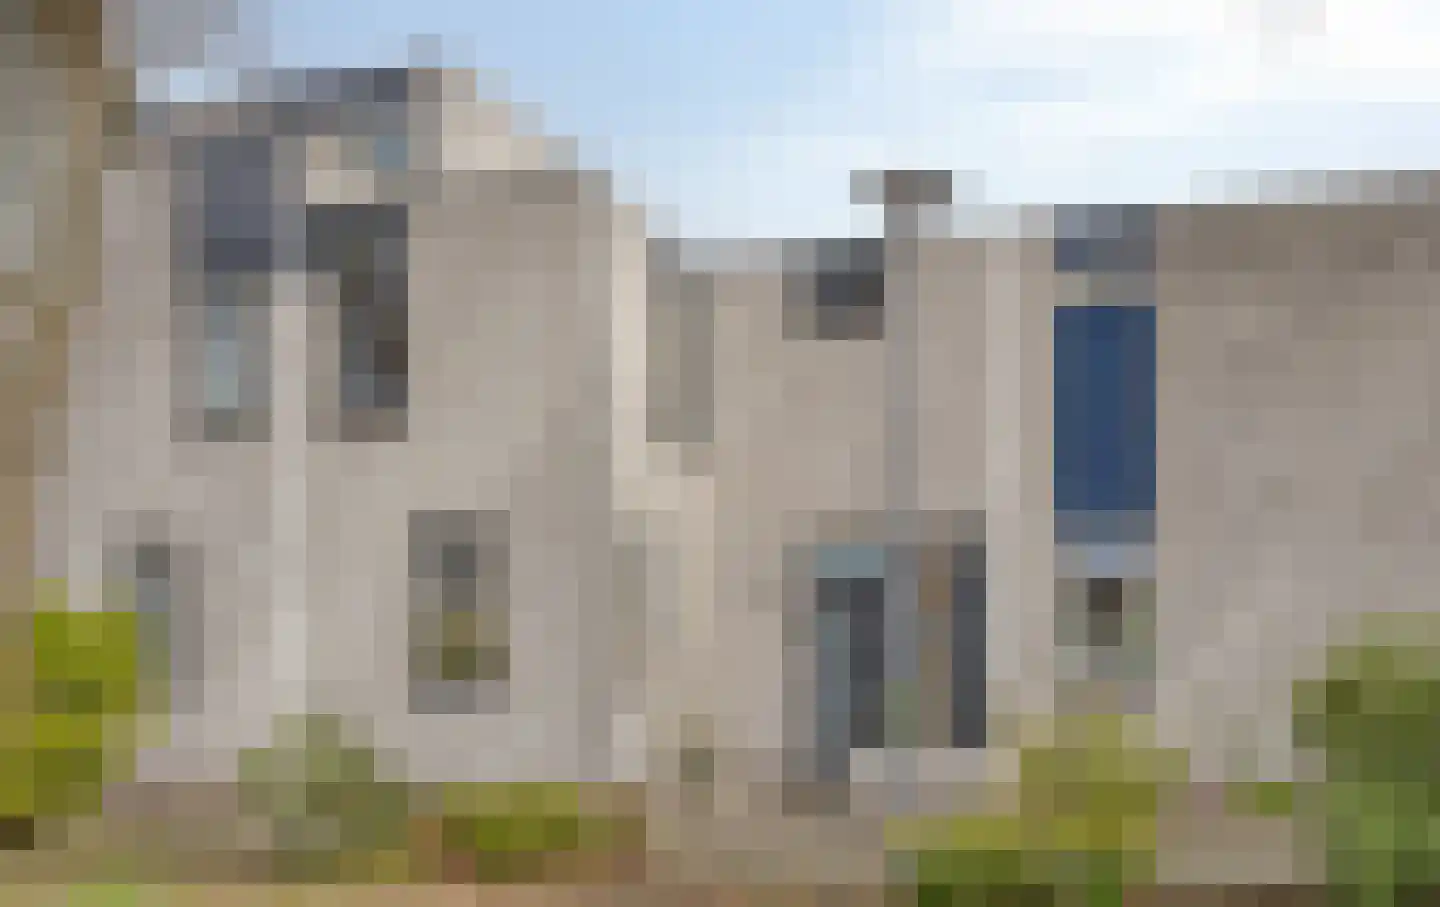
- Available
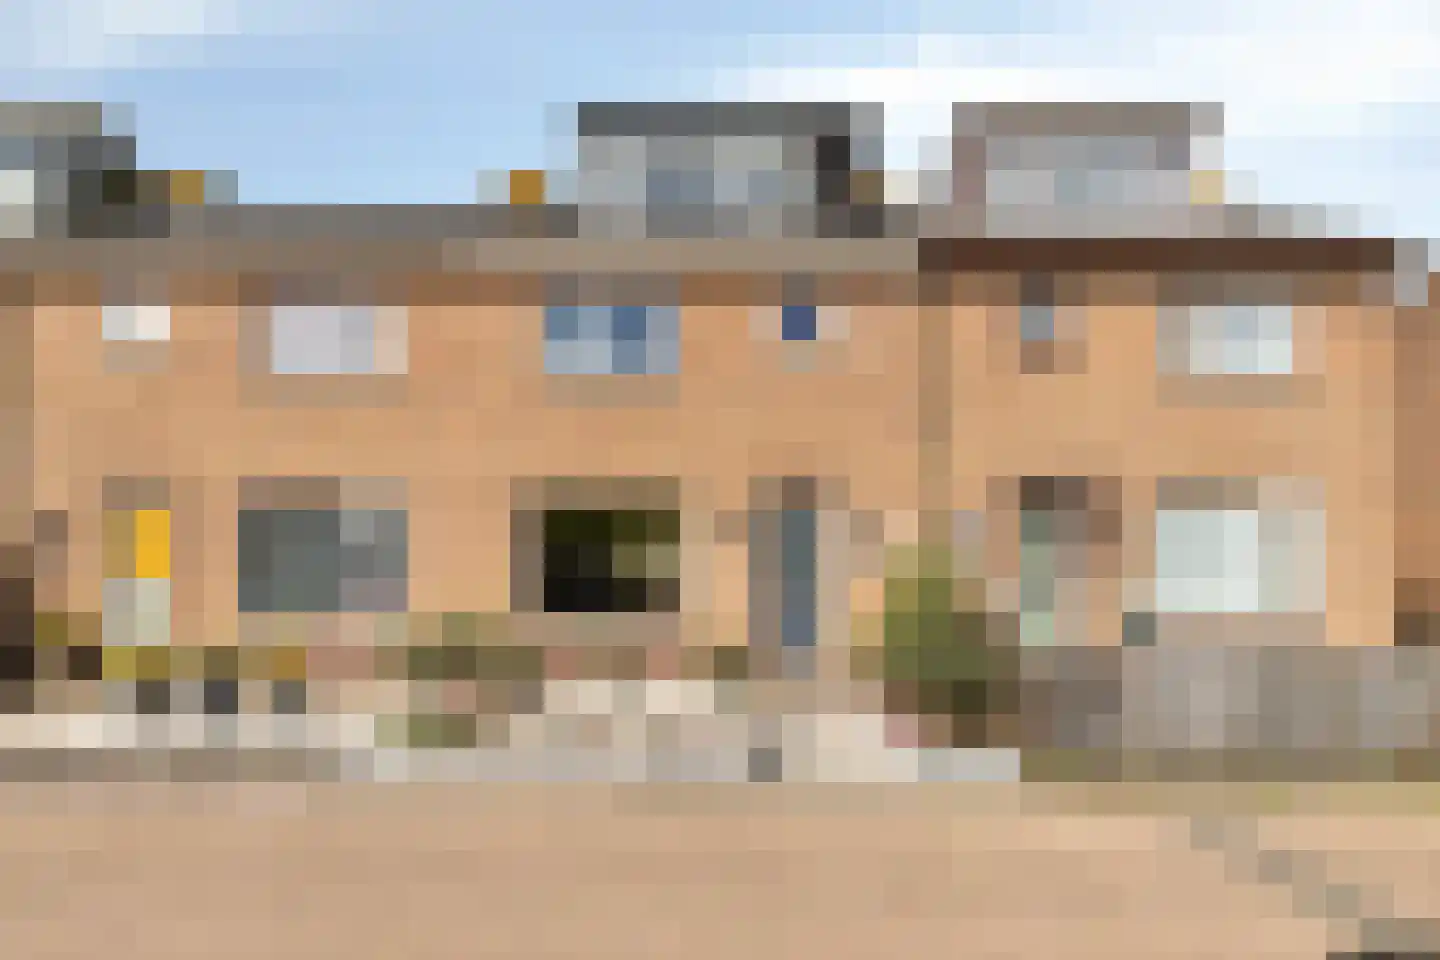
Oude Haven 3
2871DG Schoonhoven
€ 400.000 k.k.
€ 2.564/m²
FSave as favorite- Living area
- 156 m²
- Land area
- 78 m²
- Bedrooms
- 4
-
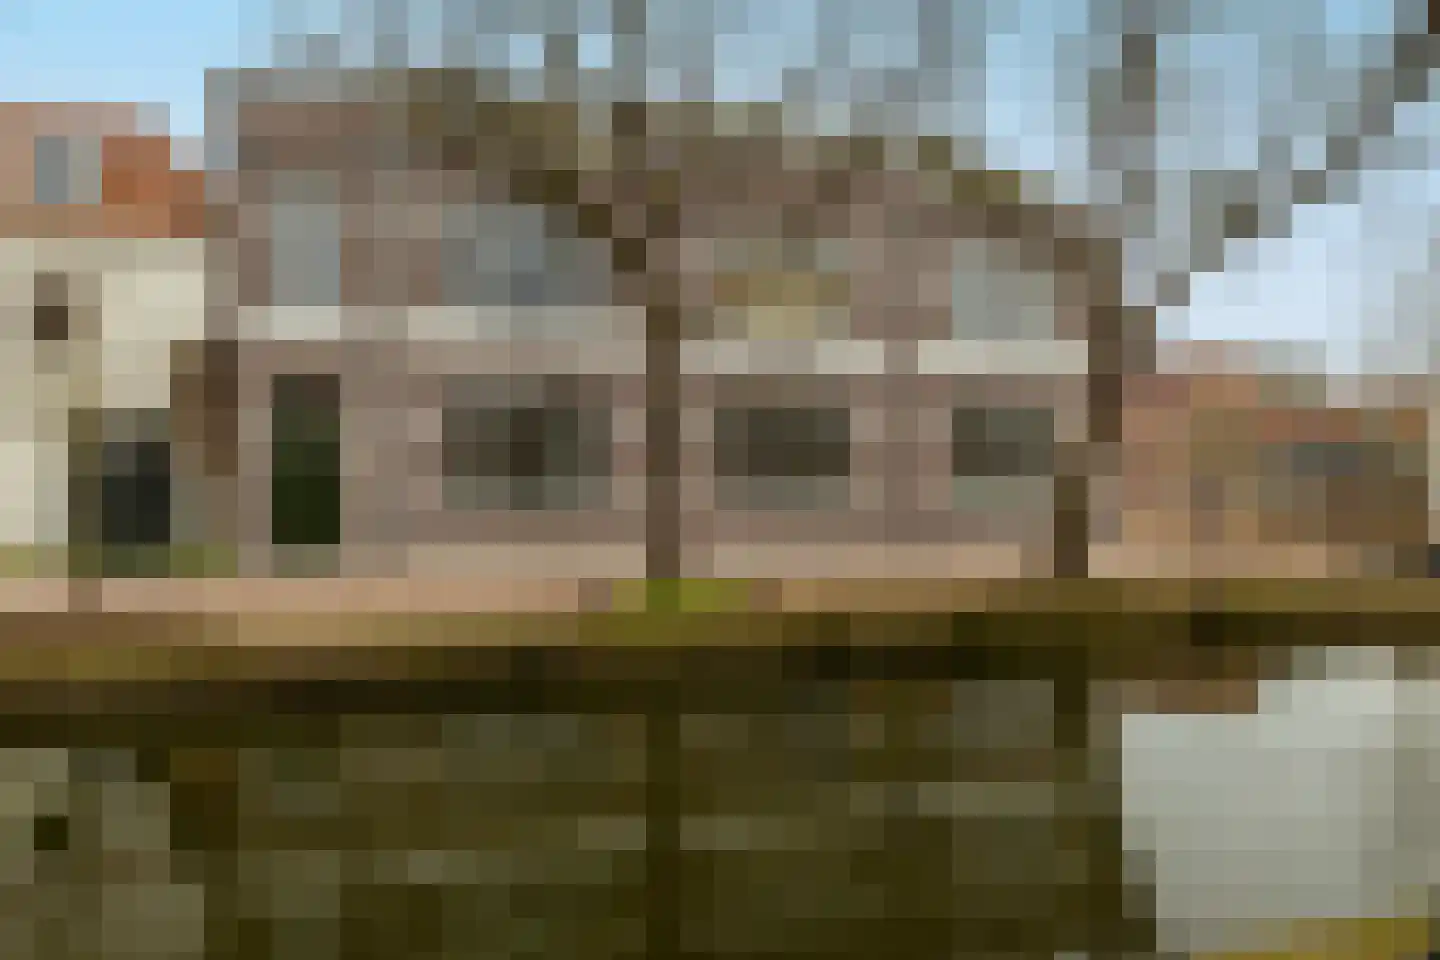
- Sold subject to confirmation
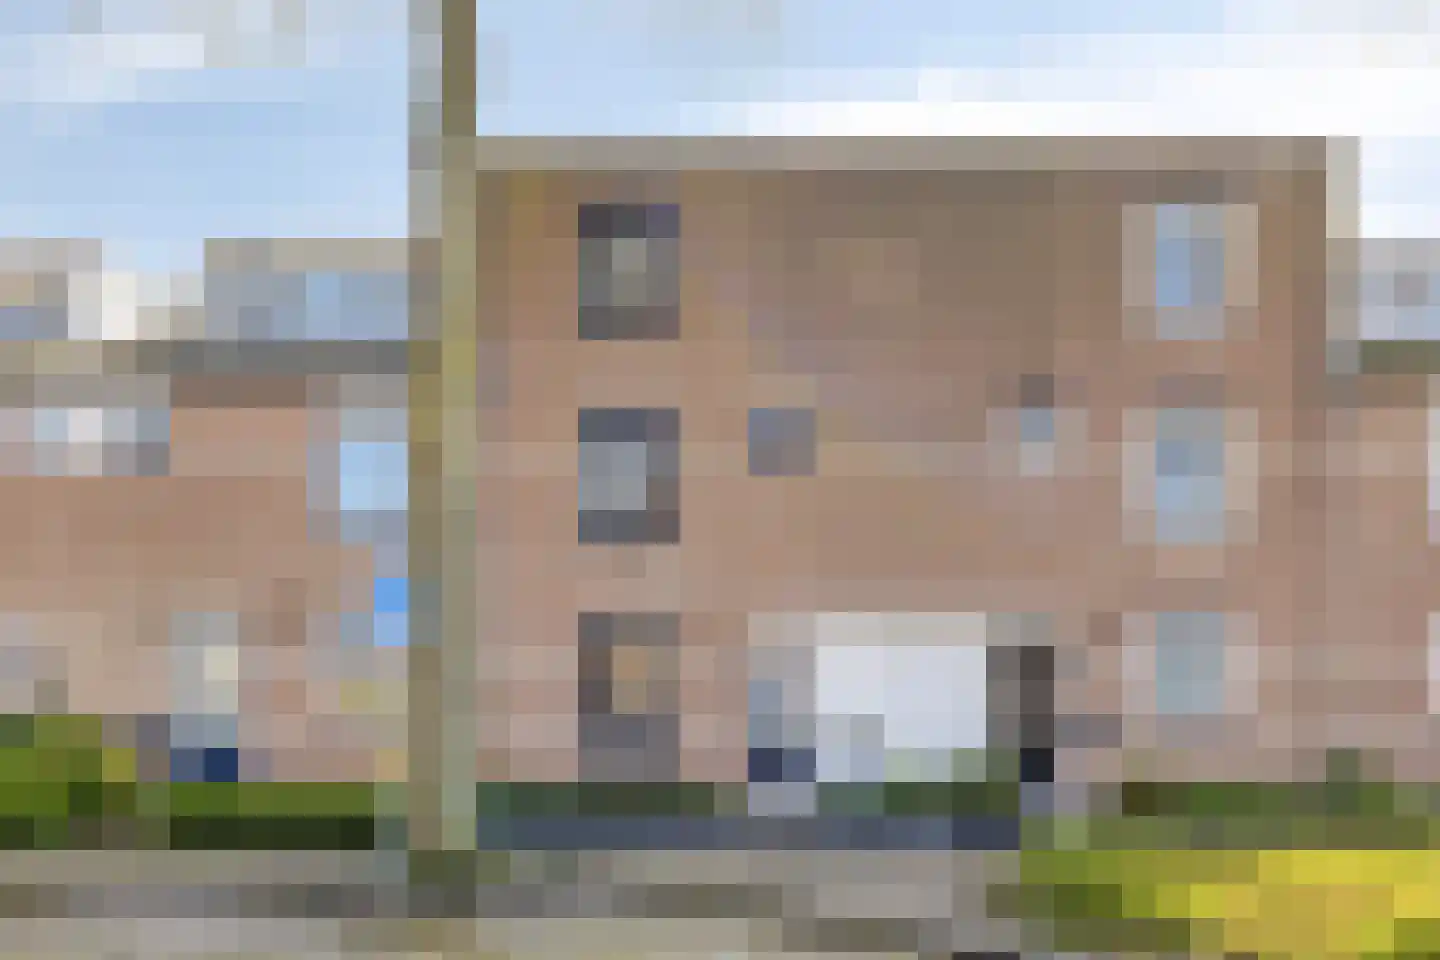
Mariannehof 7
3411XE Lopik
€ 400.000 k.k.
€ 3.419/m²
CSave as favorite- Living area
- 117 m²
- Land area
- 137 m²
- Bedrooms
- 4
-

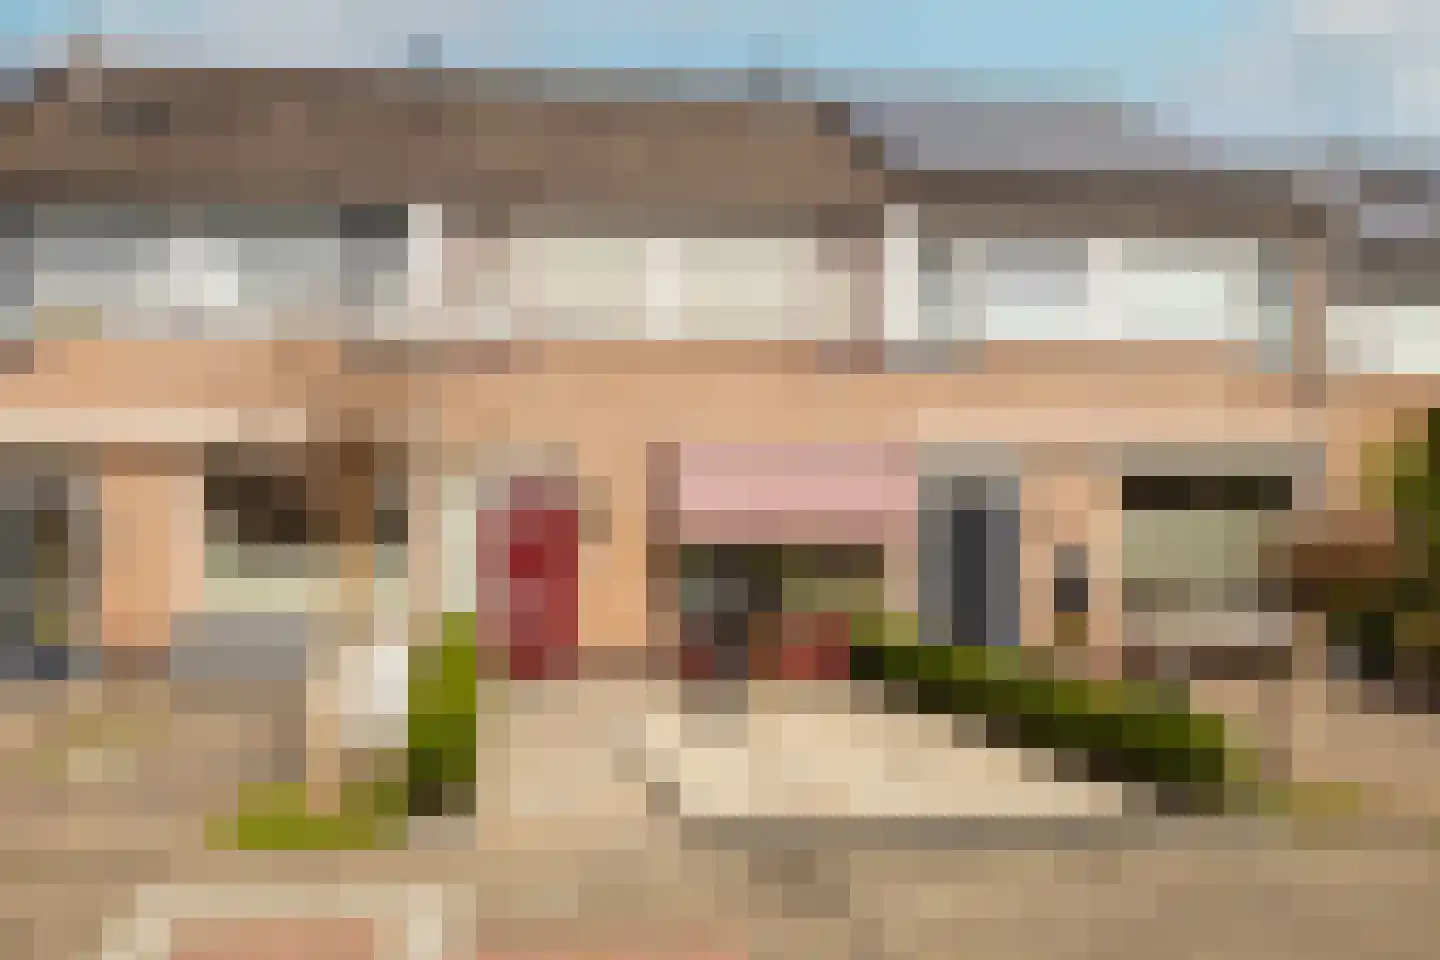
- Sold
Kalverstraat 10
2935AE Ouderkerk aan den IJssel
€ 235.000 k.k.
€ 5.222/m²
GSave as favorite- Living area
- 45 m²
- Land area
- 115 m²
- Bedrooms
- 1
-

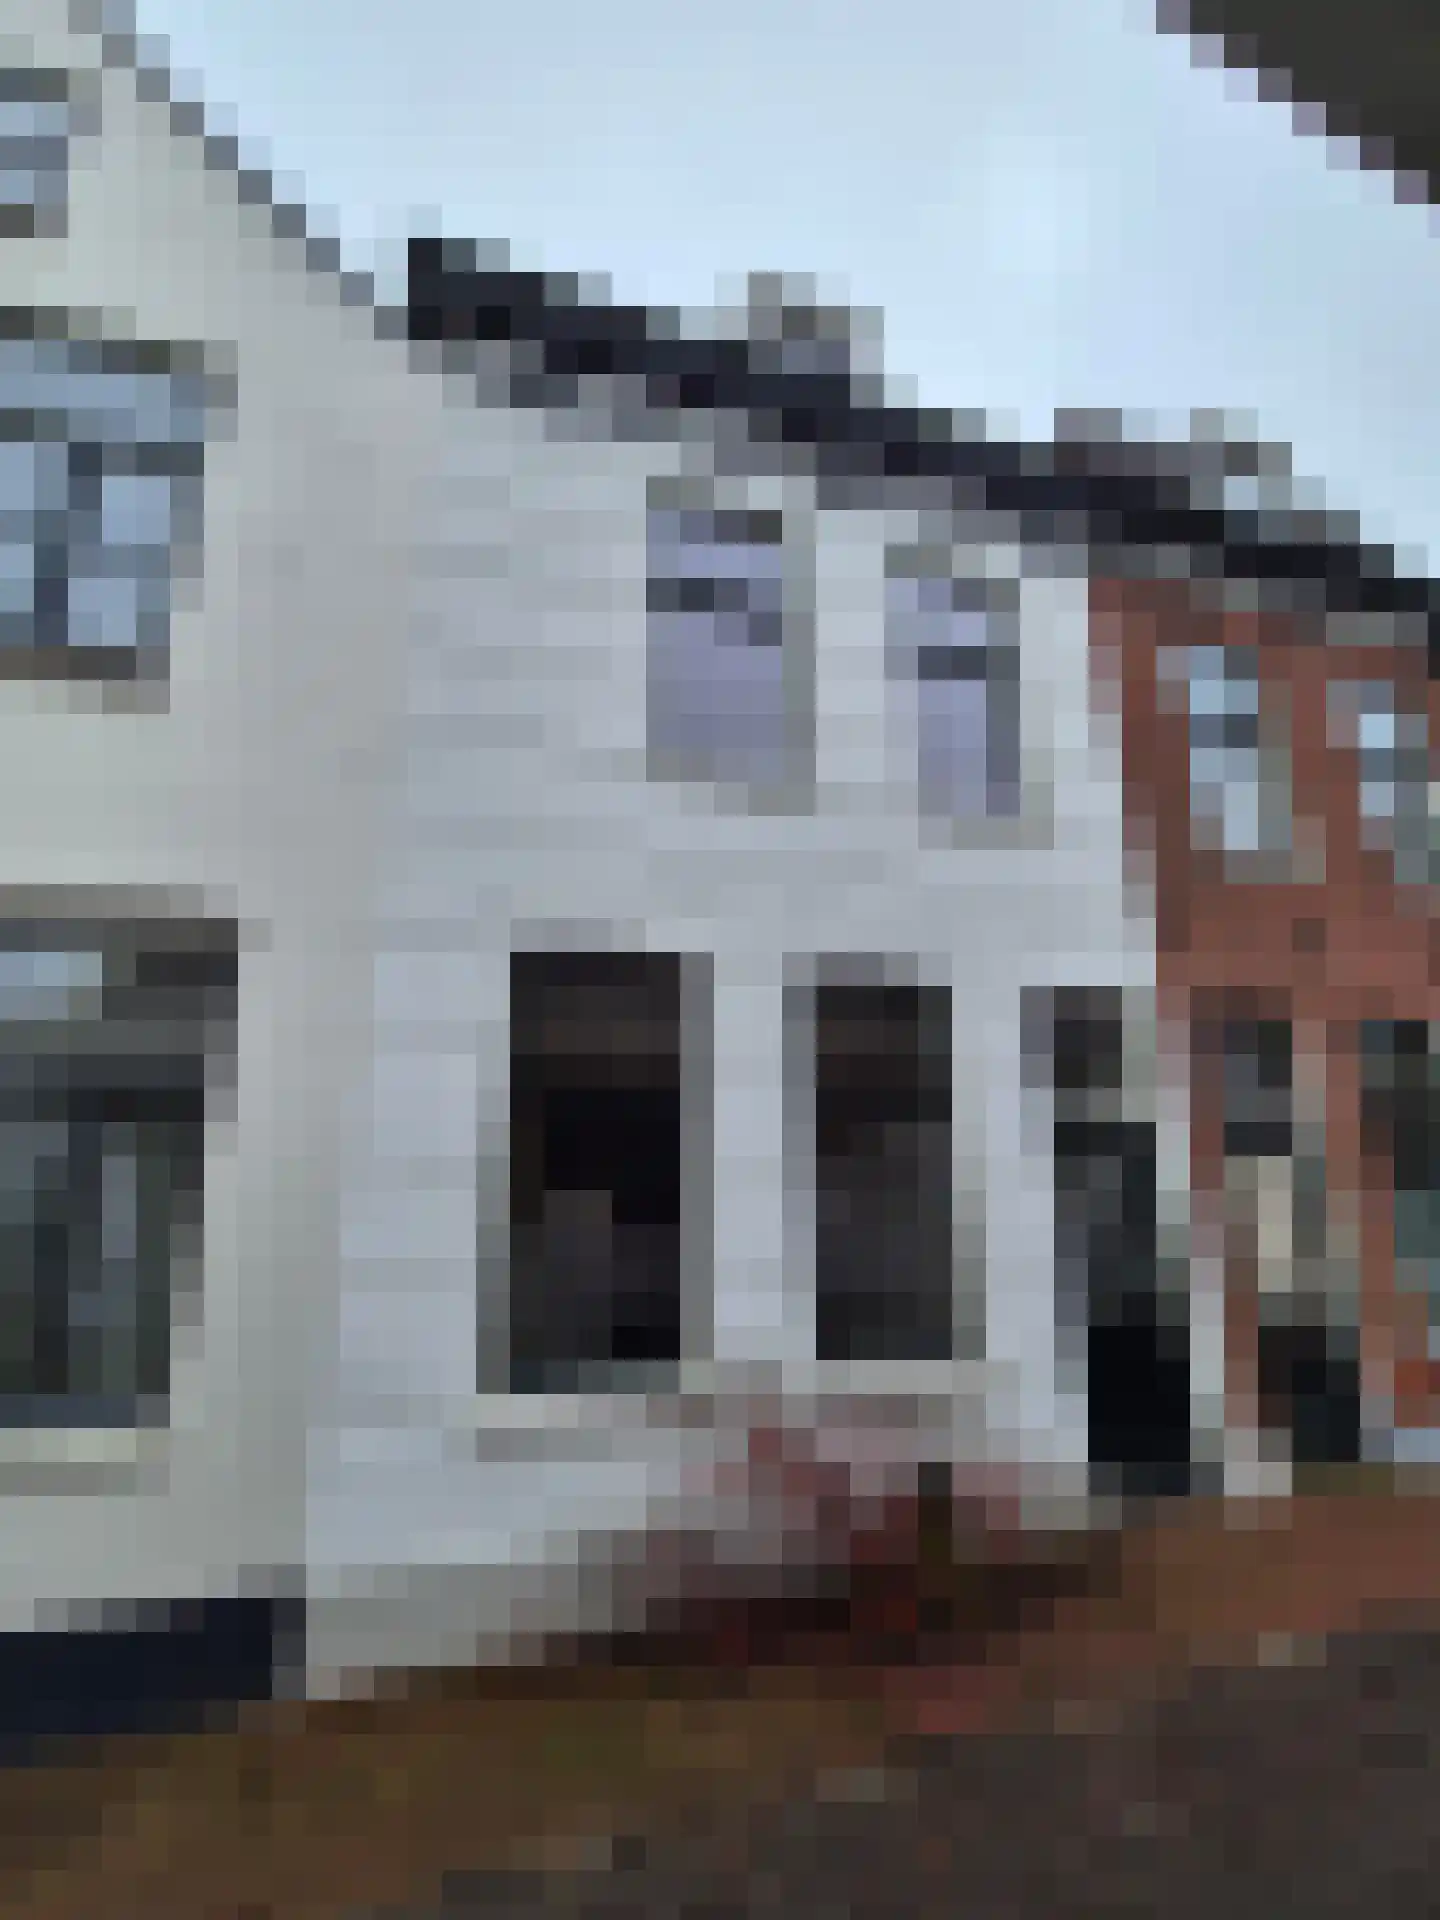
- Sold
Elandstraat 15 B
3064AG Rotterdam
€ 295.000 k.k.
€ 5.673/m²
BSave as favorite- Living area
- 52 m²
- Land area
- —
- Bedrooms
- 2
Reviews (2)
Review platforms
BronscoresTotal score
2 total reviews

2 reviews on Google
-
Stefan van Vugt
10Translated by AIIn September 2025 we had an appraisal done by Hennie. We are very satisfied with the speed and quality of this. Definitely recommended.
-
Udo Monfoort
10