Reijngoudt Rentmeesters B.V. is een makelaarskantoor met specialisatie in agrarisch en landelijk vastgoed, gevestigd in Sint Philipsland. Wij staan voor betrouwbare en persoonlijke dienstverlening, met als doel dat uw grond zorgvuldig en transparant wordt beheerd. Onze ervaring en kennis van de regio zorgen voor een gerichte aanpak, waarbij uw belangen centraal staan. Wij bieden diensten als verkoop, aankoop, taxaties en financieel advi...
Current housing stock
-

- Sold
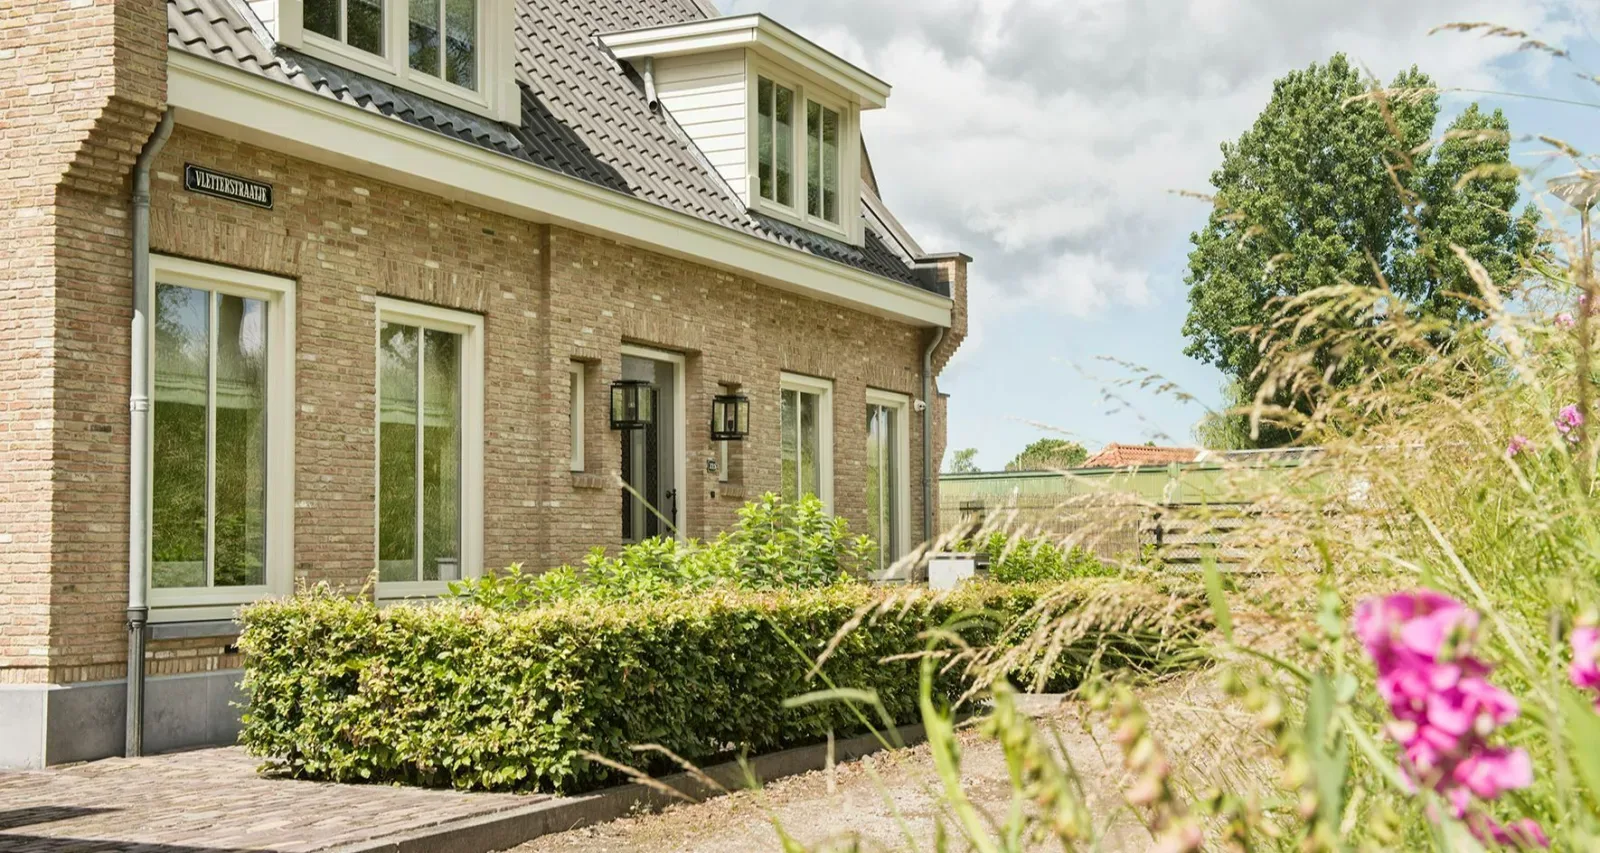
Buurtweg 8 a
4696RV Stavenisse
€ 829.500 k.k.
€ 3.753/m²
A+Save as favorite- Living area
- 221 m²
- Land area
- 3977 m²
- Bedrooms
- 5
Reviews (1)
Review platforms
BronscoresTotal score
1 total reviews

1 reviews on Google
-
Ben de Rooy
8Translated by AIVery fast response time, and good advice.