
Real estate agency De Boer + Ten Hoeve has been established in Steenwijk since 1978 and is known as one of the largest real estate companies in Overijssel. The office is managed by Anja Oosterhof-Bultsma, certified real estate agent and appraiser, supported by Joke Telman and Freddy Oosterhof. Together they form a team with lots of experience, knowledge and enthusiasm. The office is located in the center of Steenwijk, with a modern and...
Current housing stock
-

- Available
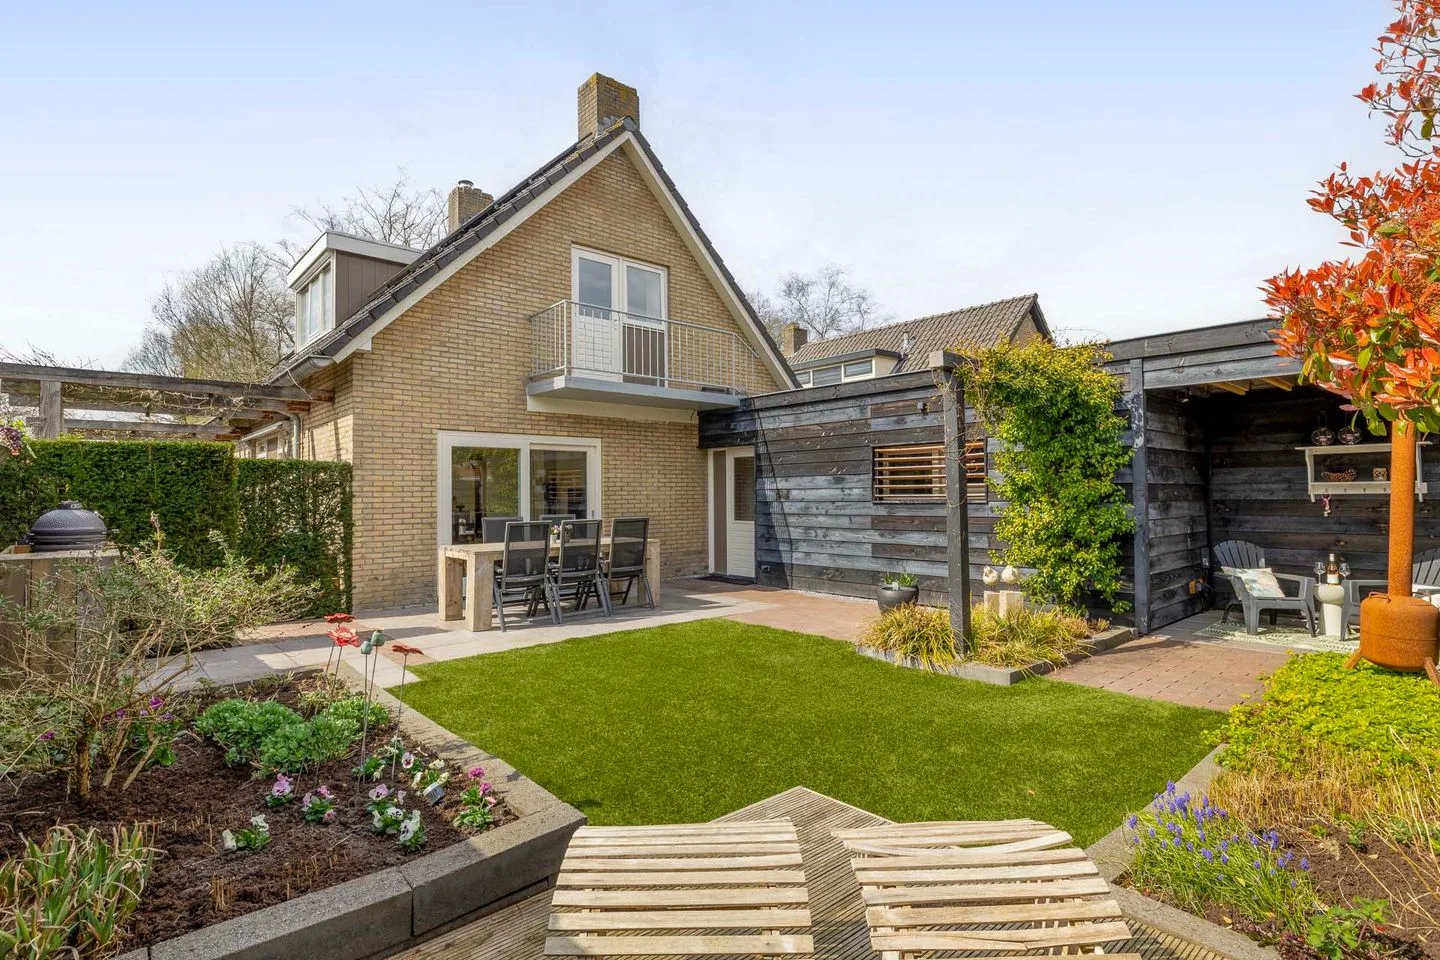
Steenwijkerdiep 32 A
8331LT Steenwijk
€ 384.000 k.k.
A+Save as favorite- Living area
- 112 m²
- Land area
- 103 m²
- Bedrooms
- 3
-

- Available
Compagnie 5
8333DJ Steenwijk
€ 565.000 k.k.
ASave as favorite- Living area
- 139 m²
- Land area
- 282 m²
- Bedrooms
- 3
-

- Available
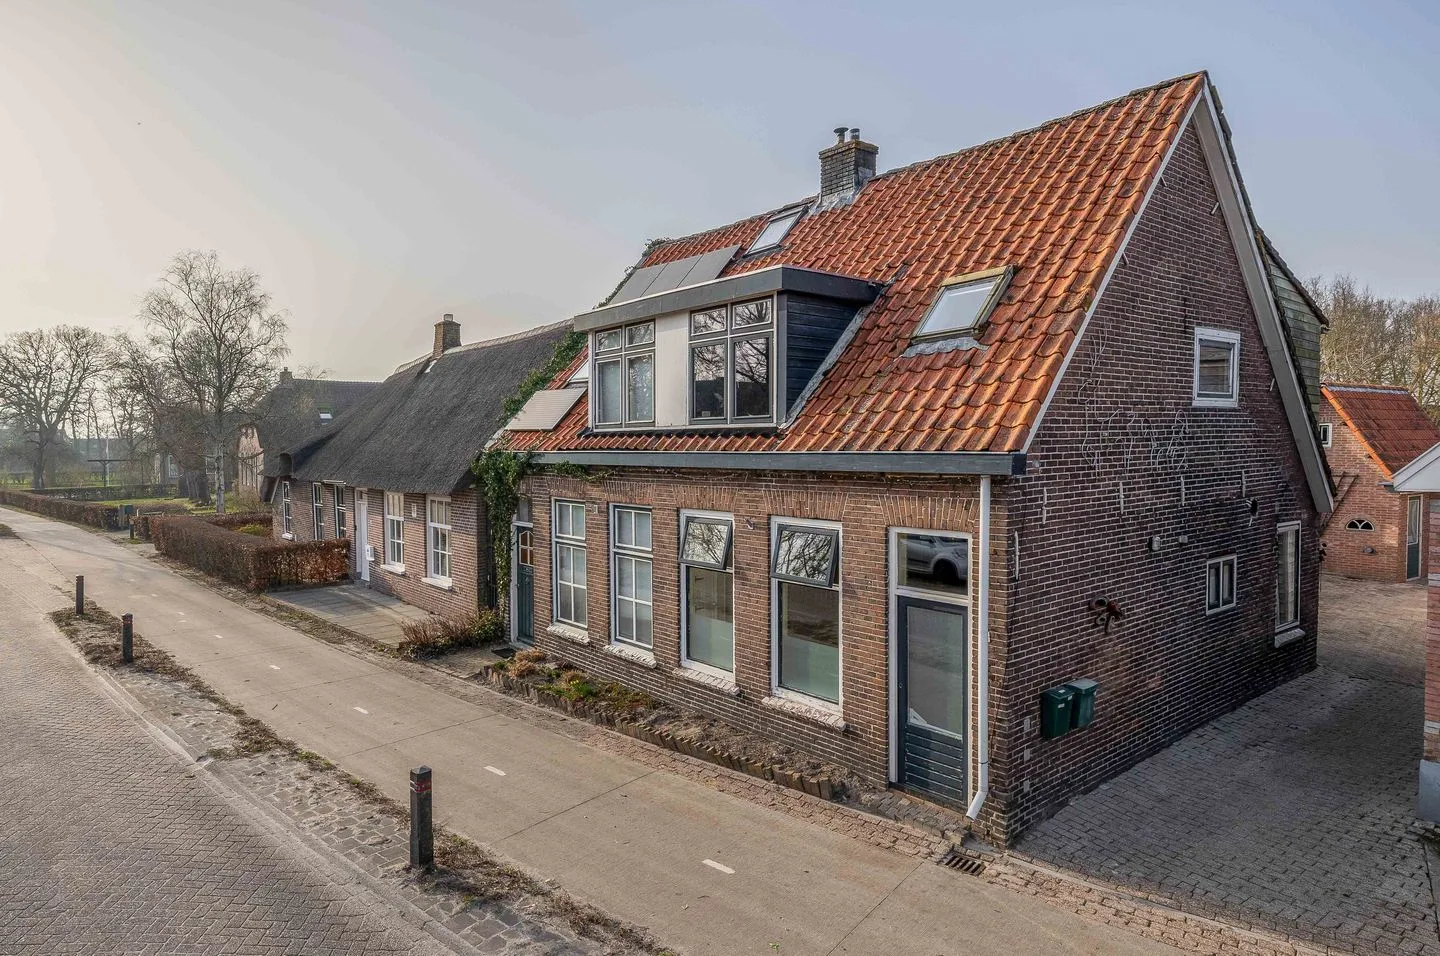
Zuiderwalstraat 8
8356EC Blokzijl
€ 395.000 k.k.
€ 3.135/m²
CSave as favorite- Living area
- 126 m²
- Land area
- 255 m²
- Bedrooms
- 3
-

- Available
J H Tromp Meestersstraat 13
8331GN Steenwijk
€ 650.000 k.k.
€ 2.434/m²
Save as favorite- Living area
- 267 m²
- Land area
- 546 m²
- Bedrooms
- 6
-

- Available
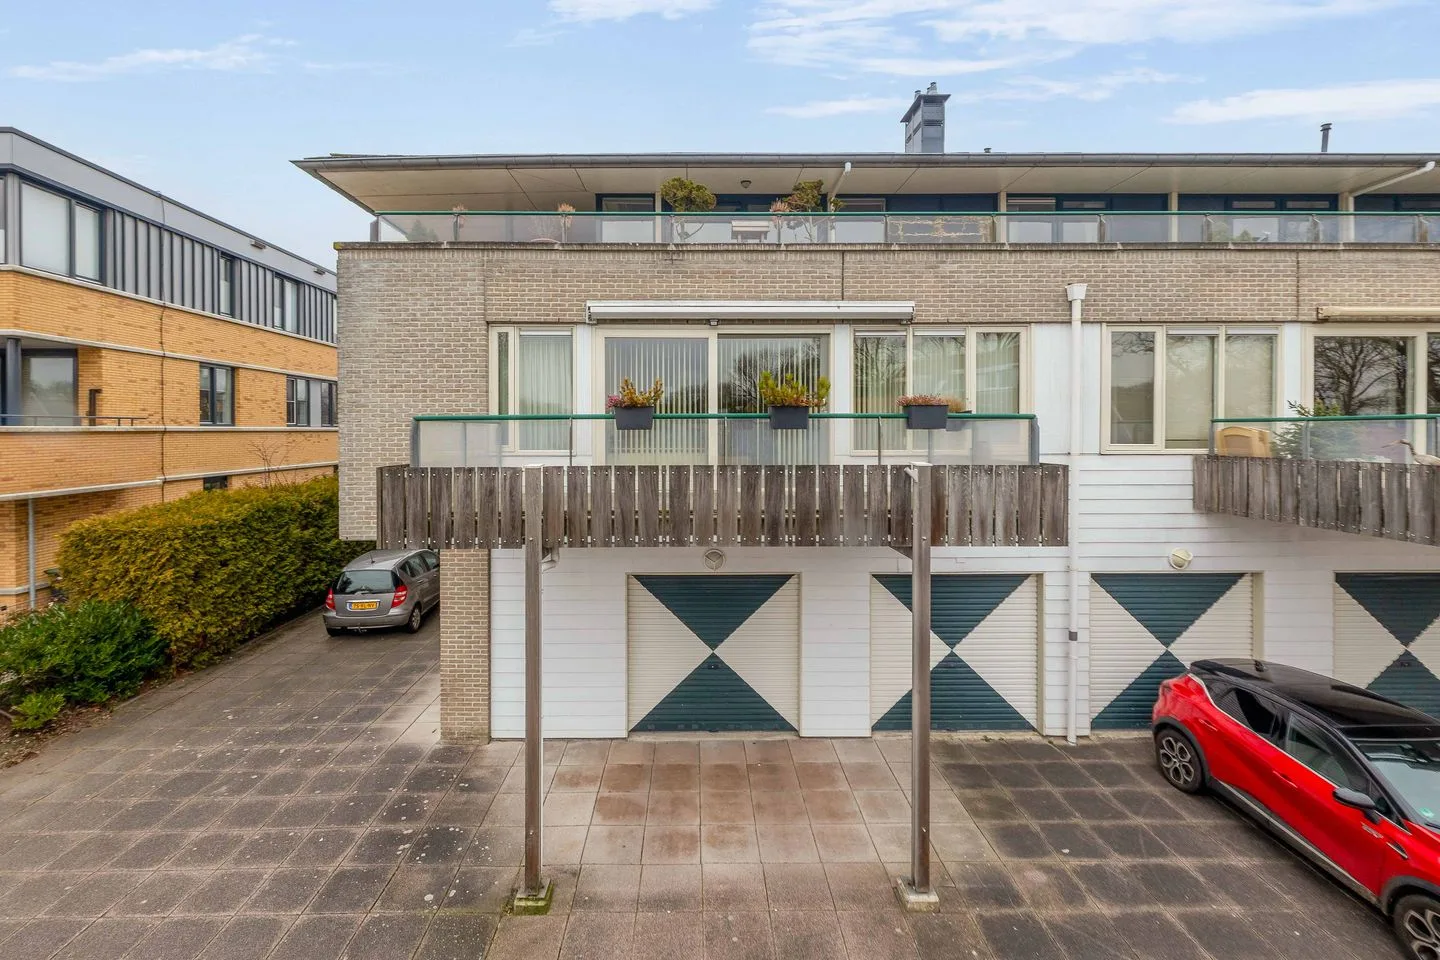
Jonenweg 5 R 527
8355CN Giethoorn
€ 425.000 k.k.
€ 4.292/m²
ASave as favorite- Living area
- 99 m²
- Land area
- 645 m²
- Bedrooms
- 3
-

- Sold subject to confirmation
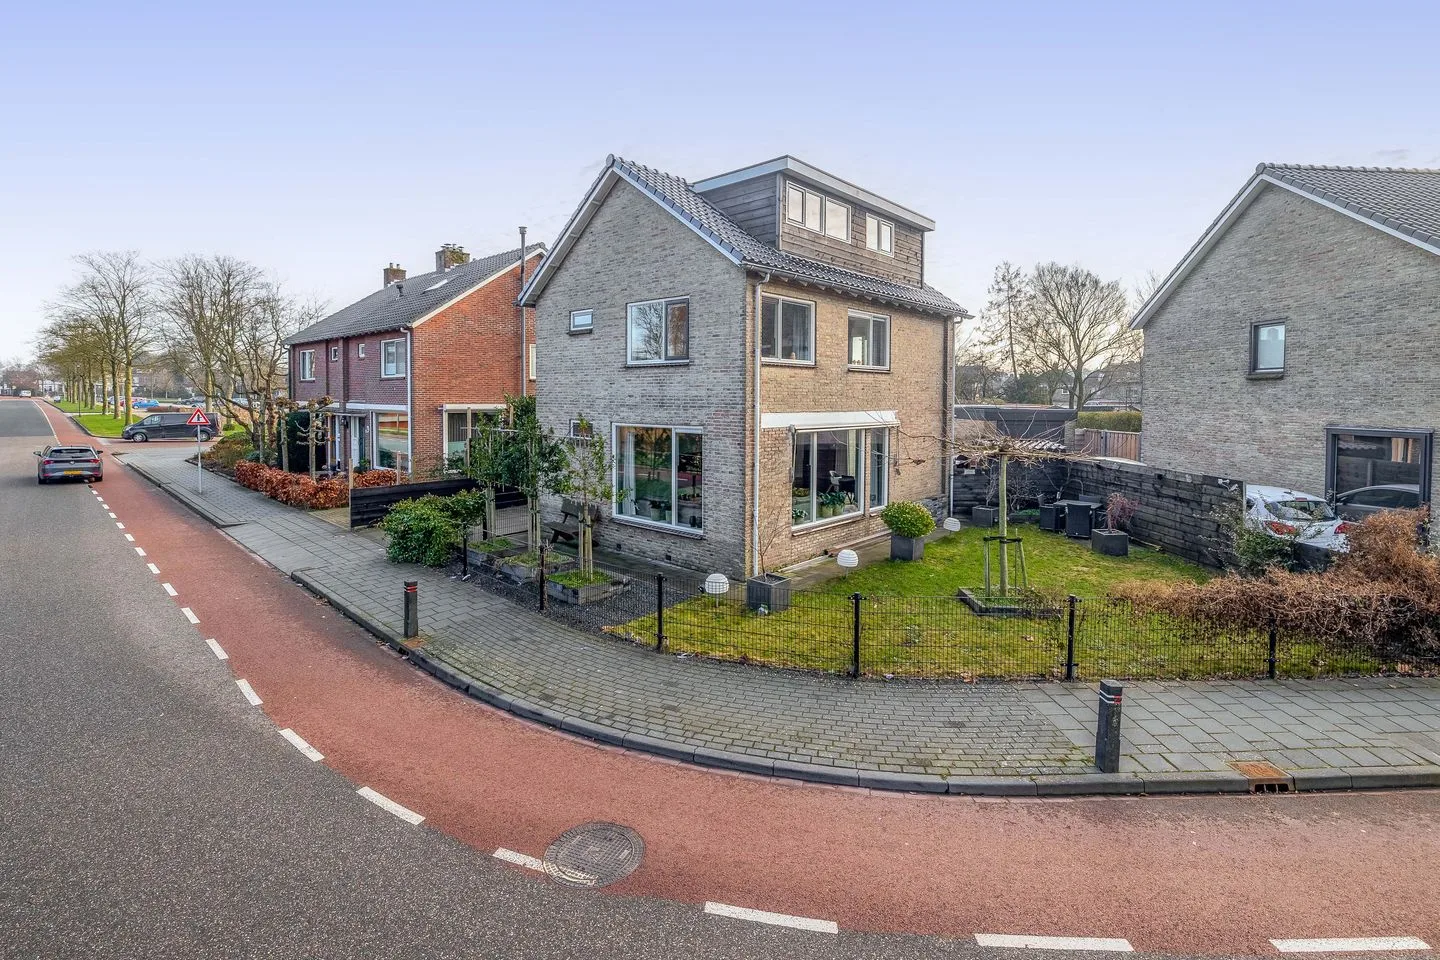
Steenwijkerdiep 85
8331LR Steenwijk
€ 419.000 k.k.
€ 4.149/m²
FSave as favorite- Living area
- 101 m²
- Land area
- 682 m²
- Bedrooms
- 3
Reviews (41)
Review platforms
BronscoresTotal score
41 total reviews

Funda
22 reviews on Funda

19 reviews on Google
-
Jan van Riebeeckstraat 156
9Translated by AIThe contact is very pleasant and it is handled as expected. The support during the sales process is good.
-
Kornputsingel 20
10Alles in perfectie geregeld, en snel verkocht! Voor iedereen zeer aan te raden. Rustig, betrouwbaar en super vriendelijk.
-
Moeraslanden 6
10Translated by AIGood communication with us. They are professional, flexible and involved real estate agents. Nice presentation in terms of photos and text. Clear explanation regarding procedures, flexible signing. A recommendation to sell or appraise your house!
-
Burgemeester Boldinghlaan 14
9Translated by AIPleasant contact and good advice throughout the entire process. Clear communication and support, all in all, great.
-
Matthijs Kiersstraat 14
8Translated by AIThe real estate office has neat, accurate and to-the-point knowledgeable employees. I have a good feeling about it;}
-
Rentmeester 2
10Translated by AII am very satisfied with the cooperation with Boer and ten Hoeve. The personal approach appealed to me greatly. During the valuation, I received clear tips and a plan of action. After each viewing, there was a follow-up call summarizing the visit. Even after the house was sold, I was well assisted and kept informed by Anja and Joke. Once again, I am very satisfied!
-
Steenwijkerdiep 98
10Translated by AIVery friendly and that is what I like, easy to get along with and yet successful. The way of guiding I find very good.
-
Henric de Cranestraat 6
9Translated by AIContact was excellent. Initially, we still had a number of questions but after calling the company, this was resolved. Everything went quickly and smoothly.
-
Divisie 9 A
9Translated by AIContact with the real estate agent went very smoothly. Always easily accessible for any question. Super!
-
De teeme 5
9Translated by AIContact ran smoothly, quickly found the right buyer. Further good guidance. Few viewings and was tightly and efficiently replanned.
-
Compagnie 53
8Translated by AIGood realtor! Expert and accurate, good valuation beforehand and a good pricing strategy. He also handled the sales process neatly. A very small point for improvement is communication; it could have been slightly more proactive from our side. Otherwise, highly recommended!
-
Hagenbroekweg 2
9Translated by AIAnja Oosterhof from Boer and ten Hoeve made a reliable impression on us and is also very knowledgeable and very friendly.
-
Hans Evers
2Translated by AIVery bad experience with this realtor, 1 day after the purchase there were hidden defects. Afterwards, the realtor is unresponsive and of course takes the side of the selling party. The service and mediation from this realtor leaves much to be desired. Despite all the positive reviews on this site, I still feel compelled to report it to warn other buyers that they should take plenty of time during the inspection and not let themselves be rushed by this realtor.
-
wilko rook
10 -
Dieptol 33
10Translated by AIContact with the real estate agent is great! They know what they're talking about and remember who you are! Really nice! I would definitely go back if needed and I would also recommend them to everyone!
-
Henric de Cranestraat 48
9Translated by AIThe contact went very well. We were kept well informed about everything and on time. We definitely recommend them.
-
Molenstraat 16
10Translated by AIThe real estate agent keeps you constantly informed throughout the entire process and provides good advice. Pleasant collaboration!
-
Boomsluiters 5
9Translated by AIWell helped by Martijn and his colleagues in the sale of our mother's house. Quick and professional.
-
Kornputsingel 7
10Translated by AII was very well assisted. Work is done with great care. All hooks, eyes, and pitfalls are considered, without overlooking any details. The guidance and proactive involvement throughout the entire process gives me a very pleasant feeling. A real recommendation!
-
Oostwold 7
9Translated by AIGood information about the process and a clear strategy aimed at achieving the best possible result. Neat feedback after each viewing and indicating multiple options when it came to the sales process.