
Partner Wonen BV is a real estate agency with expertise in the housing market in Uden and surrounding areas. We offer personal guidance when buying, selling, or appraising homes. Our experience ensures a reliable partner in the purchase or sale of your home. With us, you will receive support in finding the right property or selling your current house. We are ready to assist you with legal, constructional, and financial advice. In additi...
Current housing stock
-

- Available
G.K. van Hogendorplaan 6
5463BN Veghel
€ 325.000 k.k.
€ 2.372/m²
Save as favorite- Living area
- 137 m²
- Land area
- 166 m²
- Bedrooms
- 5
-

- Available
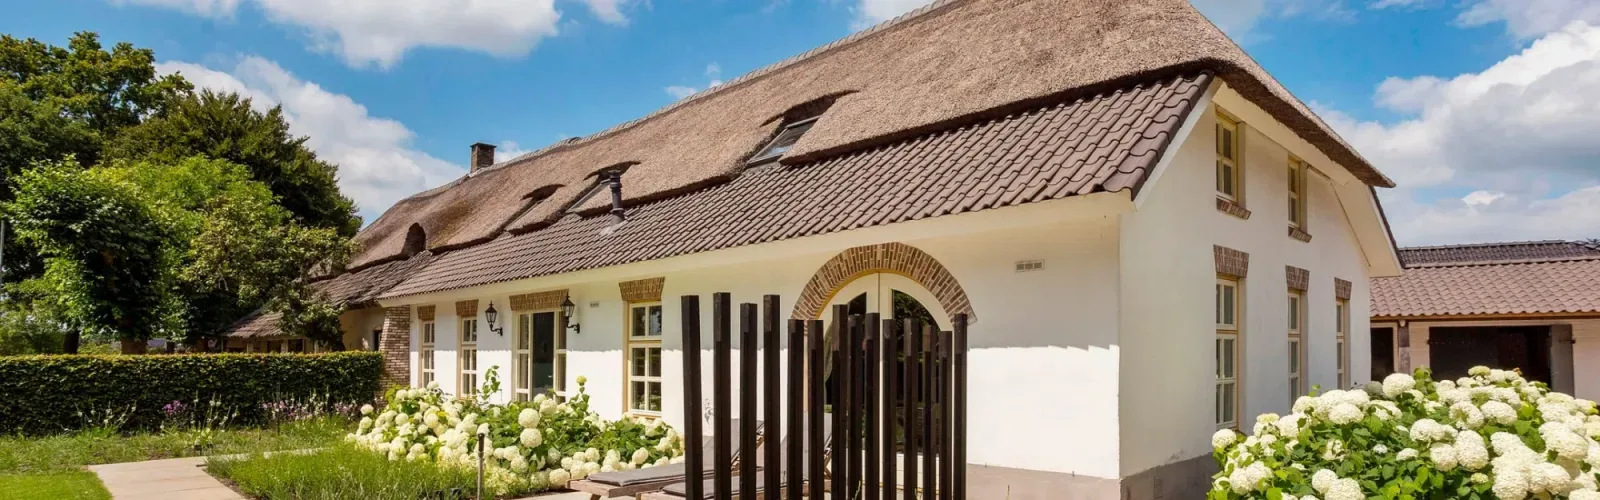
Vondellaan 159
5421PT Gemert
€ 425.000 k.k.
€ 4.942/m²
ASave as favorite- Living area
- 86 m²
- Land area
- —
- Bedrooms
- 2
-
- Available
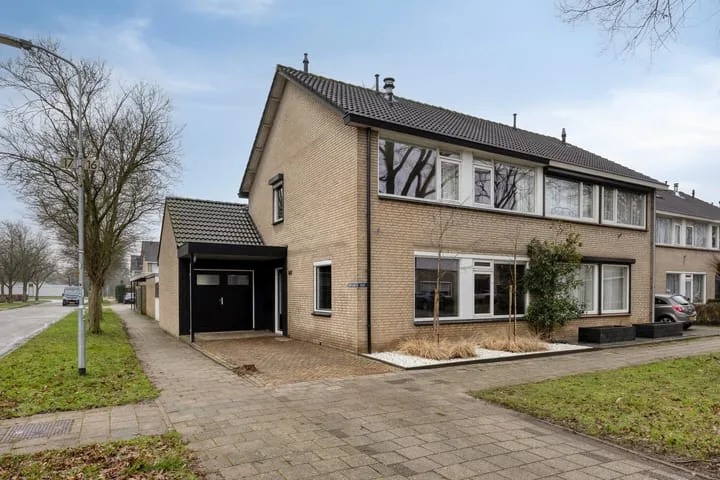
Malder 14
5406CC Uden
€ 490.000 k.k.
€ 3.920/m²
ASave as favorite- Living area
- 125 m²
- Land area
- 142 m²
- Bedrooms
- 4
-

- Available
Kerkakkers 7
5411TN Zeeland
€ 785.000 k.k.
€ 4.816/m²
DSave as favorite- Living area
- 163 m²
- Land area
- 807 m²
- Bedrooms
- 3
-

- Available
Bevrijdingshof 1
5402KB Uden
€ 775.000 k.k.
€ 5.420/m²
ASave as favorite- Living area
- 143 m²
- Land area
- —
- Bedrooms
- 2
-

- Available
St.-Janstraat 46
5424TT Elsendorp
€ 550.000 k.k.
€ 3.667/m²
CSave as favorite- Living area
- 150 m²
- Land area
- 599 m²
- Bedrooms
- 3
Reviews (7)
Review platforms
BronscoresTotal score
7 total reviews

Funda
5 reviews on Funda

2 reviews on Google
-
Landschrijversveld 115
9Translated by AIWe are very satisfied with Partner Wonen. The expertise, service and guidance really spoke to us. The contact with the real estate agent was very pleasant. Next time I would choose Partner Wonen again.
-
Morene 412
10Translated by AIA great real estate agency and very customer friendly. They flawlessly fulfill all made appointments.
-
Den Akker 14
9Translated by AIThe real estate agent responds quickly and adheres to the agreements made. The property was well marketed and sold quickly.
-
Julianastraat 1 L
10Translated by AIOur experience with this broker is undoubtedly positive. It started with a pleasant and clear introductory meeting with Allard at our home. He seemed professional and exuded expertise. Subsequently, Allard and Lindy took on the process together with us. We were kept well informed throughout the entire process, received clear and honest advice and – perhaps most importantly – we really noticed that they committed themselves to us. No standard…
-
Markt 57
9Translated by AIPleasant contact, fast service and good advice. Partly due to this, the sale went very quickly and with good conditions. I am very satisfied.
-
Carmen van Noordenburg
2 -
Claudia van Nimwegen
10